ORIGIN
AL RESEAR
CH
1Postgraduate Program in Rehabilitation Sciences, Universidade Nove de Julho (Uninove) – São Paulo (SP), Brazil.
395
Corresponding address: Anderson José – Postgraduate Program in Rehabilitation Sciences, Nove de Julho University – Rua Vergueiro, 235/249, Liberdade – São Paulo (SP), Brazil – Zip Code: 01504-001 – E-mail: [email protected] – Financing source: Nothing to declare – Conflict of interests: Nothing to declare – Presentation: Jun. 8th, 2017 –
Accepted for publication: Jan. 4th, 2018 – This study was approved by the Local Research Ethics Committee (process number 48704).
Incremental shuttle walk test performed in a hallway
and on a treadmill: are they interchangeable?
Shuttle walk teste incremental realizado no corredor e na esteira: eles são intercambiáveis?
La prueba incremental Shuttle walk realizada en el pasillo y la cinta caminadora: ¿son
intercambiables?
Cristiane Santos de Oliveira1, Anderson José1, Crislaine Oliveira Santos1, Cristiane Helga Yamane de
Oliveira1, Thiago Cristiano Oliveira Carvalho1, Jaksoel Cunha Silva1, Jessyca Pachi Rodrigues Selman1,
Rejane Agnelo Silva de Castro1, Anderson Alves de Camargo1, Simone Dal Corso1
ABSTRACT | The performances of healthy individuals in an incremental shuttle walking test performed in a hallway (ISWT-H) and on a treadmill (ISWT-T) were compared to assess their physiological responses during aerobic training sessions with the speeds estimated from both tests. This was a cross-sectional study with 55 healthy subjects, who were randomized to perform the ISWT tests with 24 hours between them. Training sessions were held using a treadmill at 75% of the speeds obtained from the ISWT-H and ISWT-T. Measurements included walking distance, oxygen uptake (VO2), carbon dioxide (VCO2) production, heart rate (HR), and ventilation (VE). There was a significant difference between walking distances (ISWT-T: 823.9±165.2 m and ISWT-H:685.4±141.4 m), but similar physiological responses for VO2 (28.6±6.6 vs. 29.0±7.3 ml-1.kg-1.min-1), VCO
2
(1.9±0.7 vs. 1.9±0.5 1), HR (158.3±17.8 vs. 158.6±17.7 bpm), and VE (41.5±10.4 vs. 43.7±12.9 1). The estimated speeds were different for the training sessions (5.5±0.5 km/h and 4.9±0.3 km/h), as well as the VO2, VCO2, VE, and HR. It was concluded that in healthy young adults, ISWTs carried out in a hallway and on a treadmill are not interchangeable. Since the ISWT-H was determined to have lower speed, the training intensity based on this test may underestimate a patient’s responses to aerobic training.
Keywords | Exercise Test; Exercise; Walking; Oxygen Consumption.
RESUMO | Comparou-se o desempenho no shuttle walk teste incremental realizado no corredor (SWTI-C) e na esteira (SWTI-E) em indivíduos saudáveis e comparar as respostas fisiológicas durante as sessões de treinamento
aeróbio com as velocidades estimadas em ambos os testes. Trata-se de um estudo transversal com cinquenta e cinco participantes saudáveis. Os participantes foram randomizados para realizar os testes com 24 horas de intervalo. As sessões de treinamento foram realizadas na esteira com 75% da velocidade obtida no SWTI-C e no SWTI-E. As avaliações incluíram a distância da caminhada, consumo de oxigênio (VO2), produção de dióxido de carbono (VCO2), frequência cardíaca (FC) e ventilação (VE). Houve uma diferença significante entre as distâncias caminhadas (SWTI-E: 823,9 ± 165,2 m e SWTI-C: 685,4 ± 141,4 m), mas respostas fisiológicas semelhantes para o VO2 (28,6 ± 6,6 vs. 29,0 ± 7,3 ml-1.kg-1.
min-1), VCO
2 (1,9 ± 0,7 vs. 1,9 ± 0,5 1), HR (158,3 ± 17,8 vs.
158,6 ± 17,7 bpm) e VE (41,5 ± 10,4 vs. 43,7 ± 12,9 1). As velocidades estimadas foram diferentes para as sessões de treinamento (5,5 ± 0,5xkm/h e 4,9 ± 0,3 km/h), assim como o VO2, VCO2, VE e FC. Concluiu-se que em adultos jovens saudáveis, SWTI realizados no corredor e na esteira não são intercambiáveis. Uma vez que o SWTI-E determinou uma menor velocidade, a intensidade do treinamento baseada neste teste pode subestimar as respostas de um paciente ao treinamento aeróbio.
Descritores | Teste de Esforço; Exercício; Caminhada; Consumo de Oxigênio.
velocidades estimadas en ambas pruebas. Estudio transversal con 55 individuos sanos. A los participantes se les eligieron al azar para realizar las pruebas con intervalo de 24 horas. Se llevaron a cabo sesiones de entrenamiento en la cinta caminadora con el 75 % de la velocidad obtenida en SWPI-P y en SWPC. Se incluyen entre las evaluaciones la distancia de la caminata, el consumo de oxígeno (VO2), la producción de dióxido de carbono (VCO2), la frecuencia cardiaca (FC) y la ventilación (VE). Hubo una diferencia significativa entre las distancias recorridas (SWPC: 823,9 ± 165,2 m y SWPI-P: 685,4 ± 141,4 m), pero similares a las respuestas fisiológicas del VO2 (28,6 ± 6,6 vs. 29,0 ± 7,3 ml-1.kg-1. min-1), VCO
2 (1,9 ± 0,7 vs.
± 1,9 0,5 1), HR (158,3 ± 17,8 vs. 158,6 ± 17,7 bpm) y VE (41,5 ± 10,4 vs. 43,7 ± 12,9 1). Las velocidades estimadas fueron diferentes en las sesiones de entrenamiento (5,5 ± 0,5 km/h y 4,9 ± 0,3 km/h), así como VO2, VCO2, VE y FC. Se concluyó que, en los adultos jóvenes sanos, la SWPI llevada a cabo en el pasillo y en la cinta caminadora no pueden ser intercambiables. Dado que la SWPC determinó una menor velocidad, la intensidad de entrenamiento de esta prueba puede subestimar las respuestas de un paciente en el entrenamiento aeróbico.
Palabras clave | Prueba de Esfuerzo; Ejercicio; Caminata; Consumo de Oxígeno.
INTRODUCTION
The incremental shuttle walking test (ISWT) was designed to evaluate exercise capacity in patients with
chronic pulmonary diseases1.The ISWT is a reproducible
test with established reference values, and it is responsive
to interventions2,3. In addition, previous studies have
estimated the training intensity on a treadmill based on
the peak speed reached during an ISWT4.However, a
common disadvantage in relation to walking-based tests is the need for an appropriate physical space (10 m long in the case of the ISWT), which may not be available in hospitals, offices or clinics, or for patients receiving outpatient care. In addition, the need for continuous monitoring and oxygen supplementation in some of these patients makes performing the test difficult.
The six-minute walk test (6MWT) has similar limitations; for example, it requires a bigger hallway
(30 m)2.To overcome this issue, the 6MWT has been
performed on a treadmill; however, this strategy has led to a
substantial decrease in walking distance5,6.One explanation
for this finding was the time spent adjusting the speed of
the treadmill6,since the rhythm of the 6MWT is
self-paced. It is possible that the ISWT, an externally-paced test, promotes similar walking distances and physiological responses when performed on a treadmill (ISWT-T) and in a hallway (ISWT-H). This assumption is based on a previous study that found no differences in walking distance, heart rate, dyspnea, or perception of effort when compared to the endurance shuttle walking test, another externally-paced test, performed on a treadmill and in
a hallway7.Although some differences do occur in the
patterns of muscle activation and joint movements
between walking in a hallway and on a treadmill, the
overall patterns of the two modes are fairly similar8, as
is the energy expenditure9.
A few studies have compared the ISWT-H and the ISWT-T; however, their findings were controversial due to the small size of the samples of patients with
cardiovascular disease (n=8)10, post-myocardial infarction
(n=10)9, and idiopathic pulmonary disease (n=19)11, which
may have incurred a type-II error. Moreover, there have been no previous studies including patients with chronic pulmonary disease. Before considering this specific population, it was helpful to test the replacement of the hallway with the treadmill, and perform the ISWT in healthy subjects to evaluate the safety and concordance of their physiological responses during both tests. Then, these individuals were evaluated during physical training sessions based on the velocities obtained from the ISWT-H and ISWT-T.
METHODOLOGY
Study design
This was a cross-sectional study performed in two visits (24 hours apart). During the first visit, spirometry was performed, and each subject’s body mass index (BMI)
was calculated (weight/height2)12.The subjects were
randomized to perform the ISWT-H or ISWT-T first. Thirty minutes after the ISWT-H or ISWT-T, a training session was held on a treadmill at 75% of the speed obtained from either the ISWT-H or ISWT-T (whichever one was performed that day). The flowchart of the selection of participants and the procedures are shown in Figure 1.
Sample
Through convenience sampling, 62 adult healthy individuals of both sexes, with normal lung function and a sedentary lifestyle (self-reported, individuals who performed physical activity less than 150min per week having been considered as sedentary) were studied. Individuals with a history of smoking, neuromuscular or musculoskeletal diseases, cardiopulmonary disease, acute respiratory infection, or a BMI indicating obesity
(BMI≥30 kg/m2) were excluded. This study was approved
by the Local Research Ethics Committee (process number 418704), and all of the participants signed an informed consent form before the assessments.
Assessments
Spirometry
Spirometry was performed using an ULTIMA CPX (Medical Graphics, St. Paul, Minnesota, USA). The acceptability and reproducibility criteria adopted for the technical procedures were those recommended by
the Brazilian guidelines for testing lung function13. The
forced vital capacity (FVC), forced expiratory volume
in the first second (FEV1), and FEV1/FVC ratio were
expressed in absolute values and as percentage of the
predicted value for the Brazilian population14.
Incremental shuttle walking test – hallway
The ISWT-H was performed according to the original
description1 in a 10 m-long hallway. This distance was
marked by two cones that were placed 0.5 m from each edge. The individual followed this route at a predetermined
speed imposed by an audible prerecorded rhythm. The ISWT was composed of 12 levels lasting one minute each, with an initial 0.5 m/s speed and 0.17 m/s increments each minute, reaching a maximum 2.37 m/s speed. The test was interrupted if the individual did not successfully reach one of the cones at the time of the sound stimulus (0.5 m before the cone) twice. Other reasons for discontinuing the test were chest pain, intolerable dyspnea, leg cramps, staggering, diaphoresis, or a pale
or ashen appearance2.
Heart rate (HR) (Polar Precision Performance; Polar Electro, Kem-skin, Finland) and oxygen pulse saturation (9500; Nonin, Plymouth, Minnesota, USA) were continuously measured during the test. The blood pressure and Borg Rating of Perceived Exertion for dyspnea and
lower limb fatigue15 were obtained at rest and immediately
after the end of the exercise. The walking distance was expressed as an absolute value and as percentage of the
predicted value3.
Incremental shuttle walking test – treadmill
The ISWT-T was performed on a treadmill without incline (Millennium Classic; Inbrasport, Porto Alegre, RS, Brazil) following the same protocol as the ISWT-H (above). The criterion for the interruption of the ISWT was a patient being 0.5 m from the cone at the time of the sound stimulus during two consecutive attempts. Then, a demarcation was established with masking tape fixed to the treadmill’s bearing bar in parallel with the lower limb on each side of the treadmill for a similar test interruption parameter. In this context, the ISWT-T was interrupted if a patient did not keep the position of the lower limbs parallel to the masking tape two consecutive times during the sound stimulus. The handrail support was used by all subjects. The reasons for discontinuing the test were the same as those for the ISWT-H. The same variables described for the ISWT-H were measured during the ISWT-T.
Aerobic training session
A subgroup of 18 out of 55 participants selected through convenience sampling was evaluated to compare the acute physiological responses to the training sessions. For this test, the aerobic training speed was set to 75% of the maximum speed obtained from the ISWT-H or
the ISWT-T16. The session lasted 20 minutes: 5 minutes
during the training session were the same as those measured during the ISWT-H and ISWT-T tests.
Gas exchange analysis
During the two tests and training sessions, a portable metabolic system (VO2000; Medical Graphics, St. Paul, MN, USA) was used to measure the oxygen
uptake (VO2), carbon dioxide production (VCO2) and
ventilation (VE). Before every test, a system calibration was performed according to the recommendations of the manufacturer. The measurements were taken at rest in the sitting position, throughout the entire test, and during the two-minute recovery period. For the metabolic and ventilatory analyses, the peak of the average of the test’s last 30 seconds and the peak of the average of the training session’s last three minutes were considered.
Statistical analysis
The data analysis was performed using the SPSS 20.0 software (SPSS, Chicago, Illinois, USA). The Shapiro-Wilk test was used to determine the normality of the
data, and the data were expressed as means and standard deviations according to the adherence to the Gaussian curve. A Student’s paired t-test was performed to compare the variables at the peak of the exercise between the two tests, and to compare the variables between the two
training sessions. Comparisons of the VO2, VE, and HR
were performed every minute by using the analysis of
variance (ANOVA) for repeated measures, with a post
hoc Bonferroni analysis. The level of significance was
p<0.05, and effect size was calculated using Cohen’s test. The statistical power of the sample size was calculated
a posteriori using the G*Power software (Universität
Düsseldorf, Germany).
RESULTS
Sixty-two healthy subjects were recruited for this study. After seven exclusions, 55 subjects were surveyed (Figure 1). The baseline characteristics are shown in Table 1.
Screened for recruitment: 62 subjects
Excluded: 7
Did not complete the assessments:4 Spirometic abnormalities: 2
Obesity: 1
Total sample: 55 Randomization
Performed the ISWT-T: 55
Training with 75% velocity in the ISWT-T: 18
Training with 75% velocity in the ISWT-H: 18 Performed the ISWT-H: 55
Table 1. Baseline characteristics
Variables ISWT Group
n=55
Training Group N=18
Age, years 24.8±8.3 25.3±12.7
Male/Female 26/29 4/14
Weight, kg 64.5±10.9 58.9±7.9
Height, m 1.7±0.1 1.6±0.7
Body Mass Index, kg/m2 23.1±3.0 22.1±2.8
FVC, L 4.1±0.8 3.7±0.6
FVC, % pred 97.6±13.6 98.3±9.4
FEV1, L 3.5±0.7 3.2±0.7
FEV1, % pred 95.0±13.8 96.5±12.7
FEV1/FVC 0.9±0.1 0.7±0.1
ISWT: incremental shuttle walk test, kg: kilogram, m: meters, kg/m2: kilogram per square meter, FVC:
forced vital capacity, L: liters, % pred: percentage predicted, FEV1: forced expiratory volume in 1 second
A better performance (walking distance, speed, and test stage) was observed in the ISWT-T when compared to the ISWT-H (Table 2). For the distance walked, effect size was 0.89 and sample power was 0.99. A
higher VO2 (l/min) also occurred in the ISWT-H when
compared to the ISWT-T (Table 2). The performances at each stage of the ISWT-H and ISWT-T showed
linear increases in HR, VO2, and VE in both tests. The
results showed significant differences between the two
tests during the same stages of the ISWT: the VO2 of
the 8th stage, the ventilation of the 7th stage, and the
HR of the 10thstage (Figure 2).
Table 2. Comparison between the cardiopulmonary variables at the end of the ISWT-H and of the ISWT-T
Variables n=55
ISWT-H ISWT-T P
Distance, m 685.4±141.4 823.9±165.2 <0.001 Dist, % pred 60.1±8.9 73.0±16.7 <0.001 Velocity, km/h 6.8±0.7 7.3±0.6 <0.001
Stages 10.1±1.3 10.9±1.1 <0.001
HR, bpm 158.3±17.7 158.6±17.8 0.88
HR, % pred 81.1±8.4 81.2±8.6 0.88
SpO2, % 97.0±1.3 97.2±1.0 0.30
Borg dyspnea 2.1±1.9 1.8±1.7 0.31
Borg lower limb 2.9±2.5 2.9±2.3 0.88
VO2, L/min 1.9±0.6 1.8±0.5 0.01
VO2, ml kg-1 min-1 29.0±7.3 28.6±6.6 0.67
VO2, % pred 81.2±13.9 85.3±13.9 0.79
VCO2, L 1.9±0.7 1.9±0.5 0.10
RQ 1.0±0.1 1.0±0.1 0.42
VE, L/min 43.7±12.9 41.5±10.4 0.19
VE/MVV 0.3±0.1 0.3±0.1 0.24
ISWT-H: incremental shuttle walk test in hallway; ISWT-T: incremental shuttle walk test on treadmill; m: meters: % pred: percentage predicted; HR: heart rate; bpm: beats per minute; SpO2%: pulse
oxygen saturation; VO2: oxygen uptake; ml.kg
-1 min-1: milliliters per kilogram per minute; L: liters;
VCO2: carbon dioxide production; VE: ventilation; L/min: liters per minute; VE/MVV: ventilation/
maximum voluntary ventilation; RQ: respiratory quotient
Values are expressed as mean and with 95% confidence interval; ISWT-H: incremental shuttle walk test in hallway; ISWT-T: incremental shuttle walk test on treadmill (ISWT-T). N=55 until 7th stage.
*Significant difference between tests (P<0.05)
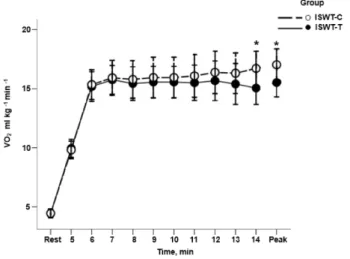
During the training sessions, significant differences in the metabolic, ventilatory, and cardiorespiratory responses were observed between the ISWT-T and ISWT-H. The percentages of the speeds determined from both tests was higher in the ISWT-T than in the ISWT-H, with 1.38 effect size and 1.0 sample power (Table 3). The
changes in VO2 (ml.kg-1.min-1) during each minute of
the training session can be seen in Figure 3.
Table 3. Comparison between groups at the peak of the training session
Variables N=18
ISWT-H ISWT-T P
Velocity 75 % 4.9±0.3 5.5±0.5 <0.001
VO2, L/min 0.9±0.1 0.9±0.2 0.12
VO2,ml kg-1 min-1 14.9±2.5 16.4±3.0 0.008
VO2, % pred 44.4±8.8 48.5±10.3 0.008
VCO2, L 0.7±0.1 0.8±0.1 0.03
RQ 0.8±0.1 0.9±0.1 0.40
VE, L/min 18.3±3.1 20.2±4.1 0.03
VE/MVV 0.1±0.0 0.2±0.5 0.03
HR, bpm 110.3±11.7 115.4±11.9 0.04
HR, % pred 56.7±5.6 59.5±6.5 0.03
SpO2 % 97.4±1.4 97.2±0.9 0.45
Borg dyspnea 0.3±0.5 0.2±0.4 0.75
Borg lower limb 0.3±0.6 0.4±0.5 0.36
SBP, mmHg 129.4±16.9 125.6±12.5 0.13
DBP, mmHg 77.7±7.3 76.1±6.9 0.48
ISWT-H: incremental shuttle walk test in hallway; ISWT-T: incremental shuttle walk test on treadmill; ml.kg-1.min-1: milliliters per kilogram per minute; VO
2: oxygen uptake; % pred: percentage predicted;
VE: ventilation; L/min: liters per minute; RQ: respiratory quotient; HR: heart rate; bpm: beats per minute; SpO2: pulse oxygen saturation; SBP: systolic blood pressure; mmHg: millimeters per
mercury; DBP: diastolic blood pressure
Values are expressed as mean and with 95% confidence interval. n=18. *Significant difference between tests (P<0.05)
Figure 3. Oxygen consumption (VO2 ml kg-1 min-1) during training
with loads obtained in the Incremental Shuttle Walk Test in Hallway (ISWT-H) and in the Incremental Shuttle Walk Test on Treadmill (ISWT-T)
Overall, the tests and the training sessions were safe for the participants. No adverse effects were observed during the procedures, and all of the subjects completed them without reporting any difficulties.
DISCUSSION
This study compared the cardiopulmonary and metabolic performance of healthy subjects during an ISWT-H and ISWT-T, and evaluated their physiological responses during aerobic training sessions with the intensities obtained from the ISWT-T and ISWT-H. The main findings of this study may be summarized as follows: (i) the ISWT-T showed greater walking distance and speed, but similar cardiorespiratory and metabolic demands in relation to the ISWT-H at the peaks of the tests; (ii) during the different stages of the
ISWT, the ISWT-H showed superior demand (VO2,
VE, and HR) when compared to the ISWT-T in the 7th
stage; (iii) during the training session, greater metabolic and ventilatory requirements were observed with the speed obtained in the ISWT-T when compared to the ISWT-H; and (iv) performing the ISWT on a treadmill was a safe procedure. Considering these findings, we can say that the tests were not interchangeable, thus negating our hypothesis.
A substantial reduction in walking distance
[51.2±85.3m6 and 102 m (95% CI 65–139)5 has been
described when the 6MWT was performed on a treadmill. Additionally, when the 6MWT was performed on a non-motorized treadmill, the walking distance was even
lower (-153 m)17.Similar results also occurred in the
comparison between the 12-minute walk test in a hallway (12MWT-H) and on a treadmill (12MWT-T), with
82m18 and 49m19 differences between tests, respectively.
One of the hypotheses for this finding is the lack of
familiarity with the treadmill20.Therefore, conducting
field tests on a treadmill has is recommended for the
assessment of functional capacity20.
Some previous studies have compared the ISWT-H with the ISWT-T; however, the findings were controversial. For example, a pilot study with heart disease patients (n=8) showed a higher energy cost per meter, indirectly calculated, in the ISWT-T (3.22±0.55 J/kg/m) when compared to the ISWT-H (3.00±0.41 J/kg/m), but this pattern was reversed at 1.52 m/s and 1.69 m/s walking speeds when the shuttle walking test had a greater
Thus, the metabolic cost of walking on a treadmill did
not reflect that of walking on the ground10.Moreover,
the current equations used to estimate the metabolic energy cost in the ISWT-H should not be applied when
the ISWT is performed on a treadmill10.However, in
a study with idiopathic pulmonary fibrosis patients (n=10), the ISWT-T showed better performance than
the ISWT-H (mean difference: 43m)11,while the control
group in another study with healthy subjects (n=19) did not show differences in the energy expenditure between the ISWT-H and ISWT-T (mean difference: -1.1±1.96
METs)9.It is possible that the small sample sizes of these
studies may have caused a type-II error.
No differences were found in walking distance, HR, dyspnea, or perception of effort when patients with chronic obstructive pulmonary disease (COPD) performed endurance tests with the same speeds on a treadmill
and in a hallway7.However, during an incremental test,
differences may occur between workloads that require increasingly greater effort, as demonstrated in our study.
The physiological responses of the VO2, VE, and HR
began to show significant differences in the phases with an increased load when compared to the same iso stage (Figure 2). The same behavior has been shown in healthy
subjects at higher speeds in the ISWT (3mph)9.
Contrary to a variety of studies5,6,10,18-19,better
performance was found on the treadmill in our study. The demands were higher for the ISWT-H at the same stage (speed) as the ISWT-T, and the variables at the peak of the exercise were similar, despite the ISWT-T having resulted in greater walking distance and longer duration. We hypothesized that this was due to the arms being supported during the ISWT-T. It is known that the primary mechanism for balance maintenance during
walking is the width of the step21 and the swinging of the
arms22-23.With regard to the first mechanism, it has been
shown that no differences exist in the intervals of time and the distance of the steps between walking in a hallway and
on a treadmill19,24.However, eliminating the movement
of the arms while walking results in a decrease in the
interval between steps21, as does allowing the individuals
to support themselves with their hands21,24.This support
increases the side body balance during walking, reducing energy consumption and the demand required to maintain
balance22-24. A similar effect occurs when manual support
(using the hands) is allowed during step-based exercises,
reducing VO2 and the HR25.
The role of the arms significantly affects the responses related to exertion while walking. Overall, allowing manual
support reduces variability in the steps by 12%21,HR by
18 bpm, energy expenditure by 2.81 kcal/min, perception of effort in the lower limb measured using the Borg scale
by 1.92 points26 and VO
2 expressed as l/min by 0.175
27
and as ml.kg-1.min-1 by 7.7526. Due to this effect, and as
demonstrated in our study, the exercise’s maximum time duration is different, depending on whether the hands are
or are not used for support (9.9±4.1 min vs 8.0±2.9 min)28.
The responses to exercise are also influenced by the intensity of the support provided by the hands. Significant differences exist when the hands are free and when they
are used only as support (8.4% reduction in the VO2 and
3.5% in the HR) versus when they are used with a strong
grip (21% reduction in the VO2 and 14.8% in the HR)29.
The same effect occurs in the perception of exertion, which decreases as the hands are free, with support and with a
strong grip, respectively29.These findings are consistent
with our study in which, although the maximum load achieved in the ISWT-T was greater, a similar perception of effort existed between the tests, because the support provided by the hands decreased this exertion.
Given these findings, the swinging of the arms and the support provided by the hands are important factors to consider during the evaluation and prescription of exercise
on a treadmill22, 23, demonstrating the need to standardize
the position of the hands during prescription exercises, or to study the comparative effects of this support after
the interventions27,28,30.
As expected, our study demonstrated that during training, the cardiorespiratory and metabolic demands were higher with the load obtained by the ISWT-T; therefore, if the training intensity on the treadmill is estimated from the ISWT-H, the aerobic training is possibly being underestimated. However, even using the workload determined by the ISWT-T, the training intensity corresponded to 59.5% of the maximum HR predicted, reinforcing sub-training. The greatest benefits obtained by aerobic training are related to training intensity (moderate-to-intense), which is directly related to better improvement in the exercise capacity and a reduction of
symptoms in individuals with chronic diseases31.
Study limitations
were performed in the same way. Considering that the responses to training were underestimated, we could have used the modified ISWT, which allows running, but the objective of this study was to compare the classic protocols of the ISWT, which was developed for patients with chronic lung diseases. Finally, another limitation of the
study is its convenience sample; however, the a posteriori
statistical power showed a sample power higher than 80%.
CONCLUSION
The performances of healthy young adults in ISWTs carried out in a hallway and on a treadmill are not interchangeable. Since the ISWT-H was determined to have lower speed, the training intensity based on this test may underestimate a patient’s responses to aerobic training.
REFERENCES
1. Parreira VF, Janaudis-Ferreira T, Evans RA, Mathur S, Goldstein RS, Brooks D. Measurement properties of the incremental shuttle walk test: a systematic review. Chest. 2014;145(6):1357-69. doi:10.1378/chest.13-2071
2. Holland AE, Spruit MA, Singh SJ. How to carry out a field walking test in chronic respiratory disease. Breathe (Sheff). 2015;11(2):128-39. doi:10.1183/20734735.021314
3. Probst VS, Hernandes NA, Teixeira DC, Felcar JM, Mesquita RB, Gonçalves CG, et al. Reference values for the incremental shuttle walking test. Respir Med. 2012;106:243-8. doi:10.1016/j.rmed.2011.07.023
4. Lee AL, Hill CJ, Cecins N, Jenkins S, McDonald CF, Burge AT, et al. The short and long term effects of exercise training in non-cystic fibrosis bronchiectasis: a randomised controlled trial. Respir Res. 2014;15:44. doi:10.1186/1465-9921-15-44 5. De Almeida FG, Victor EG, Rizzo JA. Hallway versus treadmill
6-minute-walk tests in patients with chronic obstructive pulmonary disease. Respir Care. 2009;54(12):1712-6.
6. Stevens D, Elpern E, Sharma K, Szidon P, Ankin M. Comparison of hallway and treadmill six-minute walk tests. Am J Respir Crit Care Med. 1999;160(5Pt1):1540-3. doi:10.1164/ajrccm.160.5.9808139 7. Revill SM, Morgan MD, Singh SJ, Williams J, Hardman AE. The
endurance shuttle walk: a new field test for the assessment of endurance capacity in chronic obstructive pulmonary disease. Thorax. 1999;54(3):213-22. doi:10.1136/thx.54.3.213.
8. Fukuchi CA, Fukuchi RK, Duarte M. A public dataset of overground and treadmill walking kinematics and kinetics in healthy individuals. Peer J. 2018;6:e4640. doi:10.7717/peerj.4640. 9. Woolf-May K, Ferrett D. Metabolic equivalents during the 10-m
shuttle walking test for post-myocardial infarction patients. Br J Sports Med. 2008;42(1):36-41.
10 Almodhy M, Beneke R, Cardoso F, Taylor MJ, Sandercock GR. Pilot investigation of the oxygen demands and metabolic cost of incremental shuttle walking and treadmill walking in patients with cardiovascular disease. BMJ. 2014;16(4):e005216. doi:10.1136/bmjopen-2014-005216
11. Moloney ED, Clayton N, Mukherjee DK, Gallagher CG, Egan JJ. The shuttle walk exercise test in idiopathic pulmonary fibrosis. Resp Med. 2003;97(6):682-7. doi:10.1053/rmed.2003.1501 12. WHO Expert. Committee physical status: the use and
interpretation of anthropometry. World Health Organ Tech Rep Ser. 1995;854:1-452.
13. Sociedade Brasileira de Pneumologia. Diretrizes para testes da função pulmonar. J Pneumol. 2002;28(Supl.3):S44-S58. 14. Rufino R, Costa CH, Lopes AJ, Maiworm AI, Maynard K,
Silva LM, et al. Spirometry reference values in the Brazilian population. Braz J Med Biol Res. 2017;50(3):e5700. doi:10.1590/1414-431X20175700
15. da Silva CA, Helal L, da Silva RP, Belli KC, Umpierre D, Stein R. Association of lower limb compression garments during high-intensity exercise with performance and physiological responses: a systematic review and meta-analysis. Sports Med. 2018;48:1859-73. doi: 10.1007/s40279-018-0927-z
16. Spruit MA, Singh SJ, Garvey C, ZuWallack R, Nici L, Rochester C, et al. An official American Thoracic Society/European Respiratory Society Statement: key concepts and advances in pulmonary rehabilitation. Am J Respir Crit Care Med. 2013;188(8):e13-e64. doi: \10.1164/rccm.201309-1634ST 17. Janaudis-Ferreira T, Sundelin G, Wadell K. Comparison of the
6-minute walk distance test performed on a non-motorised treadmill and in a corridor in healthy elderly subjects. Physiotherapy. 2010;96(3):234-9. doi:10.1016/j.physio.2009.11.015 18. Swerts PM, Mostert R, Wouters EF. Comparison of corridor and
treadmill walking in patients with severe chronic obstructive pulmonary disease. Phys Ther. 1990;70(7):439-42.
19. Beaumont A, Cockcroft A, Guz A. A self paced treadmill walking test for breathless patients. Thorax. 1985;40(6):459-64. 20. Holland AE, Spruit MA, Troosters T, Puhan MA, Pepin V, Saey
D, et al. An official European Respiratory Society/American Thoracic Society technical standard: field walking tests in chronic respiratory disease. Eur Respir J. 2014;44(6):1428-46. doi:10.1183/09031936.00150314
21. Arellano CJ, Kram R. The energetic cost of maintaining lateral balance during human running. J Appl Physiol. 2011;112(3):427-34. doi:10.1152/japplphysiol.00554.2011. 22. Ijmker T, Houdijk H, Lamoth CJ, Beek PJ, van der Woude LH.
Energy cost of balance control during walking decreases with external stabilizer stiffness independent of walking speed. J Biomech. 2013;46(13):2109-14. doi:10.1016/j.jbiomech.2013.07.005 23. Meyns P, Bruijn SM, Duysens J. The how and why of arm
swing during human walking. Gait Posture. 2013;38(4):555-62. doi:10.1016/j.gaitpost.2013.02.006
24. Yentes JM, Denton W, McCamley J, Raffalt PC, Schmid KK. Effect of parameter selection on entropy calculation for long walking trials. Gait Posture. 2018;60:128-34. doi:10.1016/j.gaitpost.2017.11.023 25. Berling J, Foster C, Gibson M, Doberstein S, Porcari J. The effect
26. Hoffmann CL, Dougherty C, Abkarian HK, Fox M, Juris PM. The reduction of metabolic cost while using handrail support during inclined treadmill walking is dependent on the handrail use instruction. Int J Exerc Sci. 2014;7(4):339-45.
27. Foster C, Crowe AJ, Daines E, Dumit M, Green MA, Lettau S, et al. Predicting functional capacity during treadmill testing independent of exercise protocol. Med Sci Sports Exerc. 1996;28(6):752-6. 28. McConnell T, Foster C, Conlin N, Thompson N. Prediction
of functional capacity during treadmill testing: effect of
handrail support. J Cardiopulm Rehabil. 1991;11:255-60. doi:10.1249/00005768-198004001-00318
29. Berling J, Foster C, Gibson M, Doberstein S, Porcari J. The effect of handrail support on oxygen uptake during steady state treadmill exercise. J Cardiopulm Rehabil. 2006;26(6):391-4.