Existential Field 7:
Social Inequality and Diversity of Families
Working Report (April 2010)
Karin Wall, Mafalda Leitão & Vasco Ramos
Institute of Social Sciences, University of Lisbon
FAMILYPLATFORM (SSH‐2009‐3.2.2 Social platform on research for families and
Working Reports
Funded by the European Commission’s Seventh Framework Programme and co‐ordinated by Technical University Dortmund, FAMILYPLATFORM gathers a consortium of 12 organisations working together to articulate key questions about the family for the European Social Science and Humanities Research Agenda 2012‐2013. There are four key stages to the project. The first is to chart and review the major trends of comparative family research in the EU in 8 ‘Existential Fields’ (EF). The second is to critically review existing research on the family, and the third is to build on our understanding of existing issues affecting families and predict future conditions and challenges facing them. The final stage is to bring the results and findings of the previous three stages together, and propose key scientific research questions about families to be tackled with future EU research funding. This Working Report has been produced for the first stage of the project, and is part of a series of reports, as follows: Both full versions and summaries of Working Reports are available to download from the FAMILYPLATFORM website, where stakeholders are invited to comment on the findings, and have an input into the project. EF1. Family Structures & Family Forms EF2. Family Developmental Processes EF3. Major Trends of State Family Policies in Europe EF4a. Family and Living Environment EF4b. Local Politics – Programmes and Best Practice Models EF5. Patterns and Trends of Family Management in the European Union EF6. Social Care and Social Services EF7. Social Inequality and Diversity of Families EF8. Media, Communication and Information Technologies in the European FamilyPage 2 of 223
Contents
About the Authors ...5 Introduction...7 1. Social Inequality in European Societies...9 1.1 Some Indicators and trends ...9 1.1.1 Income Inequality across and within European societies ...9 1.1.2 Beyond income inequality: class structures in European societies...12 1.2 Inequality and Well‐being: Research using Objective and Subjective Indicators ...18 1.2.1 The case for Subjective Indicators ...18 1.2.2 Subjective Indicators of Well Being...19 2. Policies, families and integration: state of the art of migration research in Europe.23 2.1 Framework: a brief history of immigration in Europe ...25 2.2 Review of Research...40 2.2.1 Policies: admission, control, integration and citizenship ...40 2.2.1.1 Admission policies ...40 2.2.1.2 Irregular migration ...48 2.2.1.3 Integration policies and citizenship...50 2.2.2 Families: demography, family migration, gender and age...55 2.2.2.1 Demographic impact ...55 2.2.2.2 Family migration...56 2.2.2.3 Gender...60 2.2.2.3 Age‐related migration ...63 2.2.3 Integration: work, space, identity and second generations...64 2.2.3.1 Labour market ...64 2.2.3.2 Spatial segregation ...65 2.2.3.3 Culture and identity ...67 2.2.3.4 Second generation ...69 2.3 Concluding remarks on families and migration ...73 3. Families and Poverty...77 3.1 Families and poverty: major trends in the EU based on existing statistics...77 Distribution of income and risk of poverty in the EU...77 3.1.1 Incidence of poverty risk by activity status, gender, education, age and types of household ...78 3.1.1.1 Gender and activity status ...78 3.1.1.2 Education...80 3.1.1.3 Age ...81 3.1.1.4 Child poverty ...81 3.1.1.5 Young Adult Poverty...84 3.1.1.6 Poverty of elderly persons ...84 3.1.2 Household Type ...86 3.2 The role of social transfers...88 3.3. Results of the Research Review ...91 3.3.1 The Sex Profile of Poverty – A Gendered Poverty...91 3.3.2 The Age Profile of Poverty: Child Poverty and Youth Poverty ...91 3.3.2.1 Child Poverty ...91 3.3.2.2 Youth Poverty...100 3.3.3 Household Events, Household Types and the Shaping of Poverty...104 3.3.3.1 Household Events...104
Page 3 of 223 3.3.3.2 Single Person Households ...105 3.3.3.3 Lone Parents...105 3.3.3.4 Large Families...109 3.4 Work, Families and Poverty ...111 3.5 Poverty Dynamics: The Ins and Outs of Poverty...113 3.6 Welfare Regimes and Poverty ...116 3.7 Concluding remarks on Poverty and families ...119 3.7.1 Major trends ...119 3.7.2 Main gaps in existing research on families and poverty ...121 4. Families and Family Violence in Europe...122 4.1 Introduction ...122 4.2 Publications ‐ Main Topics And Developments In Time...124 4.3 Family Violence in Europe...127 4.3.1 A systematic review of family violence in Europe...127 4.3.2 Prevalence studies on interpersonal violence ...145 4.3.2.1 Main Findings ...147 4.3.3 The effect of banning corporal punishment in Europe – recent findings ...153 4.4 Concluding remarks on family violence ...156 4.4.1 Violence against children – trends, gaps and research challenges ...156 4.4.2 Violence against women – trends and gaps and research challenges ...157 4.4.3 Violence against men – trends and gaps and research challenges...158 4.4.4 Elder abuse – trends and gaps and research challenges...159 5. Social Inequalities and Families...160 5.1 Introduction ...161 5.2 Social homogamy in couple formation ...163 5.3 Family diversity, conjugal interactions and social determinants...164 5.4 Family division of paid and unpaid work ...165 5.5 Work/family balance and stress, and the impact of social determinants ...176 5.6 Parenting, education and children’s life‐chances ...178 5.7 Family support networks and the importance of class and gender...180 5.8 Concluding remarks: main gaps in existing research and challenges for research and policy ...182 Summary and Conclusions ...184 1. Social Inequality and European Societies...184 2. Families and Migration (Chapter 2)...186 2.1 Main findings and major trends ...186 2.2 Main gaps in existing research on families and immigration and challenges for research...191 3. Families and Poverty (Chapter 3) ...194 3.1 Main findings and major trends...194 3.2 Main gaps in existing research on families and poverty ...195 4. Families and Family Violence (Chapter 4) ...196 4.1 Main findings and major trends...197
4.2 Major research gaps in existing research on families and poverty and main challenges for research ...198
Page 4 of 223 5.1 Major trends and main findings ...200 5.2 Main gaps in existing research on social inequalities and families and challenges for research and policy...202 References ...204 Migration and Families ...204 Social Inequality and Poverty...208 Families and Violence ...211 Social Inequality and Families...217
Page 5 of 223
About the Authors
Karin Wall is a sociologist and a senior research fellow at the Institute of Social Sciences (ICS) of the University of Lisbon. She has carried out national and cross‐national research in the areas of sociology of the family and social policies affecting families. Her research interests include demographic trends and changing family patterns, family interactions and social networks over the life course, gender and family, the reconciliation of work and family life, family policies and social care in Europe, migrant women and families, lone parents. Her recent publications examine the diversity of contemporary family relationships, family life from the male perspective, attitudinal change to gender and family, the politics of parental leave and care regimes in Southern Europe, and changing female migration trajectories.Mafalda Leitão is a sociologist (Ms in social sciences) working as a research assistant at the Institute of Social Sciences (ICS) of the University of Lisbon, Portugal. She has carried out research on voluntary work and the reconciliation of work and family life. Currently she is working on developments in family policies in Portugal and in the European Union. Her research interests include family policies, leave policies and parenthood, social care, gender equality and family oriented services.
Vasco Ramos is a sociologist (ISCTE‐IUL) and a junior research fellow at the ICS (Institute of Social Sciences) of the University of Lisbon since 2009. He is carrying out research on family policies and on social inequalities and family trajectories in an intergenerational perspective. His research interests include family and gender equality, social and geographical mobility and youth subcultures.
Contributing Authors
João Peixoto is a Professor of sociology at the School of Economics and Management (ISEG) of the Technical University of Lisbon and researcher at SOCIUS – Research Centre on Economic and Organizational Sociology. His main research areas are international migrations, demography and economic sociology. He has carried out research, at the national and cross‐national level, in several fields, such as highly skilled migration, modes of incorporation of immigrants in the labour market, immigrants’ trafficking, immigrant women, immigration policy, Portuguese emigration, demographic impacts of migration and immigration into Southern Europe.
Susana Atalaia is a PhD student at the Institute of Social Sciences of the University of Lisbon, with a thesis on parenting in stepfather's families. She studied Sociology at ISCTE – Lisbon University Institute (2003). Her research interests include family dynamics, parenting relations, gender and blended families.
Heloísa Perista is a sociologist, holding a PhD from the University of Leeds. She is a senior researcher and President of the Board of Directors of CESIS ‐ Centre for Studies
Page 6 of 223
for Social Intervention. She has carried out national and cross‐national research and participated in several European research networks over the last 24 years. Her research interests include gender equality, poverty and social exclusion, time use, work and employment, the reconciliation of work and family life, violence against older women, migration and mobility.
Alexandra Silva is a sociologist and a research assistant at the Centre for Studies for Social Intervention (CESIS). She studied sociology at the Universidade Autónoma de Lisboa. Her research interests include gender equality and women’s studies. She has also involved in women’s rights organisations. Isabel Dias is a sociologist and a Professor of Sociology at the University of Porto since 1990. She has co‐ordinated research on “Family, Ageing and Gender” at the Sociology Institute of the University of Porto. She has carried out research in the areas of domestic violence, elder abuse, sociology of the family and gender, ageing, and the reconciliation of work and family life..
Diogo Costa is a psychologist and currently a PhD student in Public Health at the University of Porto Medical School. His research interests include domestic violence, health and social inequalities, and psychiatric epidemiology.
Page 7 of 223
Introduction
Research on social inequality has a long tradition in Europe and has emerged again as an important topic on the research agenda over the last few years. Researchers have been addressing this issue in its manifold expressions. Social inequality (or inequality between social categories) derives from the unequal distribution of various resources (economic, social, political, cultural) and has been analysed in terms of poverty (Atkinson, 1998; Berthoud, 2004), social exclusion and deprivation (cf. Paugam, 1998; Muffels et al., 2002; Gallie et al., 2003), class structure and stratification (Esping‐Andersen, 1993; Crompton, 1998; Bourdieu, 1998; Ornstein, 2007) and educational inequalities (Duru‐ Bellat, 2002; Lahire, 2000). Today, there is a consensus that social inequality and its impact can be observed in many areas of social life, from employment to health, from political involvement to exposure to violence or discrimination (Bihr and Pfefferkorn, 2008). Researchers have been looking at the effects but also the origins of social inequality and the way it is socially produced and reproduced. An explanation for the importance of inequality in today’s research and policy agendas is outlined by Grusky and Kanbur (2006a), drawing on five key aspects: the process and multi‐fold effects of globalization and international migration; an increase in inequality since the mid‐1970s; a new conception of human rights that incorporates the need for a minimum of income; recognition of the negative effects of inequality on the social fabric; an increased awareness of the effects of inequality at an individual level. Several authors have addressed the question of inequality by emphasizing its political importance (Therborn, 2006; Giddens, 2007; Milanovic, 2007; Grusky and Kanbur, 2006a; Barry; 2005). In this context, the phenomenon of inequality is often analysed from the standpoint of "social justice", a perspective fostered by authors such as Rawls (2001) and Fraser (2008), which emphasizes the consequences of injustice when people are prevented from fully participating in social life. Fraser distinguishes three interconnected dimensions of inequality: distributive injustice (related to the class structure of societies); status injustice (or misrecognition); and political injustice (or misrepresentation).
In this state‐of‐art report we focus on some of the more relevant issues from the perspective of social inequality and families within and across European societies. We begin by addressing the three main topics included in this existential field by the Family Platform Project: migration, poverty, family violence. Additionally, we will look at two key issues which are important in contextualizing and discussing the above‐mentioned topics. First, we will summarize recent trends in social inequality in European societies. Secondly, we will review some of existing research on the relationship between social inequalities and families, by examining the impact of social inequality on family forms and dynamics as well as the transmission and reproduction of inequalities within families. Social inequality shapes family life, but families and their members must also be seen as actors in the system of inequality (transmitting inequalities to subsequent generations, reproducing them within the home and through their networks, and resisting the effects of inequality).
Page 8 of 223
Research review in this existential field was carried out separately on each of the above‐ mentioned topics. Migration, poverty and family violence are large and autonomous fields of research which do not have common theoretical and methodological underpinnings or empirical data sets. For this report it was therefore important to grasp the major trends and findings within each research topic before moving on to broader conclusions on research into social inequalities and diversity of families in Europe.
The report is therefore structured along the following lines:
1. First, as a brief introduction to this pivotal issue of inequality and families, we address the question of social inequality in Europe: How unequal are European societies? And how does this relate to the perception of well‐being?
2. Second, we review existing research on migration and migrant families 3. Third, we review existing research on poverty and families
4. Fourth, we review existing research on violence and exposure to violence in different families
5. Fifth, we review existing research on the relationship between social inequality and families
The report is based on a systematic review of cross‐national (European) statistics and databases such as Eurostat, European Social Survey (ESS), European Values Survey (EVS), OECD databases, the International Social Survey Program (ISSP), the Luxembourg Income Study, and the EC Household Panel Study (now SILC). We also carried out a systematic research review in academic publications and journals, including e‐journals such as LARA Database, Social and Human Sciences – Publications, SSRN Social Science Research Network, Sociological Abstracts, Academic Search Elite (EBSCO), b‐on (www.b‐ on.com in Portuguese and English), PUBMED, and in other sources such as the European Commission Research site, Eurofound, and the Imiscoe research site (http://www.imiscoe.org).
Page 9 of 223
1. Social Inequality in European Societies
1.1 Some Indicators and trends
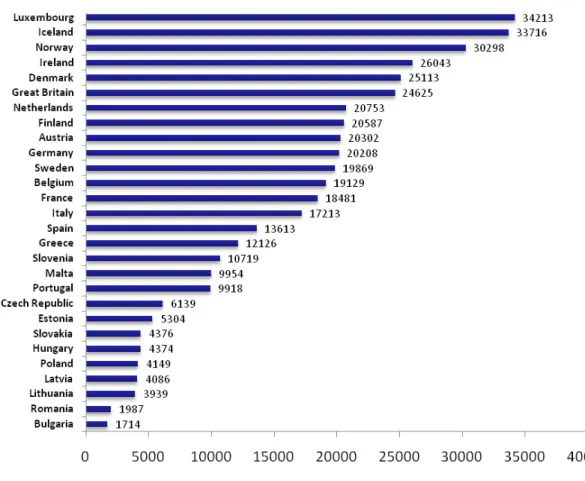
Research on inequalities between social categories, both at national and cross‐national level, covers a vast amount of scientific literature which we cannot set out to review in the context of this report. The objective of this first chapter is briefly to describe the nature of social inequality in European societies today, on the basis of some more commonly‐used indicators, and its evolution during the last decade. How unequal are European societies today? What types of social categories/groups/classes are researchers talking about? And what has been the main trend over the last few years – a move towards more or a move towards less inequality between social categories? 1.1.1 Income Inequality across and within European societies Measurement of inequalities across and within European societies relies systematically on comparative statistical data regarding levels of income. Drawing on existing datasets, we can highlight the following main trends: 1. There are significant differences in levels of income across Europe. Using data on Mean and equivalised disposable incomes (in EUR) (Figure 1) we can see that Luxembourg, Iceland, Ireland and Denmark and Great Britain have the highest levels of income within the EU27, but they are closely followed by a large group of countries (Netherlands, Finland, Austria, Germany, Sweden, Belgium, France, Italy). Eastern and Southern European countries have lower levels of income. The lowest levels in the EU27 are in Romania and Bulgaria.2. Income inequality within each country is also significant. Drawing on one main indicator of income inequality – the ratio of total income received by the 20% of the population with the highest income (top quintile) to that received by the 20% of the population with the lowest income (lowest quintile)1 – we find significant differences across countries in 2008 (Figure 2). However, it is not necessarily the countries with the highest GDP per capita that are the most equalitarian. Together with the Scandinavian countries, we find lower levels of income inequality in countries such as Slovenia, Slovakia, the Czech Republic, Hungary and Austria. Income inequality measured on the basis of the Gini coefficient reveals the same overall trends (Table 1)
3. Comparing income inequality in 2000 and 2008, on the basis of the same indicator, we find that there has been no change in terms of the average value for the EU27 (Figure 2). Across the different countries, the situation has developed differently. Income inequality has increased in many countries over this period: in Latvia, Romania, Bulgaria, Greece, Germany, France, Luxembourg, Belgium, Finland, Denmark, and Sweden. Although they are amongst the most
1
Page 10 of 223
unequal societies, Italy, Portugal, Estonia, Lithuania and Poland have reduced income inequalities over the last decade.
Figure 1 ‐ Mean and equivalised disposable incomes by country, 2007
Page 11 of 223 Figure 2 ‐ Income Inequality (S80/S20 income quintile share ratio) 2000 2008 3,4 3,7 3,9 3,3 3,5 4 3,8 3,6 3,9 4 3,9 4 4,3 4 5 4,8 3,8 5,9 5,6 6,6 5,4 5,8 5,8 6,9 6,9 3,7 4,9 6,7 0 2 4 6 8 Slovenia Czech R. Slovakia Sweden Denmark Hungary Austria Finland Malta Netherlands Luxembourg Belgium Cyprus France Ireland EU25* Germany Estonia Italy Poland Spain United Kingdom Greece Lithuania Portugal Bulgaria Romania Latvia 3,4 3,4 3,4 3,5 3,6 3,6 3,7 3,8 4 4 4,1 4,1 4,1 4,2 4,5 4,5 4,8 5 5,1 5,1 5,4 5,6 5,9 5,9 6,1 6,5 7 7,3 0 2 4 6 8 Slovenia Czech R. Slovakia Sweden Denmark Hungary Austria Finland Malta Netherlands Luxembourg Belgium Cyprus France Ireland EU25* Germany Estonia Italy Poland Spain United Kingdom Greece Lithuania Portugal Bulgaria Romania Latvia Source: Eurostat (2010). Table 1 ‐ Inequality of income distribution Gini coefficient Geog. Unit 2000 2008 Geog. Unit 2000 2008 EU27 ‐ 31 * Luxembourg 26 28 EU25 29 ** 30 * Netherlands 29 28 Slovenia 22 23 Germany 25 30 Slovakia ‐ 24 Ireland 30 30 Sweden ‐ 24 Estonia 36 31 Czech Republic ‐ 25 Spain 32 31 Denmark ‐ 25 Italy 29 31 Hungary 26 25 Poland 30 32 Norway ‐ 25 Greece 33 33 Austria 24 26 Lithuania 31 34 Finland 24 26 United Kingdom 32 34 Malta 30 27 Bulgaria 25 36 Iceland ‐ 27 Portugal 36 36 Belgium 30 28 Romania 29 36 France 28 28 Latvia 34 38 Cyprus ‐ 28 ‐ Source: Eurostat (2010) *Provisional Data; ** Estimate.
Page 12 of 223
1.1.2 Beyond income inequality: class structures in European societies
Comparative datasets using the concept of class and taking up socio‐professional and educational indicators to compare social categories across countries are more difficult to find and are not included systematically in the analysis of social inequality in late modern Europe. In some measure, this is probably due to the move away from ‘class analysis’ within sociology over the last two decades, largely based on the argument that in ‘reflexive modern’ societies the individual has become the author of his or her own biography (eg. Beck, 1992; Beck and Beck‐Gernsheim, 2002), instead of simply being able to follow the rules laid down by the established collectivities of class, status and gender. In other words, modernity is seen to have replaced the determination of social standing with compulsory and obligatory self‐determination (Baumann, 2002).
Many authors have nevertheless argued that ‘class’, although a multifaceted concept with a variety of different meanings, makes a significant contribution to understanding structured social inequality in contemporary societies and have even proposed new and improved approaches to the topic (Bottero, 2004, 2005; Devine et al., 2005; Savage et al, 2005; Crompton, 1998, 2006b). Common to all sociological conceptions of class is the argument that social inequalities are not ‘natural’ or divinely ordained, but rather emerge as a consequence of human behaviours in relation to both material resources and cultural distinctions (Crompton 2006b). The position taken up by contemporary research on class is that, although there has been considerable social change in European societies and individuals may have more choices to make than in the recent historical past, class and stratification analysis is important and useful for understanding and explaining the complex realities of inequality in late modern societies.
Renewed debates about the meaning and definition of class are thus contributing to some research on class structure and class reproduction in contemporary European societies, but mostly at a national level. The complex reality of social groupings across different countries, even on the basis of the simpler classificatory schemes based on occupational structure and groupings (an approach which may be regarded as an invaluable proxy for economic ‘classes’) has not emerged as an important area of research (probably due both to methodological problems as well the difficulties in encompassing the complex realities, material and cultural, of concrete classes in different societal contexts). Searching for some comparative data, even if only at the level of occupational schemes and educational groupings, we identified some research carried out on data collected for the European Social Survey.
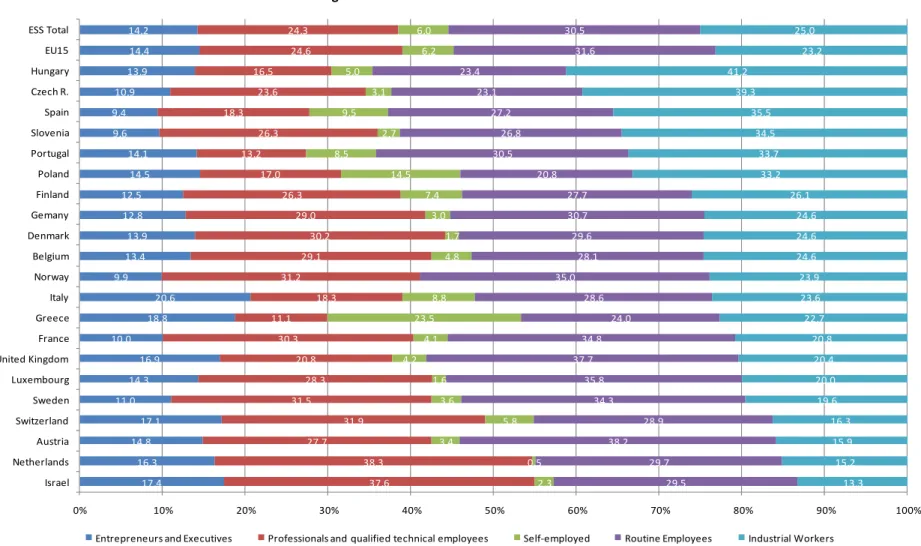
Ferreira de Almeida et al. (2006) applied the ACM2 social class typology (Almeida, Costa and Machado, 1988; Costa, 1999) to data from the 2002 European Social Survey. Five social categories were identified: entrepreneurs and executives (EE), professionals and qualified technical employees (PTE), self employed (SE), routine employees (RE) and industrial workers (IW).
2
The typology combines socio‐occupational and socio‐educational indicators, such as occupation, employment status and educational level at the individual level.
Page 13 of 223
Overall, in European Societies, Industrial Workers and Routine Employees are still the most numerous categories (Figure 3 and Table 2). The Routine Employees class category is the most numerous, both in the group of fifteen countries that made up the EU at the time of the first ESS (31.6 per cent) and in the total of 22 countries in which the survey was applied in 2002 (30.5 per cent). There are wide variations within Europe: ranging from 24 per cent of the total in Greece and 27.2 per cent in Spain to 37.7 per cent in the United Kingdom and 38.2 per cent in Austria.
However, professionals and qualified technical employees, those that have a high level of scientific, technical and cultural resources, are the majority (or close to 30%) in several countries: Denmark, France, Norway, Sweden, Belgium, Holland (as well as Switzerland and Israel). In countries such as Italy, Ireland, Portugal and Greece, the relative weight of the PTE is below 20 per cent or even close to 10 per cent, as in the case of Portugal and Greece. As far as the other countries are concerned, there are two different situations: Hungary and Poland also have values below 20 per cent and the Czech Republic and Slovenia are in between. The authors point out the relevance of the Professionals and Technical Employees group as a distinctive indicator of economic modernization and social development, mainly because its distribution across Europe reflects differing degrees of progress regarding the information and knowledge society (Ferreira de Almeida et al., 2006: 100).
Another characteristic of class structures in the European countries surveyed and the transnational space that they form is the fact that most of their population is distributed between two subordinate categories, the routine employees (RE) and industrial workers (IW)3: combined they represent 55.5% of the employed population. Industrial workers alone present average values of 23.2 per cent in the area of the European Union (EU‐15) and 25 per cent in the 21 countries of the ESS, although with considerable differences within Europe. The most contrasting countries are Holland (15.2 per cent) and Hungary (41.2 per cent). 3
The authors prefer to keep these two categories separated because, although they share similarities such as being in positions of subordination, implementation and routine, there are considerable differences in the specific content of the tasks performed, the relational contexts that surround them, the class identities of their members and the contrasting gender composition of each group.
Figure 3 ‐ Class Structures in ESS countries 17,4 16,3 14,8 17,1 11,0 14,3 16,9 10,0 18,8 20,6 9,9 13,4 13,9 12,8 12,5 14,5 14,1 9,6 9,4 10,9 13,9 14,4 14,2 37,6 38,3 27,7 31,9 31,5 28,3 20,8 30,3 11,1 18,3 31,2 29,1 30,2 29,0 26,3 17,0 13,2 26,3 18,3 23,6 16,5 24,6 24,3 2,3 0,5 3,4 5,8 3,6 1,6 4,2 4,1 23,5 8,8 4,8 1,7 3,0 7,4 14,5 8,5 2,7 9,5 3,1 5,0 6,2 6,0 29,5 29,7 38,2 28,9 34,3 35,8 37,7 34,8 24,0 28,6 35,0 28,1 29,6 30,7 27,7 20,8 30,5 26,8 27,2 23,1 23,4 31,6 30,5 13,3 15,2 15,9 16,3 19,6 20,0 20,4 20,8 22,7 23,6 23,9 24,6 24,6 24,6 26,1 33,2 33,7 34,5 35,5 39,3 41,2 23,2 25,0 0% 10% 20% 30% 40% 50% 60% 70% 80% 90% 100% Israel Netherlands Austria Switzerland Sweden Luxembourg United Kingdom France Greece Italy Norway Belgium Denmark Gemany Finland Poland Portugal Slovenia Spain Czech R. Hungary EU15 ESS Total
Entrepreneurs and Executives Professionals and qualified technical employees Self‐employed Routine Employees Industrial Workers Source: Almeida et al. (2006) based on ESS 2002. Data not available for Ireland
Table 2 ‐ Class Structures in ESS countries Entrepreneurs and Executives Professionals and
Managers Self‐employed Routine Employees Industrial Workers
Total Men Women Total Men Women Total Men Women Total Men Women Total Men Women
Austria 14.8 8.9 5.9 27.7 13.2 14.6 3.4 1.5 1.9 38.2 13.1 25.1 15.9 11.8 4.1 Belgium 13.4 8.8 4.6 29.1 15.4 13.7 4.8 2.8 2.1 28.1 10.1 17.8 24.6 18.3 6.4 Denmark 13.9 10.1 3.9 30.2 12.9 17.3 1.7 1.1 0.6 29.6 7.2 22.3 24.6 20.0 4.6 France 10.0 7.5 2.6 30.3 15.1 15.3 4.1 2.2 1.9 34.8 8.7 26.1 20.8 15.1 5.7 Finland 12.5 8.4 4.1 26.3 11.2 15.1 7.4 3.9 3.6 27.7 5.1 22.6 26.1 19.9 6.1 Germany 12.8 8.5 4.3 29.0 11.9 17.1 3.0 1.3 1.7 30.7 7.7 22.9 24.6 19.2 5.5 Greece 18.8 13.4 5.4 11.1 5.5 5.6 23.5 12.1 11.4 24.0 8.4 15.5 22.7 13.5 9.2 Italy 20.6 13.9 6.7 18.3 8.4 9.9 8.8 4.5 4.4 28.6 9.8 18.9 23.6 15.3 8.3 Luxembourg 14.3 9.1 5.1 28.3 12.5 15.7 1.6 0.7 0.9 35.8 10.1 25.7 20.0 17.6 2.4 Netherlands 16.3 11.6 4.7 38.3 14.8 23.5 0.5 0.1 0.4 29.7 8.1 21.6 15.2 12.4 2.8 Portugal 14.1 9.9 4.2 13.2 5.5 7.6 8.5 3.5 5.1 30.5 8.1 22.4 33.7 20.8 12.9 Spain 9.4 6.2 3.2 18.3 9.9 8.4 9.5 5.4 4.1 27.2 7.2 20.0 35.5 25.8 9.7 Sweden 11.0 8.0 3.0 31.5 15.1 16.4 3.6 2.5 1.1 34.3 8.6 25.6 19.6 16.6 3.0 United Kingdom 16.9 12.4 4.6 20.8 9.2 11.6 4.2 3.3 0.9 37.7 9.9 27.8 20.4 14.3 6.1 EU15 14.4 9.8 4.5 24.6 11.2 13.4 6.2 3.4 2.8 31.6 8.7 22.9 23.2 17.0 6.2 Czech R. 10.9 7.3 3.6 23.6 9.5 14.1 3.1 2.7 0.4 23.1 6.8 16.4 39.3 24.3 14.9 Hungary 13.9 8.2 5.7 16.5 5.8 10.7 5.0 3.3 1.7 23.4 5.1 18.3 41.2 26.5 14.7 Israel 17.4 12.5 4.8 37.6 13.4 24.2 2.3 1.5 0.8 29.5 9.4 20.1 13.3 10.7 2.6 Norway 9.9 7.1 2.8 31.2 15.2 16.1 35.0 9.6 25.4 23.9 21.3 2.5 Poland 14.5 9.2 5.3 17.0 5.1 11.8 14.5 7.2 7.3 20.8 5.3 15.5 33.2 23.5 9.7 Slovenia 9.6 6.1 3.5 26.3 10.9 15.4 2.7 1.9 0.8 26.8 8.8 17.9 34.5 21.5 13.0 Switzerland 17.1 11.0 6.1 31.9 15.8 16.1 5.8 3.2 2.6 28.9 7.3 21.6 16.3 12.7 3.7 ESS Total 14.2 9.7 4.4 24.3 10.7 13.6 6.0 3.3 2.7 30.5 8.3 22.3 25.0 17.9 7.0 Source: ESS 2002 Data not available for Ireland
Page 16 of 223
Seen from a gender perspective, in most countries the professionals and technical employees category consists, for the most part, of women (the female majority is more evident in Poland, Israel, Hungary, Holland and Germany) (Table 2). By contrast, in the other category at the top of the class structure, the EE, there are always more men, a difference which is more significant in France, the United Kingdom, Sweden, Denmark, Norway and Israel, with male representation being over 2.5 times higher than that of females. Usually men are also the majority among the self‐employed.
In Southern and Eastern Europe class structures still reflect past industrial models. Countries such as Hungary, the Czech Republic, Slovenia, Poland, Spain and Portugal have more industrial workers than routine employees and contrast strongly with the countries with earlier tertiarization, in particular Austria, the United Kingdom, France and Norway, where there are more routine employees. Portugal, Spain, Hungary, the Czech Republic and Slovenia are the countries where we find more people in subordinate positions (industrial workers and routine employees). The lowest values are to be found in Holland, Switzerland, Israel and values slightly above 50 per cent are to be found in Belgium, Finland and Sweden.
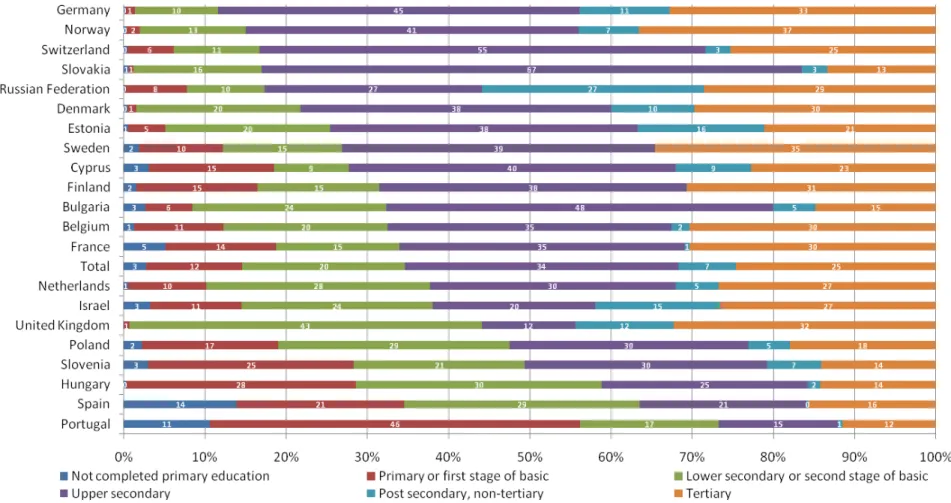
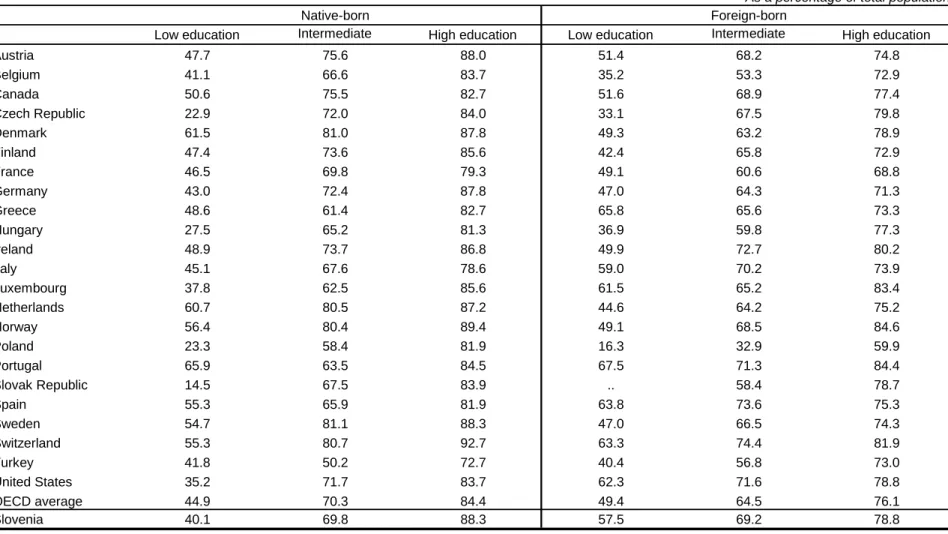
These differences are of course strongly related to educational levels. Using data from the European Social Survey 2008, we can see that educational levels differ considerably across Europe. In some Southern and Eastern Europe countries, educational levels are low in overall terms: Portugal, Spain, Hungary, Slovenia, and Poland have a significant proportion of the population that was only able to complete primary education or even less. The vast majority of citizens from Central and Northern Europe have reached or surpassed the upper secondary level of education. In countries such as Denmark, France, Belgium, Finland, United Kingdom, Germany, Sweden, and Norway 30% or more have completed tertiary levels of education, meaning that they obtained some sort of degree.
Figure 4 ‐ Highest Level of Education in ESS countries
1.2 Inequality and Well‐being: Research using Objective and Subjective
Indicators
1.2.1 The case for Subjective Indicators
Traditionally research and policy makers have preferred economic and social indicators of well‐being, deemed more appropriate to measure the development of societies. Measures of life satisfaction, happiness and generally subjective indicators of well being have not been widely used in the analysis of human welfare, due to opposition from both researchers (economists, sociologists, etc.) and policy makers, on the basis of subjectivity. For example, Eckersley (2009) suggests that different results may be a product of more individualistic or collectivist societies. Fahey and Smyth (2004) point out that this kind of scepticism is due to the fact that indicators of subjective well being have been regarded has independent of social reality because in countries where time‐series are available, results have not changed over time. Scepticism is also justified because individual life satisfaction is thought to be weakly related to objective conditions (relating life satisfaction with personality traits).
So far, research on subjective well being has been mostly concentrated in highly developed countries; comparisons have been based on levels of satisfaction rather than their distribution across the population and have focused on countries with small variance in subjective well‐being, thus diminishing possible effects of socio‐economic factors. More recently, a strong case has been made for the use of subjective indicators combined with economic variables. Synthetic indicators have been proposed (Somarriba et al., 2009), combining various objective dimensions such as income, living conditions and employment with subjective indicators like perception of quality of life. A relationship between income inequality and subjective and objective welfare indicators is defended by Wilkinson and Pickett (2009). In their work, extensive proof of the relation between (in) equality and welfare is presented and, according to the authors, the association between inequality and social problems cannot be explained by cultural differences or population size alone.
According to Wilkinson and Pickett, overall, unequal societies tend to perform worse on objective indicators, such as life expectancy, health, crime rates and subjective indicators, such as trust in fellow citizens or life satisfaction. Wilkinson and Pickett also point out that, in the more developed countries, measures of well‐being are no longer associated with economic performance, suggesting that the quest for increasing material wealth needs to be replaced with increased social cohesion, improved social environment and quality of life. Regarding the controversial issue of economic growth vs. equality, the authors advocate strongly for equality, claiming that the body of empirical research presents no determinant relation between the two variables.
1.2.2 Subjective Indicators of Well Being
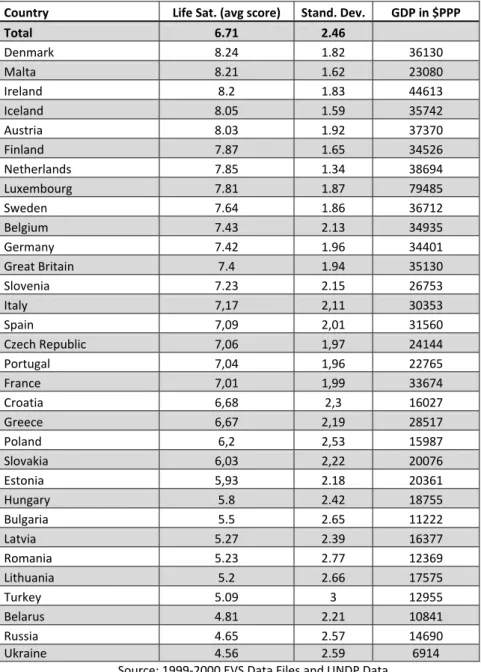
Using data for the European Values Study from 1999‐2000 that addressed data for 32 European societies on the cognitive assessment of one’s situation and combining it with average income (using parity GDP), we observe that life satisfaction seems to be related to overall societal economic performance as in more affluent societies life satisfaction is higher.
Table 3 ‐ Life Satisfaction in 32 European Societies
Country Life Sat. (avg score) Stand. Dev. GDP in $PPP
Total 6.71 2.46 Denmark 8.24 1.82 36130 Malta 8.21 1.62 23080 Ireland 8.2 1.83 44613 Iceland 8.05 1.59 35742 Austria 8.03 1.92 37370 Finland 7.87 1.65 34526 Netherlands 7.85 1.34 38694 Luxembourg 7.81 1.87 79485 Sweden 7.64 1.86 36712 Belgium 7.43 2.13 34935 Germany 7.42 1.96 34401 Great Britain 7.4 1.94 35130 Slovenia 7.23 2.15 26753 Italy 7,17 2,11 30353 Spain 7,09 2,01 31560 Czech Republic 7,06 1,97 24144 Portugal 7,04 1,96 22765 France 7,01 1,99 33674 Croatia 6,68 2,3 16027 Greece 6,67 2,19 28517 Poland 6,2 2,53 15987 Slovakia 6,03 2,22 20076 Estonia 5,93 2.18 20361 Hungary 5.8 2.42 18755 Bulgaria 5.5 2.65 11222 Latvia 5.27 2.39 16377 Romania 5.23 2.77 12369 Lithuania 5.2 2.66 17575 Turkey 5.09 3 12955 Belarus 4.81 2.21 10841 Russia 4.65 2.57 14690 Ukraine 4.56 2.59 6914 Source: 1999‐2000 EVS Data Files and UNDP Data
Denmark, Malta, Ireland, Iceland and Austria are the top 5 countries in terms of life satisfaction (with an average score of 8 or more in a 10 point scale). Most countries of central and northern Europe have above average life satisfaction scores (Finland, Netherlands, Luxembourg, Sweden, Belgium, Germany, Great Britain, Slovenia, Czech R., France) but also more southern countries such as Slovenia, Italy, Spain and
Portugal. Croatia and Greece scores are average, when compared with the overall results. The bulk of countries with low life satisfaction scores are ex‐socialistic societies (Turkey is the only exception). In Belarus, Ukraine and Russia, countries outside the EU, citizens are most unsatisfied with their life, and the average results are lower than 5. Combining life satisfaction with income, we can observe that there are countries such as Malta, Denmark or Iceland that appear to have higher satisfaction than expected, suggesting some disjunction between level of satisfaction and economic conditions. Figure 5 ‐ Life Satisfaction and GDP in 32 European Societies Source: 1999‐2000 EVS Data Files and UNDP Data But overall, we can see that there is a consistent relationship between life satisfaction and GDP, i.e. more affluent societies tend to have more highly satisfied citizens. Fahey and Smyth (2004), using the same dataset and additional economic statistics also found a link between life satisfaction and recent growth rates, although that relationship may need to be re‐evaluated in light of the recent global economic crisis. Standard deviation in life satisfaction varies inversely with the mean of life‐satisfaction, meaning that in societies where, on average, citizens are more satisfied with their life, there is a stronger consensus in favour of that view.
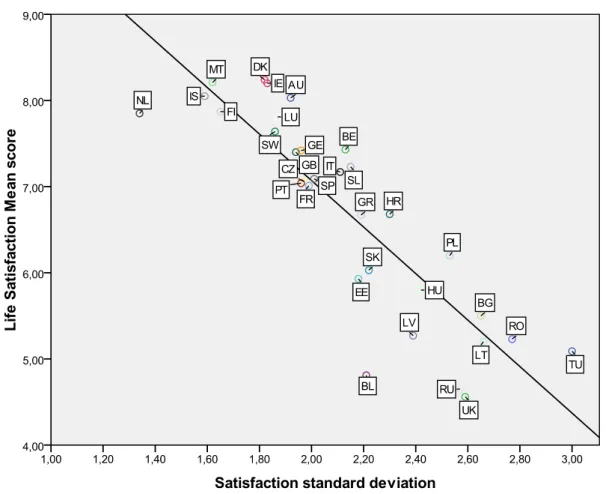
Figure 6 ‐ Mean life satisfaction and standard deviation in 32 European societies
Source: 1999‐2000 EVS Data Files
Countries with lower life‐satisfaction levels have higher variation. One possible explanation for this could be that in those societies there is greater inequality in income and living standards.
Despite the fact that some of the richer societies in the EU are rather unequal, the level of comfort and material well‐being achieved seems to mitigate the effect of social inequality. In poorer societies, such as those in the East or Southern Europe, there seems to be a stronger link between social inequality and life satisfaction, suggesting the existence of a “lock‐step” of societal well being, in other words, once a certain plateau is achieved this limits the effect of social inequality (i.e. low incomes and related disadvantages may have a greater impact in poorer countries than in rich countries, in terms of subjective well‐being). The effect of economic welfare flattens above the 16 EU poorer countries (in terms of GDP).
Using the same data from the EVS, Fahey and Smyth (2004) used a multi‐level regression procedure to weigh individual patterns and country effects. The authors found that roughly 22% of variation in life satisfaction derives from country while 78% is individual level variation. In the analysis, employment and marital status are two of the most relevant variables (married – or in a relationship ‐ and employed individuals have higher levels of life satisfaction).
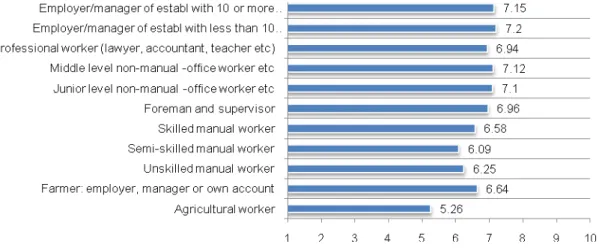
Income and social class are also important: the highest levels of life‐satisfaction are found among employers and qualified professionals, lower levels amongst the less skilled and agricultural workers. Figure 7 ‐ Mean life satisfaction and professional status Source: 1999‐2000 EVS Data Files
Variables such as sex or age have less or no impact at all. The explanation for the persistence of high life‐satisfaction scores in some societies may result from a relation between subjective well‐being and a combination of each country’s relative position regarding the possibility of social mobility within a society, rather than solely a result of the absolute level of economic well‐being.
2. Policies, families and integration: state of the art of migration
research in Europe
Migration is currently an area of vast scientific research, public debate and policy intervention in Europe. This is the case when the object under analysis is international migration and, more specifically, immigration, i.e., international movements of people targeting European societies – the object of the present report. The reasons for the centrality of this theme are numerous. On the one hand, migratory movements, which were always part of the European history, became increasingly visible in most European countries. Taken in the sense of international migration, they were never as large as they are today. On the other hand, they defy some of the entrenched principles in which cultures and identity lie. The settlement of populations with different national backgrounds, cultures, religions and values defy the notion of ethnic homogeneity in which the European identities are (mistakenly) based. The themes of international migration and social change do not come across very often in social research. However, it may be argued that international flows are nowadays one of the biggest sources of social change in Europe.
The literature produced on the theme is countless. In the early stages of immigration in Europe, most of the studies were produced in Western countries, usually adopting a national perspective. With the enlargement of the migration realm, Northern, Southern and Central European countries became involved each of them also producing an abundant national research. In time, an increasing volume of cross‐ country research was produced, very much as a consequence of European Union (EU) funding opportunities and academic networking. All in all, a vast amount of research has been produced on these topics, displaying a wide geographic and thematic variety. Although the better known studies come from the largest countries in Europe, being written in the dominant scientific languages (mostly English), many others were produced in the framework of other countries and languages.
Taking these considerations into account, the current state of the art must be considered as a general and incomplete overview of research on immigration in Europe. Given the scope and maturity of migration studies, the long period in which relevant flows took place, the many countries and scientific communities involved, and the many interrelated themes, it is virtually impossible to carry out an extensive and complete evaluation of the research carried out in the field. For the purpose of the current report, this exercise was even more difficult, given the short amount of time allocated to the task – even knowing that only research produced from the 1990s was to be taken into account4. 4 The difficulty of drafting a state of the art on migration issues is widely admitted. For example, Penninx and colleagues (2008: 7) argue that “research related to international migration, integration and social cohesion has grown to such an extent that it is impossible to review the literature according to conventional approaches of a State of the Art Study. The field of migration has grown itself as the diversity of migration, its forms, mechanisms and motivations have changed (…). The field of integration has likewise expanded, coming to include, along with the traditional domains of work, education, housing and health and political, social and cultural/religious dimensions, new topics such as language,
The methodology adopted for producing this chapter took into account the vast extension of the field and the resources available. First, some major general studies on migration in Europe, including previous states of the art, were reviewed. This was the case of works such as Castles and Miller (2003 and 2009), Penninx, Berger and Kraal (2006), Spencer and Cooper (2007), Penninx, Spencer and Van Hear (2008), Portes and DeWind (2008), Bonifazi et al. (2008) and Okolski (forthcoming). The work of Penninx and colleagues (2006) was particularly relevant for this purpose, as it condensed the collective effort of several European researchers, gathered in IMISCOE (International Migration, Integration and Social Cohesion), an European Network of Excellence in migration studies created in the framework of the European Commission (EC) research funding; its objective was to present a detailed state of the art of European research in several migration domains5. Secondly, some relevant databases and websites were consulted. This was the case of the EC research site6, where cross‐national European research projects are presented; the IMISCOE website7, condensing the more recent production in this framework; international organisations’ websites, such as the International Organisation for Migration (IOM); and some relevant journals and publishers websites. Finally, some bibliographic databases were checked, but mainly to fill in gaps resulting from the previous steps.
The objective of this chapter is to set out the main research lines, theoretical discussions and controversial issues relating to immigration in the European framework and, particularly, in the EU since the 1990s. As stated previously, it only deals with international migration and, particularly, immigration, taking into consideration both inflows and integration – two subjects sometimes separated in research. The first section presents the framework, i.e. a brief history of immigration in Europe and some relevant statistical data. The second section summarizes the findings of research, structured around three main themes: a thorough examination will be made of research on policy issues (admission, control, integration and citizenship); family‐related issues (demography, family migration, gender and age related migration); and integration patterns (work, space, identity and second generations). The first of these latter topics has a dual objective, presenting simultaneously the main research available and associated public policies on immigration. In the final section, a brief synthesis is made and some research gaps will be tentatively identified. Compared to other states of the art in the field, this one differs in some respects: in policymaking in the field, interethnic relations, discrimination, age, gender and generation. Furthermore, with the inclusion of new analytical perspectives, such as the focus on transnational ties and connections of migrants and the perspective of sending countries, the domain of study has significantly enlarged”.
5 Some of the original full versions of these states of the art were also consulted (see http://www.imiscoe.org). The themes dealt with by this work were: international migration flows and their regulation; migration and development: causes and consequences; migrants’ citizenship: legal status, rights and political participation; migrants’ work, entrepreneurship and economic integration; the social integration of immigrants with special reference to the local and spatial dimension; cultural, religious and linguistic diversity in Europe: an overview of issues and trends; identity, representation, interethnic relations and discrimination; time, generations and gender in migration and settlement; the multilevel governance of migration.
6
http://ec.europa.eu/research/social‐sciences. 7 http://www.imiscoe.org.
particular, it focuses more closely on family and social inequality related issues, given the scope and objectives of the project from which it derives.
2.1 Framework: a brief history of immigration in Europe
The history of European immigration is not as recent as sometimes portrayed. In countries such as France, a considerable amount of inflows existed already in the first half of the 20th century. But in all developed Western countries, large inflows occurred mainly after the Second World War, in the framework of a solid economic expansion that lasted for circa 30 years – the so‐called “30 glorious years”. As well documented by several sources, most of the immigrants were then supposed to be temporary guests, but many remained. From the 1970s onwards several changes occurred, including the enactment of restrictive policies, the changing geography of flows and new migration patterns. From the 1980s, Southern Europe and Ireland gradually became important targets of immigration, together with some Scandinavian countries. More recently, after the end of the Cold War, Central and Eastern European countries also became objects of concern, given the importance of transit and, later, durable forms of immigration (Bonifazi et al., 2008; Okolski, forthcoming). During these decades, outflows also took place from most European countries – although always less researched. Many of these were intra‐EU flows. At the same time, a clear policy‐ driven difference started to emerge between intra‐EU flows and others involving third countries. The contradiction between (quasi) free circulation – successively updated with the new EU enlargements – and restrictions towards third‐country nationals became increasingly evident.
The years of solid economic expansion in Europe, lasting until the mid‐1970s, were largely based on manufacturing industries and a relatively stable international environment. During this period, most of the inflows targeted the North‐western countries and the search for a permanent job. When the national and international context changed, new migration patterns emerged. Globalisation brought with it new kinds of flows, including more irregural immigration, asylum seekers and refugees, and accrued social concerns. This was also the time of the new service and information economy, increasing deregulation of the labour market and global economic competition. The growing politicization of immigration that then took place, deriving from a new public attitude towards inflows, was just a prelude to the more recent securitization debate.
The measure of international migration is complex. As described by several sources – including, for example, an extensive work carried out by Poulain and others (2006), resulting from an EC funded project –, the methodology and concepts used in this field largely differ among European countries. Recently, the EC has launched an initiative to carry out a harmonization of migration statistics in the EU, a long‐needed measure 8.
8 Regulation (EC) No 862/2007 of the European Parliament and of the Council of 11 July 2007 on Community statistics on migration and international protection. This regulation has produced its first results in 2009, with data referring to 2008, although the first year was admitted to be still experimental.
However, its outcome is not yet complete. Despite the efforts of institutions such as the OECD, in the framework of its annual International Migration Outlook, comparative exercises are always weak. This means that a comparative analysis has mostly to be carried out using general definitions and a macro vision. When entering the detail of variables and geography, the methodological difficulties in making comparisons become evident.
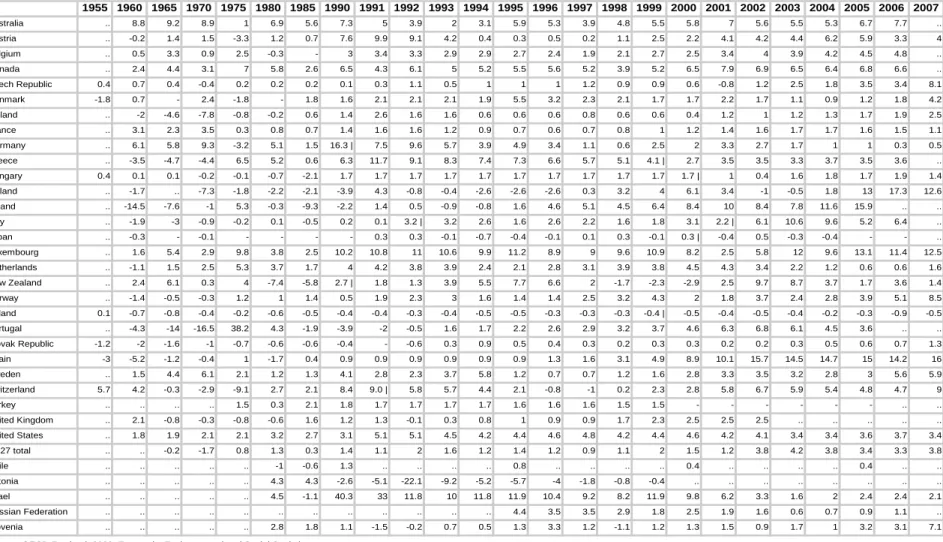
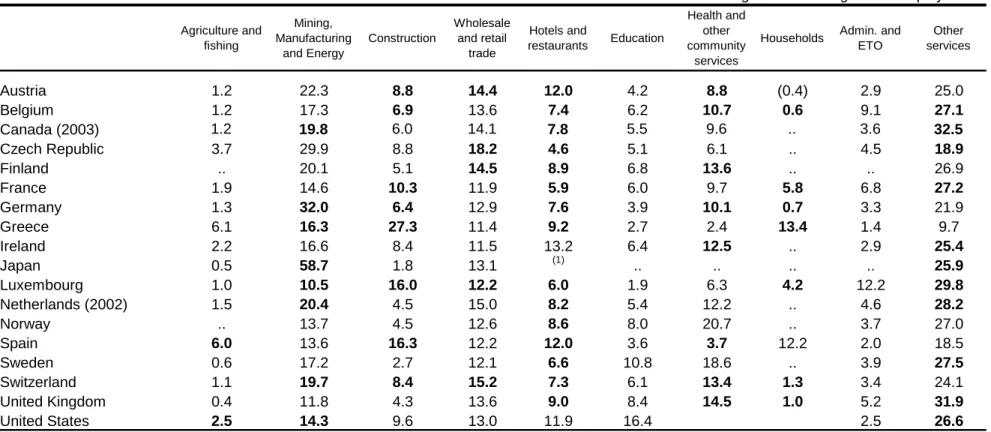
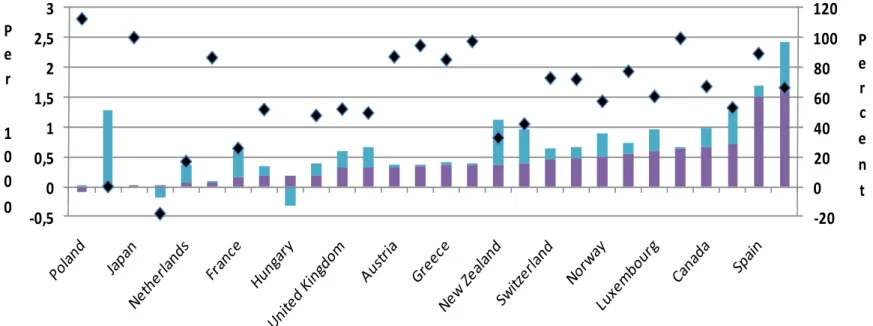
Despite the methodological problems, recent statistical data confirm the importance and widespread character of immigration in Europe. Data on annual net migration rates in OECD countries, from 1955 to 2007, are displayed in Table 4, as well as data on the contribution of net migration to population growth in 2006, displayed in Figure 5. The persistence and widespread character of immigration is clear. The observation of net migration growth in Europe since the 1950s confirms several facts: the durability of inflows to the North‐western countries to the present day; the turnaround from emigration to immigration in several countries, such as in Southern Europe; and the gradual advent of new immigration destinations. Furthermore, comparison between net migration and natural increase is a revealing indicator of how immigration is driving demographic growth. In a context of overall demographic decline in Europe, with a generalized pattern of low fertility, it is mainly migration that is enabling positive growth and the smoothing out of the structural impact of ageing.
Data on the proportion of foreign‐born and foreign population in the OECD countries, between 1995 and 2006, are displayed in Table 5 and Figure 9. These two criteria – country of birth and country of citizenship – are those most commonly used to capture the volume of immigration. Although the former is more rigorous, since it measures all individuals (nationals and foreigners) that actually migrated between countries, the second is the most easily available, since it includes all foreign individuals (immigrants and non‐immigrants, including the so‐called second generation) living in a country. Both data series confirm that the human landscape, in migration terms of European countries, particularly the EU, , is not fundamentally very different from the “traditional immigration countries” of America and Oceania.
Taking, for instance, the foreign‐born population, some European countries, such as Luxembourg, Switzerland, Ireland and Austria had in 2006 a larger share of immigrants than the United States, a country in which immigration is part and parcel of national identity. Taking the criteria of foreign population, the same European countries are joined by Spain, Belgium and Germany as having a higher share than the United States. When observing the rate of growth during recent years (1995 to 2006), it can be seen that both the share of foreign‐born and foreigners are on the rise in most European countries. The speed of growth has been higher in some of the recent European hosts, such as the countries of Southern Europe and Ireland, where the number of immigrants (or foreigners) sometimes doubled or tripled in just ten years. Spain is the most impressive example, having passed from a proportion of 1.6 per cent of foreigners in the whole population, in 1997, to a huge 10.3 per cent, in 2006.
The legal channels which prospective immigrants use are diverse (Figure 10). In 2006, family‐related migration, including family reunification and marriage migration (entries of fiancés or recently married spouses of citizens or legal foreign residents) accounted
for the majority of inflows, approaching 44 per cent of the total. This was followed by individuals entering in the framework of free movement provisions, particularly in the case of the EU, labour migration and humanitarian grounds (including refugees).
Table 4 ‐ Net migration rate 1955 1960 1965 1970 1975 1980 1985 1990 1991 1992 1993 1994 1995 1996 1997 1998 1999 2000 2001 2002 2003 2004 2005 2006 2007 Australia .. 8.8 9.2 8.9 1 6.9 5.6 7.3 5 3.9 2 3.1 5.9 5.3 3.9 4.8 5.5 5.8 7 5.6 5.5 5.3 6.7 7.7 .. Austria .. -0.2 1.4 1.5 -3.3 1.2 0.7 7.6 9.9 9.1 4.2 0.4 0.3 0.5 0.2 1.1 2.5 2.2 4.1 4.2 4.4 6.2 5.9 3.3 4 Belgium .. 0.5 3.3 0.9 2.5 -0.3 - 3 3.4 3.3 2.9 2.9 2.7 2.4 1.9 2.1 2.7 2.5 3.4 4 3.9 4.2 4.5 4.8 .. Canada .. 2.4 4.4 3.1 7 5.8 2.6 6.5 4.3 6.1 5 5.2 5.5 5.6 5.2 3.9 5.2 6.5 7.9 6.9 6.5 6.4 6.8 6.6 .. Czech Republic 0.4 0.7 0.4 -0.4 0.2 0.2 0.2 0.1 0.3 1.1 0.5 1 1 1 1.2 0.9 0.9 0.6 -0.8 1.2 2.5 1.8 3.5 3.4 8.1 Denmark -1.8 0.7 - 2.4 -1.8 - 1.8 1.6 2.1 2.1 2.1 1.9 5.5 3.2 2.3 2.1 1.7 1.7 2.2 1.7 1.1 0.9 1.2 1.8 4.2 Finland .. -2 -4.6 -7.8 -0.8 -0.2 0.6 1.4 2.6 1.6 1.6 0.6 0.6 0.6 0.8 0.6 0.6 0.4 1.2 1 1.2 1.3 1.7 1.9 2.5 France .. 3.1 2.3 3.5 0.3 0.8 0.7 1.4 1.6 1.6 1.2 0.9 0.7 0.6 0.7 0.8 1 1.2 1.4 1.6 1.7 1.7 1.6 1.5 1.1 Germany .. 6.1 5.8 9.3 -3.2 5.1 1.5 16.3 | 7.5 9.6 5.7 3.9 4.9 3.4 1.1 0.6 2.5 2 3.3 2.7 1.7 1 1 0.3 0.5 Greece .. -3.5 -4.7 -4.4 6.5 5.2 0.6 6.3 11.7 9.1 8.3 7.4 7.3 6.6 5.7 5.1 4.1 | 2.7 3.5 3.5 3.3 3.7 3.5 3.6 .. Hungary 0.4 0.1 0.1 -0.2 -0.1 -0.7 -2.1 1.7 1.7 1.7 1.7 1.7 1.7 1.7 1.7 1.7 1.7 1.7 | 1 0.4 1.6 1.8 1.7 1.9 1.4 Iceland .. -1.7 .. -7.3 -1.8 -2.2 -2.1 -3.9 4.3 -0.8 -0.4 -2.6 -2.6 -2.6 0.3 3.2 4 6.1 3.4 -1 -0.5 1.8 13 17.3 12.6 Ireland .. -14.5 -7.6 -1 5.3 -0.3 -9.3 -2.2 1.4 0.5 -0.9 -0.8 1.6 4.6 5.1 4.5 6.4 8.4 10 8.4 7.8 11.6 15.9 .. .. Italy .. -1.9 -3 -0.9 -0.2 0.1 -0.5 0.2 0.1 3.2 | 3.2 2.6 1.6 2.6 2.2 1.6 1.8 3.1 2.2 | 6.1 10.6 9.6 5.2 6.4 .. Japan .. -0.3 - -0.1 - - - - 0.3 0.3 -0.1 -0.7 -0.4 -0.1 0.1 0.3 -0.1 0.3 | -0.4 0.5 -0.3 -0.4 - - .. Luxembourg .. 1.6 5.4 2.9 9.8 3.8 2.5 10.2 10.8 11 10.6 9.9 11.2 8.9 9 9.6 10.9 8.2 2.5 5.8 12 9.6 13.1 11.4 12.5 Netherlands .. -1.1 1.5 2.5 5.3 3.7 1.7 4 4.2 3.8 3.9 2.4 2.1 2.8 3.1 3.9 3.8 4.5 4.3 3.4 2.2 1.2 0.6 0.6 1.6 New Zealand .. 2.4 6.1 0.3 4 -7.4 -5.8 2.7 | 1.8 1.3 3.9 5.5 7.7 6.6 2 -1.7 -2.3 -2.9 2.5 9.7 8.7 3.7 1.7 3.6 1.4 Norway .. -1.4 -0.5 -0.3 1.2 1 1.4 0.5 1.9 2.3 3 1.6 1.4 1.4 2.5 3.2 4.3 2 1.8 3.7 2.4 2.8 3.9 5.1 8.5 Poland 0.1 -0.7 -0.8 -0.4 -0.2 -0.6 -0.5 -0.4 -0.4 -0.3 -0.4 -0.5 -0.5 -0.3 -0.3 -0.3 -0.4 | -0.5 -0.4 -0.5 -0.4 -0.2 -0.3 -0.9 -0.5 Portugal .. -4.3 -14 -16.5 38.2 4.3 -1.9 -3.9 -2 -0.5 1.6 1.7 2.2 2.6 2.9 3.2 3.7 4.6 6.3 6.8 6.1 4.5 3.6 .. .. Slovak Republic -1.2 -2 -1.6 -1 -0.7 -0.6 -0.6 -0.4 - -0.6 0.3 0.9 0.5 0.4 0.3 0.2 0.3 0.3 0.2 0.2 0.3 0.5 0.6 0.7 1.3 Spain -3 -5.2 -1.2 -0.4 1 -1.7 0.4 0.9 0.9 0.9 0.9 0.9 0.9 1.3 1.6 3.1 4.9 8.9 10.1 15.7 14.5 14.7 15 14.2 16 Sweden .. 1.5 4.4 6.1 2.1 1.2 1.3 4.1 2.8 2.3 3.7 5.8 1.2 0.7 0.7 1.2 1.6 2.8 3.3 3.5 3.2 2.8 3 5.6 5.9 Switzerland 5.7 4.2 -0.3 -2.9 -9.1 2.7 2.1 8.4 9.0 | 5.8 5.7 4.4 2.1 -0.8 -1 0.2 2.3 2.8 5.8 6.7 5.9 5.4 4.8 4.7 9 Turkey .. .. .. .. 1.5 0.3 2.1 1.8 1.7 1.7 1.7 1.7 1.6 1.6 1.6 1.5 1.5 - - - .. .. United Kingdom .. 2.1 -0.8 -0.3 -0.8 -0.6 1.6 1.2 1.3 -0.1 0.3 0.8 1 0.9 0.9 1.7 2.3 2.5 2.5 2.5 .. .. .. .. .. United States .. 1.8 1.9 2.1 2.1 3.2 2.7 3.1 5.1 5.1 4.5 4.2 4.4 4.6 4.8 4.2 4.4 4.6 4.2 4.1 3.4 3.4 3.6 3.7 3.4 EU27 total .. .. -0.2 -1.7 0.8 1.3 0.3 1.4 1.1 2 1.6 1.2 1.4 1.2 0.9 1.1 2 1.5 1.2 3.8 4.2 3.8 3.4 3.3 3.8 Chile .. .. .. .. .. -1 -0.6 1.3 .. .. .. .. 0.8 .. .. .. .. 0.4 .. .. .. .. 0.4 .. .. Estonia .. .. .. .. .. 4.3 4.3 -2.6 -5.1 -22.1 -9.2 -5.2 -5.7 -4 -1.8 -0.8 -0.4 .. .. .. .. .. .. .. .. Israel .. .. .. .. .. 4.5 -1.1 40.3 33 11.8 10 11.8 11.9 10.4 9.2 8.2 11.9 9.8 6.2 3.3 1.6 2 2.4 2.4 2.1 Russian Federation .. .. .. .. .. .. .. .. .. .. .. .. 4.4 3.5 3.5 2.9 1.8 2.5 1.9 1.6 0.6 0.7 0.9 1.1 .. Slovenia .. .. .. .. .. 2.8 1.8 1.1 -1.5 -0.2 0.7 0.5 1.3 3.3 1.2 -1.1 1.2 1.3 1.5 0.9 1.7 1 3.2 3.1 7.1 Per 1000 inhabitants