Es
te é um ar
go public
ado em acesso abert
o (Open Access) sob a licenç
a Cr
ea
v
e Commons A
ribu
on, que permit
e
uso
, dis
tribuiç
ão e r
epr
oduç
ão em qualquer meio
, sem r
es
triç
ões desde que o tr
abalho original seja c
orr et amen te cit ado.
A evolução do Índice de Desenvolvimento da Família (IDF) da cidade de Viçosa
entre os anos de 1980 e 2010
Indice de Développement de la Famille (IDF) dans la municipalité de Viçosa,
evolu
Ɵ
on entre 1980 et 2010
Índice de Desarrollo Familiar (IDF) en el municipio de Viçosa, evolución entre
1980 y 2010
Bruno Silva Olher1
Maria de Lourdes MaƩ os Barreto2
Gustavo Bastos Braga2
Maria das Dores Saraiva de Loreto2
Recebido em 23/10/2017; revisado e aprovado em 20/12/2017; aceito em 27/12/2017 DOI: h p://dx.doi.org/10.20435/inter.v19i3.1739
Abstract: This study analyzed the situa on of families in the city of Viçosa in 1980, 1991, 2000 and 2010 from a mul -dimensional perspec ve based on methodology adapted from that of Barros, Carvalho and Franco (2003), which was based on micro-data from the demographic census. Through the enormous amount of informa on contained in the database, it was possible to undertake a broad analysis enabling the household’s living condi ons to be evaluated.
Keywords: Family Development Index; well-being; Viçosa.
Resumo: Este estudo analisou a situação das famílias na cidade de Viçosa em 1980, 1991, 2000 e 2010, a par r de uma perspec va mul dimensional baseada em metodologia adaptada da de Barros, Carvalho e Franco (2003), baseada em microdados de o recenseamento demográfi co. Através da enorme quan dade
de informações con das na base de dados, foi possível realizar uma ampla análise que permi sse avaliar as condições de vida do lar.
Palavras-chave: Índice de Desenvolvimento da Família; bem-estar; Viçosa.
Résumé:Ce e étude a analysé la situa on des familles dans la ville de Viçosa en 1980, 1991, 2000 et 2010 dans une perspec ve mul dimensionnelle basée sur une méthodologie adaptée de celle de Barros, Carvalho et Franco (2003), basée sur des micro-données de le recensement démographique. Grâce à l’énorme quan té d’informa ons contenues dans la base de données, il a été possible d’entreprendre une vaste analyse perme ant d’évaluer les condi ons de vie du ménage.
Mots clés: Indice de développement de la famille; bien-être; Viçosa.
Resumen: Este estudio analizó la situación de las familias en la ciudad de Viçosa en 1980, 1991, 2000 y 2010 desde una perspec va mul dimensional basada en una metodología adaptada de la de Barros, Carvalho y Franco (2003), que se basó en microdatos de el censo demográfi co. A través de la enorme can dad de
información contenida en la base de datos, fue posible realizar un análisis amplio que permite evaluar las condiciones de vida del hogar.
Palabras clave: Índice de Desarrollo Familiar; bienestar; Viçosa.
1 Ins tuto Federal de Educação, Ciência e Tecnologia do Sudeste de Minas Gerais, campus Rio Pomba, Minas Gerais, Brasil.
1 INTRODUCTION
Social disparity is a problem affl ic ng most municipali es, especially ci es in underdeve-loped or developing countries, marked by economic problems, defi ciencies in health provision,
educa on, housing precariousness, among other social ills.
In Brazil, income inequality coupled with poverty is part of the country’s history, aggravated by numerous economic crises, policies, failures in government ac ons, and economic develo-pment centered on the more fortunate classes. These problems are further aggravated at the municipal level, as the dependence of the popula on on specifi c ac ons of the authori es is
much greater when compared to the State and Federal spheres.
1.1 Concept of Poverty
Poverty and social inequality follows the historic line of the development of humanity. According to Schwartzman (2007), un l the 19th century, the understanding of poverty based on a natural and inevitable condi on for most of humanity, and this situa on would only be considered a social problem if poor people put in danger to society.
The characteriza on of poverty nods to some kind of grace period, which may be solely material or cover cultural and social elements, given the resources available individually or fami-ly. This scarcity can be rela ve or absolute, subjec ve nature (KAGEYAMA; HOFFMANN, 2016).
The parameters, poverty assessment by the criterion of income, tend to defi ne who are
poor those individuals who, temporarily or permanently, do not have access to a minimum of material and fi nancial resources (YAZBEK, 2012). The understanding of poverty as lack of basic
needs is very complex, on the assump on that each individual has specifi c needs.
1.2 The MulƟ dimensional Character of poverty analysis
From cri cal collabora ons of researchers challenging conven onal theory, the use of income for the defi ni on of poverty has lost ground to new approaches that emphasize mul
-dimensionality, as indispensable for the characteriza on of poverty.
The studies of mul dimensional poverty defend the thesis that it is only permissible to really understand poverty if it is analyzed in its various dimensions, which involves trea ng the subject from its mul ple chances and its diff erent aspects, evalua ng them in par cular historical and social context.
Mul dimensional analysis, not only characterized by a lack of income, consider other factors such as the absence of rights, of opportuni es, of informa on, of possibili es and expecta ons (MARTINS, 1991).
Poverty is related to local underdevelopment, which results in poor basic condi ons for welfare such as electric light, treated water, sanita on facili es, and poor access to health and educa on services. However, poverty is also related to the demographic characteris cs and limi-ta ons of human and fi nancial capital, which aff ect the ability to raise family income (KAGEYAMA;
1.3 Place and object of study
Viçosa is a city in the Zona da Mata of Minas Gerais, the local economy, based on the ser-vices sector, is dependent on the fl oa ng popula on, which resides, for the most part, during
the school period in the city. The urban expansion happens in an organic way, adding to already saturated regions and with an old infrastructure. There are currently discussions in society about the benefi ts and harms of not controlling the local growth model. There are problems of rainwater
drainage, transporta on, paving, occupancy in hazardous areas, suppression of watercourses, visual pollu on, sewage and water supply system, and problems with electricity supply.
From 1960, the process of urbaniza on of Viçosa is marked by the increase of the speed of urbaniza on in the already consolidated areas and the expansion of new neighborhoods. This growth was mainly due to the Universidade Federal de Viçosa, which, by expanding its vacan-cies and courses and expanding its jobs, boosted the increase of the popula on of the city. This growth generated several problems resul ng from the accelerated urbaniza on process.
Pretending to know the social reality of the municipality in the last decades, the families in Viçosa are used to address human and family development, based on the Family Development Index (Índice de Desenvolvimento da Família [IDF]), created by Barros, Carvalho e Franco (2003), the purpose of which is to present the socioeconomic profi le of the city of Viçosa, Minas Gerais,
using informa on from the demographic censuses of the years 1980, 1991, 2000 and 2010. From the IDF, it was possible to analyze living condi ons of families in Viçosa, revealing the neediest sectors that have the greatest need for specifi c public policies.
2 METHODOLOGICAL ASPECTS
There is a set of data and social indicators that work with and help expose the most important and varied phenomena. Thus, seeking to provide informa on for this growing demand, the IDF was developed by the researchers Ricardo Paes de Barros, Mirela de Carvalho and Samuel Franco from the Ins tute of Applied Economic Research (IPEA). Aiming to create a synthe c indicator S derived from a series of key indicators, since this is the simplest form of preparing synthe c poverty indicators to measure the degree of family development (BARROS; CARVALHO; FRANCO, 2003).
2.1 Data base
The data used in the present study were extracted from the Integrated Public Use Microdata Series Interna onal (IPUMS-Interna onal), a project linked to the University of Minnesota in the United States of America, which collects and distributes demographic data from censuses from all over the world. Data for the region of Viçosa, Minas Gerais, Brazil was extracted from IPUMS-Interna onal database with informa on from the demographic censuses of the years 1980, 1991, 2000 and 2010.
2.2 Preparing the Family Development Index (IDF)
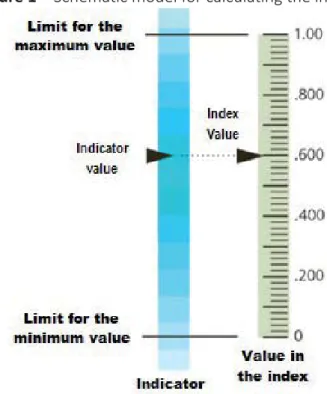
Figure 1 – Schema c model for calcula ng the index
Source: Braga (2015), based on United Na ons (2002).
According to the methodology suggested by Barros, Carvalho and Franco (2003), the elabora on of the IDF in this study was based on the basic informa on contained in the IBGE ques onnaire for the municipality of Viçosa for the demographic censuses of 1980, 1991, 2000 and 2010. Given its linearity, used both in the aggrega on of poverty of several families and in the aggrega on of dimensions related to poverty, the IDF also allows the level of poverty of the en re popula on to be obtained with associa on to each of the dimensions of poverty. For this research, the same method was used, consis ng of 6 dimensions and 45 variables, adap ng the informa on contained in the ques onnaires of the above men oned demographic census.
The six dimensions are vulnerability of the family; access to knowledge; availability of re-sources; child development; housing condi ons and access to work. “Each of these six dimensions represents, in part, access to the means necessary for families to meet their needs and, on the other hand, the achievement of ends, that is, the eff ec ve sa sfac on of such needs” (BARROS; CARVALHO; FRANCO, 2003, p. 8). Chart 1 shows the IDF dimensions and their respec ve variables.
Chart 1 – IDF and its dimensions
Dimension Variable
Vulnerability of the family
No woman had a live birth within the last year No woman had a live birth within the last two years No children (0-11)
No children or adolescents (0-15)
No children, adolescents or young people (0-29) No elderly (<60)
Presence of partner
More than half the member are of working age (15-64) No children whose mother has died in the household
Dimension Variable
Access to knowledge
No illiterate adults
No funcƟ oning illiterate adults
At least one adult who completed basic educaƟ on At least one adult who completed secondary educaƟ on At least one adult with some form of higher educaƟ on At least one worker with a mid or higher level qualifi caƟ on
Access to work
More than half the members of working age are employed At least one occupant has formal employment
At least one occupant who does not work in agriculture
At least one occupant with incomes above one minimum wage At least one occupant with income above two minimum wages
Availability of resources Per capita household income above the extreme poverty line Per capita household income above the poverty line
Child development
No children under 14 working No children under 16 working No children under 6 out of school No children 7-14 out of school No children 7-17 out of school
No children under 14 more than 2 years behind at school No illiterate adolescents (12-14)
No illiterate young people 15 to 17 No mother who lost a child
No more than one mother who lost a child.
Housing condiƟ ons
Homeowner
Home owner or home given
Density of up to 2 occupants per room Permanent construcƟ on
Access to water Sewage
Trash is collected Access to electricity Access to stove and fridge
Access to stove, fridge, TV or radio
Access to stove, fridge, TV or radio and telephone
Access to stove, fridge, TV or radio, telephone and computer Source: Adapted from Barros, Carvalho and Franco (2003).
To fi nd the value within the scale, as shown in Figure 1, it is necessary to calculate the
propor onality of the value by weigh ng the varia on between the minimum and maximum value of each variable. This calcula on is nothing more than the subindex:
Therefore, the subindex shows the rela on of the observed value in the analyzed unit, with the minimum and maximum value of the variable, so that it is posi oned within the interval between 0 and 1.
The IDF ranges from 0 to 1, meaning that the be er the family condi ons, the closer to 1 their indicator will be.
Once all subindexes are calculated, the fi nal index is derived from the arithme c mean of
important variable in the fi nal calcula on of the index. The following is the formula for crea ng
the index:
This procedure was used to create the IDF proposed in this research, below is shown how each of the sub-indices was calculated.
3 IDF IN VIÇOSA, MG, BRAZIL IN THE DEMOGRAPHIC CENSUSES OF 1980, 1991, 2000 AND 2010
According to Jannuzzi (2005), a social indicator, referred in an empirical way, supports in-forma on on the social reality, or allows transin-forma ons in the same one to be perceived. The social indicator is an opera onal tool to monitor social reality, with the aim of formula ng and reformula ng public policies.
The IDF, which works with data that look at the concept of poverty beyond the point of view of income, establishes an instrument that enables analyses that are more cohesive with the social reality of the community. Table 2 presents the results obtained in this research for the IDF of Viçosa MG in the demographic censuses of 1980, 1991, 2000 and 2010.
Chart 2 – IDF –Viçosa 1980, 1991, 2000 and 2010
IDF VIÇOSA 1980 1991 2000 2010
0.624 0.711 0.753 0.794
Dimension Variable 1980 1991 2000 2010
Vulnerability of the family
No woman had a live birth within the last year 0.726 0.812 0.964 0.930 No woman had a live birth within the last two years 0.635 0.767 0.774 0.890 No children (0-11) 0.714 0.735 0.793 0.839 No children or adolescents (0-15) 0.628 0.658 0.710 0.774 No children adolescents or young people (0-29) 0.320 0.385 0.426 0.522 No elderly (<60) 0.933 0.924 0.924 0.890 Presence of partner 0.349 0.374 0.397 0.421 More than half the member are of working age (15-64) 0.715 0.761 0.836 0.874 No children whose mother has died in the
household 0.985 0.988 * *
No children who do not live with their mother in the
household 0.991 0.982 0.988 0.972
Access to knowledge
No illiterate adults 0.813 0.873 0.922 0.945 No funcƟ oning illiterate adults 0.549 0.729 0.830 0.956 At least one adult who completed basic educaƟ on 0.504 0.614 0.774 0.858 At least one adult who completed secondary
educaƟ on 0.359 0.577 0.562 0.633 At least one adult with some form of higher
educaƟ on 0.157 0.156 0.173 0.262 At least one worker with a mid or higher level
qualifi caƟ on 0.049 0.069 0.127 0.124
Access to work
More than half the members of working age are
employed 0.839 0.796 0.785 0.644
At least one occupant has formal employment 0.689 0.535 0.496 0.604 At least one occupant who does not work in
IDF VIÇOSA 1980 1991 2000 2010 0.624 0.711 0.753 0.794
Dimension Variable 1980 1991 2000 2010
Access to work
At least one occupant with incomes above one
minimum wage 0.575 0.907 0.841 0.828 At least one occupant with income above two
minimum wages 0.356 0.605 0.418 0.311
Availability of resources
Per capita household income above the extreme
poverty line 0.578 0.825 0.749 0.969 Per capita household income above the poverty line 0.431 0.749 0.610 0.964
Child development
Child development
No children under 14 working 0.942 0.970 0.985 0.987 No children under 16 working 0.895 0.934 0.962 0.973 No children under 6 out of school 0.020 0.126 0.358 0.637 No children 7-14 out of school 0.787 0.869 0.987 0.987 No children 7-17 out of school 0.708 0.713 0.937 0.952 No children under 14 more than 2 years behind at
school 0.733 0.539 0.852 0.570
No illiterate adolescents (12-14) 0.941 0.947 1.000 0.985 No illiterate young people 15 to 17 0.952 0.968 0.986 0.984 No mother who lost a child 0.345 0.753 0.858 0.894 No more than one mother who lost a child. 0.944 0.937 0.990 0.785
Housing condiƟ ons
Homeowner 0.666 0.747 0.765 0.739 Home owner or home given 0.829 0.870 0.838 0.822 Density of up to 2 occupants per room 0.459 0.593 0.752 0.870 Permanent construcƟ on 0.918 0.965 * 0.996 Access to water 0.643 0.878 0.982 0.997
Sewage 0.522 0.632 0.810 0.890
Trash is collected * 0.495 0.871 0.952 Access to electricity 0.706 0.919 0.988 0.999 Access to stove and fridge 0.447 0.758 0.907 0.977 Access to stove, fridge. TV or radio 0.447 0.723 0.903 0.974 Access to stove, fridge. TV or radio and telephone 0.191 0.235 0.514 0.456 Access to stove, fridge. TV or radio. telephone and
computer ** ** 0.155 0.355
* Data missing from this demographic census ** Home computers were not common Source: Data from the study
Table 02 shows in detail all the variables and their respec ve dimensions in the four demo-graphic censuses analyzed. In order to evaluate the families’ level of development, a hierarchy similar to that of the HDI was used. Thus, indexes above 0.80 were considered a high level of
development, between 0.50 and 0.79 were evaluated as medium development and, fi nally,
indices below 0.50, low level of development.
Based on this specifi ca on, although the municipality of Viçosa shows a growth of 27.21%
in the IDF between 1980 and 2010, from 0.62 to 0.79, the period s ll ends with a medium level of development.
Graph 1 – Evolu on of the IDF for Viçosa 1980 -2010
Source: Data from the study
When observing the diff erence of the mean of the variables of the IDF of Viçosa in the four demographic censuses analyzed, chart 03 shows a wide diff erence between the values, between 0.4051 and 0.9665, refl ec ng great inequality between the dimensions of vulnerability,
access to knowledge, access to work, availability of resources, child development and housing condi ons in the municipality.
Chart 3 presents some basic and preliminary components that help in understanding the distribu on of the data that compose the IDF of the Viçosa families.
Chart 03 – Descrip ve sta s cs of the IDF in Viçosa 1980 - 2010
IDF VIÇOSA - MG Minimum Maximum Index Standard
deviaƟ on
1980
Vulnerability of the family 0.3200 0.9910 0.6996 0.2353 Access to knowledge 0.0492 0.8129 0.4051 0.2783 Access to work 0.3561 0.8521 0.6622 0.2059 Availability of resources 0.4306 0.5783 0.5045 0.1044 Child development 0.0195 0.9521 0.7265 0.3106 Housing condiƟ ons 0.1910 0.9175 0.5825 0.2128
1991
Vulnerability of the family 0.3740 0.9880 0.7386 0.2178 Access to knowledge 0.0690 0.8729 0.5030 0.3207 Access to work 0.5348 0.9073 0.7461 0.1680 Availability of resources 0.7488 0.8254 0.7871 0.0542 Child development 0.1261 0.9695 0.7756 0.2679 Housing condiƟ ons 0.2347 0.9652 0.7104 0.2141
2000
IDF VIÇOSA - MG Minimum Maximum Index Standard
deviaƟ on
2010
Vulnerability of the family 0.4210 0.9720 0.7902 0.1905 Access to knowledge 0.1241 0.9564 0.6297 0.3602 Access to work 0.3111 0.9435 0.6661 0.2416 Availability of resources 0.9643 0.9687 0.9665 0.0031 Child development 0.5696 0.9874 0.8755 0.1575 Housing condiƟ ons 0.3551 0.9988 0.8355 0.2174 Source: Data from the study
The index is the measure of central tendency that expresses the informa on in the data set, here, the highest index belongs to “availability of resources in the year 2010” dimension and the lowest to the dimension “access to knowledge in the year 1980”. The maximum has the highest index within the variables of the dimension, while the minimum has the lowest index among the variables of the dimension.
Graph 2 outlines the evolu on of the IDF mul dimensional indicator calculated for the city of Viçosa, MG, based on the demographic censuses of the years 1980, 1991, 2000 and 2010 for each of the six dimensions. It can be seen that, in general, for fi ve of its six dimensions, there
was evolu on in the condi ons of families in Viçosa, only the indicator that indicates access to work shows a reduc on in its result.
Graph 2 – IDF mul dimensional indicator, Viçosa – 1980 - 2010
Source: Data from the study
Graph 2 presents the six dimensions in the four demographic censuses surveyed. The gre-atest advances in the city of Viçosa and that contributed to the improvement of the IDF in the period analyzed are related to the dimensions of resource availability, child development and housing condi ons, all presented a development index above 0.8 which is considered very high. While access to work and access to knowledge are categorized as medium development index.
Municipal Human Development Index (Índice de Desenvolvimento Humano Municipal [IDHM]). In which, in the la er index, the IBGE evaluates only three dimensions, income, longevity and educa on. The HDI was calculated from the 1991 popula on census, Chart 4 shows the diff e-rence between these two indices.
Chart 4 – Comparison between IDHM and IDF for Viçosa
Demographic census IDHM – Viçosa IDF - Viçosa
1991 0.517 0.711
2000 0.677 0.753
2010 0.775 0.794
Source: IBGE and data from the study.
This result further highlights the relevance of seeking to understand and evaluate the family situa on from a mul dimensional perspec ve, since, in harmony with the methodology used in this research, irrespec ve of whether it is admi ed that fi nancial resources are fundamental for
reducing family neediness. These isolated factors are not suffi cient to guarantee families dignity and to reduce social diff erences.
4 CONCLUSIONS
This study examined the family situa on of the popula on of Viçosa through mul dimen-sional indicators of the family situa on, based on data from the demographic census of the years 1980, 1991, 2000 and 2010. Therefore, the IDF was constructed for the municipality, exploring each of the dimensions that are part of its composi on, consis ng of absence of vulnerability, access to knowledge, access to work, availability of resources, child development and housing condi ons.
In this research, breaking down the family development index, according to the six dimen-sions, made it possible to develop knowledge of the propor on that each subindex represents in the life of the families in Viçosa. Was possible to highlight the popula on’s needs, producing informa on for the authori es, so that specifi c ac ons can be developed to improve the quality
of life of the popula on.
Through the IDF, it was noted that in the municipality of Viçosa, there was a signifi cant
evolu on in the level of development of the families, mainly from the 2000s. This performan-ce reveals an important occurrenperforman-ce, that is, a priori, thanks to social programs to supplement family income with counterpart educa onal obliga ons, some effi cient public policies in social care, educa on, health and, in addi on, the eff ect of fi nancial stabiliza on, which promoted the
resump on of purchasing power of the disadvantaged classes of society.
While the dimensions evidenced by access to knowledge and access to work, did not provide signifi cant advances in the period, we can see growth in access to knowledge, although
s ll not reaching sa sfactory levels, thus confi rming that educa onal policies have not yet been
able to expand service to the families of Viçosa, specially the more disadvantaged ones. In the context of access to work, we note the precariousness of employment and the reduc on of formally employed workers.
Thus, the research ra fi es the need for municipal authori es to establish dis nct public
REFERENCES
BARROS, R. P.; CARVALHO, M.; FRANCO, S. O Índice de Desenvolvimento da Família. Texto para Discussão,
Rio de Janeiro, n. 986, 2003. Available at: <h p://www.ipea.gov.br/portal/images/stories/PDFs/TDs/ td_0986.pdf>. Access in: 04 may 2017.
BRAGA, G. B. Por uma caracterização dos territórios segundo o modo de vida rural e/ou urbano. 2015. Tese
(Doutorado Extensão Rural) - Departamento de Economia Rural, Universidade Federal de Viçosa, 2015.
INSTITUTO BRASILEIRO DE GEOGRAFIA E ESTATÍSTICA (IBGE). Indicadores Sociais Mínimos – Conceitos. [s.d.].
Available at: <h p://www.ibge.gov.br/home/esta s ca/populacao/condicaodevida/indicadoresminimos/ conceitos.shtm>. Access in: 2 may 2017.
JANNUZZI, P. Indicadores e sistema de informação.[s.l.]: ENCE/IBGE, 2005.
KAGEYAMA, A.; HOFFMANN, R. Pobreza no Brasil: uma perspec va mul dimensional. Economia e
Sociedade, Campinas, v. 15, n. 1, p. 79-112, jan./jun. 2016.
MARTINS, J. de S. O massacre dos inocentes: a criança sem infância no Brasil.São Paulo: Hucitec, 1991.
MINNESOTA POPULATION CENTER. Integrated Public Use Microdata Series, Interna onal: version 6.4
[dataset]. Minneapolis, MN: University of Minnesota, 2015. Doi: h p://doi.org/10.18128/D020.V6.4
SCHWARTZMAN, S. As causas da pobreza. Rio de Janeiro: FGV. 2007.
UNITED NATIONS. Human Development Report 2002: deepening democracy in a fragmented world. New
York: Oxford University Press, 2002.
YAZBEK, M. C. Pobreza no Brasil contemporâneo e formas de seu enfrentamento. Serviço Social e Sociedade,
v. 110, p. 288-322, 2012.
About the authors:
Bruno Silva Olher: Doctorate in Domes c Economy and Master Business Administra on from
the Universidade Federal de Viçosa (UFV). MBA: Strategic Management in Opera ons, Logis cs and Finance, and Specializa on in Entrepreneurial Educa on by the Universidade Federal de São João del Rei (UFSJ). Gradua on in Administra on by the Centro Mineiro de Ensino Superior (CEMES). Eff ec ve Professor of the Ins tuto Federal de Educação, Ciência e Tecnologia do Sudeste de Minas Gerais, campus Rio Pomba. E-mail: [email protected]
Maria de Lourdes MaƩ os Barreto: PhD and Masters in Educa on from the Universidade
Estadual de Campinas (UNICAMP). Gradua on in Domes c Economy by the Universidade Federal de Viçosa (UFV). Associate Professor IV (PhD) of the Universidade Federal de Viçosa. E-mail:
Gustavo Bastos Braga: PhD in Rural Extension by the Universidade Federal de Viçosa, with a
sandwich period at the Universidade do Minho, Portugal. Master in Business Administra on from the Universidade Federal de Viçosa. MBA in Logis cs from the Faculdade de Ciências Biológicas e da Saúde. Extension in EAD Teaching by Fundação Getúlio Vargas. Postgraduate in Strategic Management from the Faculdade de Ciências Biológicas e da Saúde. Gradua on in Administra on from the Universidade Presidente Antônio Carlos. Associate professor at the Universidade Federal de Viçosa. E-mail: [email protected]
Maria das Dores Saraiva de Loreto: Post-doctorate in Family and Environment at the University