Releases as Adverts:
Product Discovery in
Video-games
Francisco Monteiro
Dissertation written under the supervision of Martin Quinn
Dissertation submitted in partial fulfilment of requirements for the MSc in
Management with specialization in Strategic Marketing, at the Universidade
Releases as Adverts:
Product Discovery in Video-games
Francisco Monteiro
June 15th 2020
Supervisor: Martin Quinn
Abstract
Consumers do not have perfect information about products. Therefore, product discovery plays a key role. I use the market for video-games to estimate the causal effect of the release of a new game on the performance of an older game by the same company. I find that, in the weeks before the release, the old game underperforms, which is consistent with a substitution effect between the old and the new game. In the weeks after the release, the old game increases performance significantly, which suggests that there is a backwards information spillover. This average treatment effect can be as high as 20% in the number of owners. Overall, I find that the release of a new game serves as a advert for the old game.
Releases as Adverts:
Product Discovery in Video-games
Francisco Monteiro
15 de Junho de 2020
Supervisor: Martin Quinn
Resumo
Os consumidores não têm informação perfeita sobre produtos, o que implica que a des-coberta de produtos é essencial. Usando o mercado de video-jogos, eu estimo o efeito causal do lançamento de um novo jogo no sucesso de um jogo pré-existente, produzido pela mesma empresa. Nas semanas antes do lançamento, o jogo pré-existente sofre em termos de número de utilizadores, o que é consistente com um efeito de substituição entre os dois jogos. Nas semanas após o lançamento, o jogo pré-existente melhora substancialmente em termos de número de utilizadores, o que sugere que existe um efeito de transmissão de informação. O efeito médio de tratamento pode chegar a 20%. Em suma, eu encontro evidência que o lançamento de um novo jogo serve como publicidade para os jogos pré-existentes.
Palavras-chave: Publicidade, Informação sobre Produto, Informação Imperfeita, Plata-formas
Acknowledgments
I want to thank my brother for all the help he gave me throughout this thesis. I would also like to thank my advisor for all his help and effort.
I acknowledge the support from FCT - Portuguese Foundation of Science and Technology, for the project FCT-PTDC/EGE-OGE/27968/2017.
Contents
1 Introduction 1 2 Data 5 2.1 Data Description . . . 5 2.2 Developers . . . 7 3 Results 15 3.1 Empirical Strategy . . . 15 3.2 Results . . . 16 3.3 Adjacent Games . . . 20 3.4 Challenges to Identification . . . 22 4 Conclusion 23 References 25 Appendix 261
Introduction
Consumers do not have perfect information about products. Therefore, product discovery plays a key role, particularly in very dynamic markets which generate massive amounts of information. This creates a role for an information intermediary, such as a platform, that produces top charts or bestseller lists, that depend on popularity. This intermediary has a significant impact on the success of a product. In this situation, dominant firms who are able to sustain high levels of advertising, can augment their market power through presence in these lists. It also creates a role for advertising which, even if it is persuasive (it affects the preferences of consumers directly), may be welfare-enhancing as it helps resolve the information asymmetry.
Moreover, many of these dominant firms are in fact platforms (as they are able to exert a markup through an information monopoly), such as Steam. These platforms usually use recommendation systems, in which an algorithm uses the past purchases of the user and the purchases of users with similar characteristics to provide recommendations. These systems may reinforce the popularity of already popular games and lead to higher concentration in sales.
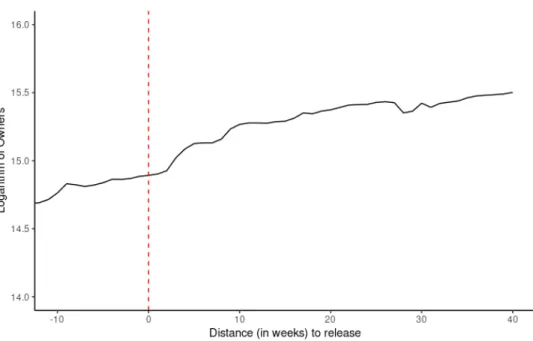
On October 2017, Ubisoft released Assassin’s Creed Origins, a long expected sequel to the Assassin’s Creed Franchise. However, another game by the same developer, Tom Clancy’s Rainbow Six Siege, which had been released in December 2015, and which had no relation whatsoever to the Assassin’s Creed franchise, experienced a significant increase in ownership, as show in Figure 1. The figure shows the evolution of the natural logarithm of the number of owners over weeks. I rescale the horizontal axis in order to have a measure of distance to the new release. This is helpful as it allows me to analyze the percentage change in the number of owners as the slope of the function.
This effect suggests that there is a significant backwards information spillover in this partic-ular market, which is a relevant phenomenon as it relates to not only a possible failure in advertisement but also to the behavior of platforms.
In this thesis, I use a dataset of video-games to estimate the causal effect of the release of a new game on the performance of older games by the same company. Video-games are an ideal market to study, as consumers often use platforms that aggregate information about the products. I find that, in the weeks before the release of a new game, the old game underperforms. I attribute this to a substitution effect - consumers are either postponing the
FIGURE 1. Reaction in number of owners
purchase of the older game or they are saving to purchase the new one. In the weeks that follow the release, there is a slow increase in performance for the old game, peaking at an average treatment effect of 20%, which then slowly decays. I take this as evidence of product discovery on the part of the consumers.
I look at this effect by estimating the causal effect of the release of a second game on the performance on the first game, the effect of a third game on the second game and the effect of the third game on the first one. In all of these exercises, the results suggest a strong backwards information spillover associated with the release of a new product that enhances the performance of the older product. I also compare all adjacent games, in an exercise which serves to confirm this hypothesis.
There are concerns that part of these results can be driven by a reaction in the pricing behavior of platforms, either through discounts on the older games or bundling. I cannot address these concerns directly due to data limitations but, even if they are true, they still suggest that the platforms internalize product discovery. Therefore, the effects I find are not causal, but still suggestive.
I also find that the HHI in this market decreases over time. This result is not standard in the literature and it suggests that aggregate level diversity, which is the number of games avail-able in the market, is increasing. The literature usually finds that platforms (and product discovery) increase individual level diversity, which is the number of games in the
consider-ation set of the consumer, but make no such predictions for aggregate level diversity. The cause of the increase in aggregate level diversity is not obvious and there are two possible causes. It could be that there are many entrants producing new games or it could be driven by product discovery on the part of the consumers. In this work, I find evidence supporting the latter but cannot analyze the former.
This work is related to Hendricks and Sorensen (2009), who conduct a similar exercise for the music market. However, I believe that my work adds to the literature by focusing on a market where the product is consumed over a longer period of time and is more expensive, which helps rule out impulse purchases that could be driving the result for the music market. Moreover, the video-game market is dominated by few platforms, which actively price and advertise products to consumers. This dominance by platforms allows me to show that these information asymmetries are not fully resolved by the platform and suggests that platforms may have an information monopoly through which they may extract consumer surplus, thus increasing their markups.
Overall, I find that the release of a new game serves as an advert for the old game. This advert is costly, both through the direct cost of a new game and through the negative effect in the old game in the period before the release, but effective. It remains to be seen whether this type of advertisement is persuasive or truth-telling.
Related Literature This thesis is related to the field of consumer choice under imperfect information and to platforms.
Consumers can only decide upon products they know, i.e., products in their consideration set. Products outside of their consideration set cannot be considered for the decision-making process. In this sense, imperfect information decreases consumer surplus by restricting the consideration set. This is common in markets with high product entry. Goeree (2008) finds that imperfect information is not uniform, as consumers are more informed about certain brands. Companies with higher advertising expenditure have higher awareness and are therefore able to capture more surplus.
Similarly, bestseller lists or top charts also restrict the information available to consumers. Since they promote a specific and relatively small number of products, many consumers focus only on those. Therefore, as Sorensen (2007) finds, they have an important impact on the volume of sales. Consumers perceive presence in a bestseller list as a signal for quality, either directly or indirectly through popularity.
This effect is also present in online platforms. Aguiar and Waldfogel (2018) report that online music platforms have a big impact on the success of artists. The platform has the power to either recommend a song to the user or include the song in certain top charts. Any of these options would improve the awareness of the product, thus giving platforms a lot of power over product discovery. In a way, platforms have some degree of control over the management of imperfect information, since they hold power over which information goes to consumers and which doesn’t.
As consumers do not have perfect information, product discovery is a relevant element of the consumer’s problem. Product discovery may take place at the moment of the product release or sometime during the lifetime of the product. It can be caused by the complexity of the product or, most likely, by search costs. In this dimension, Bakos (1997) reports that electronic marketplaces, or online platforms, facilitate product discovery since they lower search costs.
Online platforms also serve as information intermediaries, as they provide information to consumers through their recommendation systems. This mechanism causes and, in some cases, enhances product discovery. It has been suggested, as in Fleder and Hosanagar (2009), that recommendation systems increase individual product diversity, i.e., the range of products that the consumer is aware of (consideration set), by lowering search costs through the use of tailored recommendations to consumers.
As with many intermediaries, platforms exist because they are able to lower search costs and thus promote product discovery. This in turn helps firms with lower levels of advertising achieve higher sales, thus increasing the sales tail distribution, as shown in Brynjolfsson, Hu and Simester (2011). So, on one hand, there is a clear effect in markets with high competition and imperfect information. On the other hand, there is an opposite effect, where online platforms reduce imperfect information and facilitate product discovery, specially of lesser known firms, giving them a possibility to overcome the advertising expenditure differences.
Since these recommendations depend on the overall popularity of the products, Fleder and Hosanagar (2009) also found that, in media goods, such as video-games, popularity is strongly self-reinforcing. This may aggravate the problem of imperfect information, as already popular products (and that consumers are already aware of) become more popular, and less popular games are less likely to be considered. However, Fleder and Hosanagar (2009) find no evidence that aggregate level diversity increases due to this phenomenon. They rationalize this finding by claiming that, as individual consumers receive more information, that information is not
purely idiosyncratic, as many consumers receive that same signal. Hence, aggregate level diversity need not increase, as product discovery may imply only a shift in concentration. In fact, if the self-reinforcing popularity mechanism is very strong, it may be that aggregate level diversity decreases.
Given both imperfect information and product discovery, the natural focus should be on decision making – recognition of the product and information search. Recognition of the product happens through advertising, as the consumer is able to recognize the product from advertising or other similar products. Information search is also relevant as the consumer must gather information about the product.
A new product release is a form of advertising as it creates awareness for the product being released but also for the company releasing it. In a market with heterogeneous products, advertising enables consumers to obtain accurate information about the product (Grossman and Shapiro, 1984), and infer information about the brand.
In this spirit, Hendricks and Sorensen (2009) find evidence of backward spillover effects on the music market, as a release of a second album had a positive impact on the sales of the first album of the same artist. This is consistent with the two forces outlined above, and with imperfect information. They claim that the consumers would have bought the first album if they knew about it, and that the second album serves as an advertising tool for the first album.
This thesis is organized as follows: section 2 describes the dataset, section 3 presents my em-pirical strategy and the results, as well as a discussion on possible challenges to identification, and section 4 concludes.
2
Data
2.1
Data Description
I use a dataset containing information on games from Steam, which is a platform that works as a video-game digital distribution service. Steam also has a social networking component, a feature where games are automatically updated and hosts servers for online gameplay. The data was gathered by Steam Spy, which is a company that specializes in gathering data from the Steam platform. Steam Spy crawls through a sample of users and estimates the true
values of the measurements it offers, with its creator stating that its accuracy is around 90%.
The data contains daily observations on 1,685 games, from April 2015 to August 2018. For each game, I observe the game’s developer, which is the company responsible for creating the game, and its publisher, which is the company responsible for selling the game. For every daily observation, I also observe the number of owners of the game. This will be my main variable of interest.
In this dataset, an owner is defined as a consumer that has purchased the game and currently has it in his Steam library. If the user has the game in his library, then the game has not been uninstalled or deleted from the library. It also implies that the user has not deleted his Steam account. Either of these actions would result on the user forfeiting his ownership of the game. There is another situation in which the user may forfeit his ownership of the game, which is if the user is banned. If the user is banned, either temporarily or permanently from Steam, which may happen through cheating, selling accounts or inappropriate behavior in the user forums, the user forfeits ownership of all games in his library. It is also possible for a user to return a game, even though Steam’s return policy is very strict. A game may be returned with no additional costs in the two-week period after purchase conditional on the game time being inferior to two hours.
I impose a series of filters in the data. First, I remove all test apps and games for which there isn’t a single observation. Second, for games that did not have developer or publisher infor-mation, I manually checked Steam, Steam Spy and Steam DB1 to obtain that information.
I also used this information to correct some release dates.
The raw data is at a daily frequency. However, there are some missing observations for daily owners. These missing observations were small in number, around 1.67% of the total number of observations, but they affected roughly half the games in the sample. Since the data seemed to be missing at random and with no discernible pattern, I decided to aggregate the data to a weekly frequency, by taking the average of the daily observations. My main variable of interest is the logarithm of the number of owners, which is a cumulative variable. I chose the logarithm instead of the level in order to reduce skewness and the number of outliers, and to obtain a variable that, in principle, could take both negative and positive values. I present a histogram of this variable in Figure 2, where the vertical dashed line represents the average.
1Steam DB (Database) is a website containing information about games present on Steam, as well as
FIGURE 2. Distribution of owners
There seems to be quite a lot of mass around the mean, but the distribution still seems to be positively skewed, as there is more mass to the right of the mean, but a flatter left tail. This finding suggests that there are some games that have low ownership numbers but that there are also a lot of games that are somewhat successful in this lower tier.
I choose a cumulative variable, instead of a flow variable like the number of new owners for two reasons. First, the flow variable is very noisy. For example, there are sometimes negative values, which means that the number of owners decreases, which is very unlikely as the return policy on video-games is quite strict. Second, in my empirical analysis, I will be focusing on events that unfold over several weeks, which means that I will be comparing the data to a longer term counterfactual, thus making a stock variable more appropriate.
2.2
Developers
So far, I have been using the entire sample. However, since I am interested in identifying causal effects on the company, I will need to change my unit of analysis to company. There are two possibilities - developer, the company that produces the game, and publisher, the company that distributes it. I will be focusing on developers as publishers are much larger companies and therefore more susceptible to negative shocks for which I will not be able to control. 2 On the other hand, developers are smaller companies, for which these effects will
2For example the publisher Electronic Arts lost USD 3.1 billion in value over the negative impact of a
be easier to identify.
Each developer has several games, and I am interested in studying the impact of a release of a new game on the previous ones. In Figure 3, I plot the evolution of the logarithm of owners over time since the release date according to the order in which they are released. For each release order I take the median number of owners of all the games at every week, then the data is aggregated by month for readability.
FIGURE 3. Owners per release
There are two aspects of interest here. First, it is clear that for most of the time the 1st release has the highest owners. This happens because it also includes some games launched before the start of the dataset, which allow it to start at an advantage, both having higher owners and having time for games to become even more popular. Secondly, the pattern for all release orders are similar. They start increasing almost exponentially in the first 10 months, eventually decreasing the growth rate to a lower level. Although release order 4 does stabilize all the others keep increasing.
The sample is not balanced and there are some developers with pre-existing games. In order not to lose observations and power, I aggregated these games into a single virtual game, which is the simple average of all pre-existing games per developer. I will be including these virtual games in all the analyzes that follow. Excluding them would not significantly change the results.
There are also some seasonal elements in game releases. In Figure 4, I plot the distribution of new releases over the different months. This will allow me to check for seasonal effects and
to identify the ideal months in which developers release games.
FIGURE 4. Releases per month
There are spikes in new releases in April and in the months around Christmas. These are driven by seasonal fluctuations in demand: releases in April and around Christmas will overlap with the end of the school year. Moreover, releases around Christmas will be used as Christmas gifts, which stimulates demand.
Note that Steam is known for regularly having big sales. These discounts have no definitive calendar, however they seem to have a pattern. The first sale of the year, called the Lunar Sale, is between the end of January and during February. The second major sale, the Spring Cleaning Event, usually occurs in the end of April and through May. Next is the Summer Sale, occurring between June and July. Then comes the Autumn Sale, coming at the end of November. Lastly is the Winter Sale in December. Note that most releases occur in months when there are no sales. This indicates that Steam or the developer choose to release the new games when there are no current sales, which helps in extracting as much surplus as possible.
In my analysis, I will focus on the effect of the release of the second game on the first game and on the effect of the release of the third game on the second game. I do this simply because of data availability. In Figure 5, I plot the distribution of the distance, measured in weeks, between game releases.
On average, the distance between the two adjacent releases is very similar in the two cases. The main difference comes from the right tail, i.e., games whose releases are very far apart.
FIGURE 5. Distribution of distance between releases
This is driven by developers that have only two games that are very far apart, and that will therefore not appear in the second case. Nevertheless, by looking at distance under 50 weeks, I will be capture most of the variation in game releases.
First thing to notice is that there is a longer tail in Game 1 to 2. This happens due to the presence of outliers, who have high distances between the releases of the first and second game. This might skew the results, and most likely these outliers belong to small developers who have lower production capabilities or to specific games who took a long time to produce.
On the other hand, the average distance between releases is identical for both cases. This might be an indicator that there may be some usual time frame for releases, perhaps connected to the amount of time it takes to produce a new game.
Note that the interquartile range is similar, given the aforementioned reasons this makes sense. However, the percentile 75 is larger for Game 1 to 2 which indicates a higher spread in distribution. This might happen because some unsuccessful firms, taking too long too release new games and finding themselves in straining financial positions might exit the market. This would explain the fact that releases seem shorter in Game 2 to 3, since one aspect relative to success might be consistently producing new games in shorter time spans.
Finally notice how the density is higher in the left tail, meaning that most games are released before the average distance. This is substantiated by the fact that there are outliers increasing the value of the average time between releases. Furthermore, there are more “smaller” games being released than “high-visibility” titles. The latter take more time to produce and thus
TABLE I. Summary Statistics
Panel A: Sales in first year
N Min Percentile 25 Median Mean Percentile 75 Max Game 1 136 9 143 159 393 287 357 648 745 546 839 7 977 680 Game 2 125 24 286 120 571 203 286 397 638 347 143 6 580 714 Game 3 32 23 857 113 857 181 429 268 821 273 929 1 740 143
Panel B: Sales in first month as fraction of sales in first year N Min Percentile 25 Median Mean Percentile 75 Max Game 1 136 10.94% 6.63% 34.25% 58.18% 57.45% 92.41% Game 2 125 4.12% 4.80% 13.46% 31.20% 25.42% 38.19% Game 3 32 4.19% 2.67% 13.70% 31.25% 32.50% 38.77%
Panel C: Week with highest increase in owners
N Min Percentile 25 Median Mean Percentile 75 Max
Game 1 136 2 34 114 101 166 177
Game 2 135 2 10 43 56 97 170
Game 3 38 2 10 43 52 86 144
Panel D: Week with highest percentage increase in owners N Min Percentile 25 Median Mean Percentile 75 Max
Game 1 136 2 2 11 51 111 177
Game 2 135 2 2 3 13 12 121
Game 3 38 2 2 4 11 13 68
are fewer in number, whereas the former can be released more often. Given this, it is clear that by looking at the distance under 50 weeks, I am able to capture most of the variation.
In my analysis, I will consider the effects within developers and within publisher. In order to do so, I created two samples. The first one, the developer sample, contains 136 unique developers and 338 games, with 40,520 weekly observations and an average of 2.5 games per developer. The second one, the publisher sample, contains 149 unique publishers and 457 games, with 53,507 weekly observations, with an average of 3 games per publisher.
In Table I, I present summary statistics for the developer sample, which will be the main sample of interest.
Regarding Panel A note that sales are in volume rather than value, so it does not mea-sure revenue. Instead it meamea-sures popularity. Also, note the difference in the number of observations for each game order, Game 3 has a significantly lower amount of observations.
The difference in average sales in the first year between the games is inversely proportional to their release order, where earlier releases have higher sales volume within the first year. However, when looking at the median values the difference between games is significantly lower. This happens due to outliers, namely some highly successful games that are increasing the average value. For this reason, it is necessary to use the logarithm of owners rather than the level, as well as underlining the necessity to use the stock variable instead of the flow. The flow variable could take negative values, which would make it impossible to take the logarithm, decreasing the skewness of the variable. Moreover, the magnitude of the outliers would simply skew the results. Moreover, due to skewness and kurtosis note how the mean values are higher or almost equal to the percentile 75.
Game 2 and 3’s statistics for the minimum and percentile 25 values are quite close. This mostly happens because they share the same early lifecycle progress. Nevertheless, this is not constant throughout the dataset, since Game 2 is released earlier it has more time to advance in its lifecycle, thus the differences in percentile 75 and maximum values. Game 3 often does not have enough time observations to reach a more mature phase. The values for Game 1 are significantly higher for the mean, percentile 75 and maximum values since the games have more time to develop and grow. Besides, some games belonging to release order 1 were also released prior to the start of the dataset, which means that they can already be in a more mature phase. Both these factors lead to the aforementioned skewness, which is more present in release order 1. In terms of the percentage of total first year sales achieved in the first month, it is clear that where Game 2 and Game 3 values are similar, Game 1 again has major differences.
Note that, on average, almost one-third of first year sales are achieved in the first month alone. Moreover, the maximum values are not that different, which indicates a small right-tail. However, when comparing the average values with the median, it is clear that the latter is driven upwards by some highly successful or highly anticipated releases. Regarding changes in the stock values, both the absolute and relative variation are presented. It is expected that games have higher relative changes early in their lifecycle, whereas in terms of absolute values this is not the case. Discounts, free trials, updates or other external shocks may drive the absolute variation, however their magnitude is difficult to predict. Once again, for Panel C, the values for Game 2 and 3 are fairly similar, with Game 1 breaking pattern. However, it is interesting to see that the distribution seems to be more balanced, with similar tails and lower differences between the mean and median values. Note that the number of observations is higher for Game 3 than in the first two panels, since not all games of this release order have a full year of data points.
As anticipated, the largest relative changes occur more often early in a game’s lifecycle, which seems to follow an exponential-like growth in relative terms. Usually games grow substantially in the first weeks, then eventually the growth rates start to decrease. Game 1, containing previously launched games, has more distant weeks with highest percentage increase. This happens due to having larger magnitudes in the stock variable, thus needing strong shocks to cause big increases.
Video-games, contrary to other cultural items, have the possibility to be updated frequently, thus their lifetime is typically higher than that of other cultural products. Furthermore, video-games for PC have the possibility to be modified by consumers, this is called modding. Modding consists of players making significant alterations to the code of the game, altering several aspects of it. A mod can go as far as changing an entire game, making it almost unrecognizable. The advantage of modding is that it can further expand the lifetime of a video-game, some games have lasted several years as bestsellers due to modding , since they attract a lot of attention and can easily be transformed into an almost new product by adding a mod. This impacts the sales path of individual games, since declining sales may suddenly have its trend inverted by having a mod released for that game, thus making it difficult to infer highly accurate information from summary statistics.
For context, either in the developer or the publisher sample, no company has a market share of even 7%. This indicates that the market is not concentrated, but instead highly diversified. The main reason for this scenario is that there are several companies that produce games with high visibility, thus making it difficult for any company to keep a persistent market leadership position. Moreover, given the heterogeneity of both products and consumers, it is difficult for video-game companies to have products that keep players engaged mostly with their own offerings. Although at purchase games might be competitors, much like in the overall cultural industry it is common for a consumer to eventually purchase multiple products and use them actively, as such it is challenging for a company to stay ahead of the competition. The publisher sample has an average Herfindahl-Hirschman Index (HHI) of 0.0227 through time. This is quite low, meaning that in a market with similar competition there would be 44 different publishers. For the developers the market seems to be a bit more concentrated with an HHI of 0.026 which would mean 39 equal-sized firms in a perfectly balanced market. Next, I present a plot depicting the evolution of HHI through time, and this is relevant to understand how concentration or market powers changes through time.
Furthermore, in some sense it might bring some insights into the idea that platforms increase individual level diversity, while at the same time decrease aggregate level diversity (Fleder
and Hosanagar, 2009). Should the HHI decrease through time, I expect this to come from one of two effects. In a market with single-product firm or multi-product firm with a stable number of products, a steady decrease in HHI means that new entrants are gaining market power consistently. On the other hand, in a similar scenario this might not be caused by new entrants but rather by product discovery. This would mean that contrary to the literature aggregate level diversity is actually increasing.
However, should the HHI increase through time and should I find clear evidence of product discovery, this confirms the idea of Fleder and Hosanagar (2009), where individual consumers have their diversity increased, while at the same time, because many consumers are discov-ering the same product, aggregate level diversity may in fact be decreasing. Therefore, in Figure 6, I plot the evolution of the HHI over time for developers.
FIGURE 6. HHI for developers
Figure 6 shows that concentration decreases through time. This indicates that in fact, due to market entrance or product discovery, aggregate level diversity is increasing, thus driving concentration levels down. Although the dataset has a short time span, this may be in-dicative of a larger effect, where platforms stimulate these effects. Lower concentration and market power indicate that markups may be transferred from the video-game companies to the platform itself. Since the video-game companies face now lower levels of concentration this stimulates either price competition or higher investment in advertising, decreasing their markups. Meanwhile, the platform seems to gain higher relative power over the suppliers, giving it higher markups.
The spike present in week 3 is caused by two developers, Gearbox Software and Tango Gameworks more than doubling their market share from one week to the next. This could be either due to measurement error or perhaps a sale for the games from these developers which
inflated their respective game’s ownership. It is possible to see the exact same pattern, of continuously decreasing HHI through time, as well as similar spikes within the first 50 weeks, in the publisher sample. These results respect the trend in the literature, where it has been found that the internet, in reducing search costs and helping decrease imperfect information, has been reducing concentration of sales and creating a long tail effect (Brynjolfsson, Hu, and Simester, 2011).
3
Results
3.1
Empirical Strategy
The goal of this thesis is to measure the impact of a new game release on the number of owners of pre-existing games by the same developer. I will be focusing on developers, but I present results for publishers in the Appendix.
The Average Treatment Effect (ATE) is the measure of how much the outcome changes due to the treatment. In this case, it is how much the number of owners of a game changes due to being treated for some period. This statistic will be computed by comparing a treatment group, the games from developers whose new release is in period 𝑡, and the control group, which consists of games that have not yet been treated. Therefore, all games in my sample will be treated, which makes this a staggered implementation. The treatment window is 50 weeks long, as I include 10 weeks before the release of the new game to estimate the pre-release effect and 40 weeks after.
There are two reasons for including the pre-release period in the treatment window. First, companies will often pursue promotional activity relative to the release, and this will already expose consumers to the new release and may impact the previous games. Second, games can either be sequential in story or simply connected, which could mean that players might want to play through the games in the correct sequence, meaning that they would purchase the previous game, play it, then purchase the new release. All this could be done in the weeks following up to the new release.
All games in the sample will be treated only once, as they are removed from the sample after the end of the treatment window. I am therefore using games that have not yet been treated as counterfactuals to games that have been treated. Hence, the data I will be using for the
regression includes all the treatment windows for all games.
Let 𝑦𝑠
𝑖𝑡 be the outcome variable, the logarithm of the number of owners, for game 𝑖 in week
𝑡, which is 𝑠 ∈ [−10, 40] weeks away from the release of the new game. The ATE will be the difference between 𝑦𝑠
𝑖𝑡 and 𝑦⋆𝑖𝑡, which is the counterfactual outcome. I will be conducting a
multi-period difference in differences analysis, which is estimated as
𝑦𝑠𝑖𝑡= 𝛼𝑐+ 𝜆𝑡+ 12 ∑︁ 𝑚=2 𝛾𝑚𝑑𝑚𝑡 + 40 ∑︁ 𝑠=−10 𝛽𝑠𝐼𝑖𝑡𝑠 + 𝜀𝑖𝑡, 𝑠 ∈ [−10, 40] (1)
where the dependent variable is the logarithm of the number of owners, for game 𝑖 in week 𝑡, which is 𝑠 ∈ [−10, 40] weeks away from the release of the new game. I include a developer fixed effect 𝛼𝑐 to account for persistent differences across developers and a time fixed effect
𝜆𝑡 to account for common shocks. This time fixed effect will also partially account for the
natural life-cycle of the games. I then include a series of month-of-the-year fixed effects 𝑑𝑚 𝑡
to account for seasonality. The coefficients of interest are the 𝛽𝑠, which multiply an indicator
variable that takes the value of 1 if the game is 𝑠 weeks away from a new release, and which represent the ATE. Errors are clustered at the developer level.
I will further restrict the sample by looking first at the impact of the second release on the first game, the impact of the third release on the second game and the impact of the third release on the first game, in order to disentangle possible persistent effects.
3.2
Results
In this subsection, I will report the results of Equation 1 for the sample in which developers are the unit of analysis.3 I will begin by analyzing the case of the release of the second game,
and its impact on the first game.4 I present the estimated 𝛽
𝑠 from Equation 1 in Figure 7,
which then contains both the ATE and a 95% confidence interval.
There are three different elements in the plot: (1) effect before launch is either null or negative, (2) positive effects only starts of after 10 weeks and (3) effect is very persistent.
Regarding the first element, having negative effects may stem from two factors. First, there
3The results in the publisher sample were fairly similar, with all regressions showing the same path for
the effect through time.
4This regression includes the virtual games, but results remain largely unchanged if these games are
FIGURE 7. ATE for release of second game on first game
may be a plain substitution effect, where consumers would rather wait and purchase the newer game. Secondly, the above-mentioned substitution effect may not be permanent, and consumers may rather wait, purchase the new release and only then purchase the previous game.
The second element is that owners starts increasing as the treatment period increases. This effect starts occurring significantly after 10 weeks, giving more than enough time for players to both finish the new release and discover the previous game from the same developer. The effect starts small, with only 10% more owners for games whose developer had a new release 11 weeks ago.
Besides the backward spillover effects caused by information spillovers and product discovery, this positive impact may also partially be explained by having games which are complemen-tary products. Game franchises, or game sequels that follow similar or shared story lines can be considered complementary products, not in the sense that they are often bought together, but in the sense that there is extra utility for the consumer in owning both products. In the video games case this would be translated in completing fully the story line.
The third element depicted is the persistency of the effects, which are significant until the end of the treatment window. This shows signs that product discovery occurs at different times for different consumers.
The positive effects ranges from 2% to 11% increases in the amount of owners due to the new release. It is clear that the effect has time dynamics, in the sense that as one moves
further from the new release the impact decreases, until it eventually dies out. This would indicate the such a window is the optimal time for product discovery, and that after such a time, discovering the previous game would be more likely by chance or some other exogenous shock.
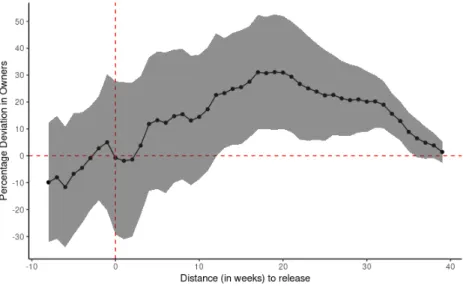
I can also compute the ATE for the release of the third game on the second game, which are represented in Figure 8.
FIGURE 8. ATE for release of third game on second game
The main difference between this regression and the previous one is the noise. There are less observations available in this scenario, since not all developers launch 3 games. This is why the standard errors are significantly larger for this regression. Nevertheless, similar effects are present. With null effects before the new release and persistent positive effects afterwards.
The null effects arise based on the same explanation as before, a decision made by consumers to postpone the purchase of the previous game until after the new release. However, given the null effects here it might simply be the case where information hasn’t had enough time to spread. Both in arising consumer’s interest to look for other games of the same developer, or for recommender systems to start delivering this information to consumers, there needs to be enough time to capture the positive effects of the new release, where good publicity and overall appraisal of the new release play important parts.
The positive effects start showing just after week 10, a couple weeks later than previously, but still indicative of a possible pattern. They are persistent throughout the remaining treatment window, hitting its maximum of 31% in week 20 and then slowly declining.
In this case the effects are substantially higher than the previous one, ranging between 2% to 31%. This may arise due to consumers having more time to recognize the developer. In this situation, consumers would possibly have been exposed to other previous games from developers, which might create a higher reputation effect.
Moreover, this particular time window captures a specific game more prominently, given that it uses fewer observations. The estimated ATE are mostly driven by the effect of the release of Assassin’s Creed Origins on Tom Clancy’s Rainbow Six Siege, which are both very successful games. Nevertheless, and despite the noise, the results are largely in line with those I presented above.
I will also present ATE for the release of the third game on the first one, which are represented in Figure 9.
FIGURE 9. ATE for release of third game on first game
The results here suggest that the effects are persistent, but they might be direct or indirect (through the second game). However, the ATE is not very well identified in this case, as there might be overlapping variation between the direct and indirect effects. However, differential identification is not possible.
The effects are much smaller in this case, only showing positive effects at all 27 weeks after the release. However, the pattern is very similar, with either null or negative effects prior to the release, then a gradual increase until they become positive and significant.
The loss of observations may be related to firm’s success. It is expected that more successful firms are able to consistently keep launching new games. Whereas unsuccessful firms, who
fail or take too long to launch new games may exit the market. This would indicate that the observations in higher release orders have a skewness towards more successful firms. However, given the low amount of observations it is not possible to analyze the difference in ATE between more and less successful firms.
3.3
Adjacent Games
So far, I have considered samples which do not overlap. However, in principle, the relevant ATE should be computed for all consecutive releases for the developers. In order to do this, I use Equation 1 and include all consecutive releases. This implies that the same game may appear more than once (once as an observation and once as a release date), and that there might be overlapping time periods. The results are represented in Figure 10.
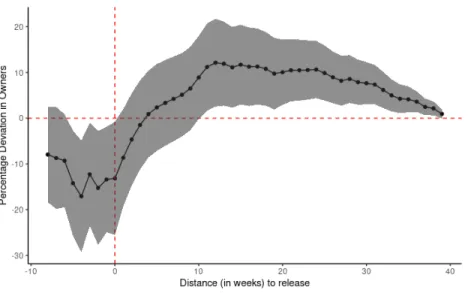
FIGURE 10. ATE for adjacent games
There are two distinct periods here. The first period, until roughly 10 weeks after the release and the second one, from that point until the end of the treatment window. The first period shows null effects, which can be attributed to a postponing of the decision to purchase the game only after the release or simply that the release does not affect the previous game yet. The second period, starting at 8 weeks post-release, shows uninterrupted positive effects. These impacts range from 1% (in the last period of the treatment window) to a peak of 18% (15 weeks after the release).
In terms of the evolution of the impacts, there’s a clear arc, where the effect starts becoming positive, then peaks and eventually declines until it becomes almost null again. Nonetheless,
it produces evidence that games do have a significant and decisive increase in owners when a new game is released.
The pattern is similar to the one presented before, which serves as a validation of the shape of the effects. However, note how there are only null effects in Figure 10. This could mean that although some consumers are in fact either postponing the purchase decision, or substituting the previous game with the new release, the bigger effect is that information has not started to spread yet. This seems reserved to only after the release, which in theory makes sense, since it gives consumers time to first acquire information regarding the new game and then infer qualities on the developer and their products from it.
As the number of games between releases increases, there are still positive impacts of the new release. The effects do not appear anymore when there is a 3-game gap between the games in question, which means that such a gap is the limit of the backward spillover effect between two games.
The adjacent regression is basically an average of the backward spillover effects through several release orders. One main difference is that if there were local time shocks, on this regression they will be diluted. This means that the accuracy in capturing the ATE in theory is higher here than before.
Moreover, overlapping time periods, and focusing on distance between release orders, allows for a higher number of observations, which further increases the accuracy of results. On the other hand, for higher release orders, which contain smaller observations, there is the possibility that only more successful firms survived in the market that far. This might skew the results, as it is more likely for successful firms to produce successful games, therefore being more prone to backward spillover effects due to signaling effect and overall positive perception of the brand.
On the other hand, it is expected that more successful firms achieve higher awareness in their products, which would imply that there are less consumers that have no knowledge of their already existing products. These two opposite effects are present the previous regression, and it seems that the former has a higher magnitude than the latter, however given the higher amount of observations for earlier release orders, these might be diluted.
3.4
Challenges to Identification
The main challenge to identification is that the release of the second game is not exogenous with respect to the first game. For example, if a developer releases a sequel to previous game, this is most likely the consequence of a long-term plan. In that sense, the ATE are not estimated consistently. However, my sample contains very few sequels, which suggests that the problem is not big.5 Moreover, there is also cause to believe that the release of the
second game is conditioned on some measure of performance of the second game, i.e., if the early game is a success. If this was true, it would be unlikely that I would observe a negative ATE in the weeks before the release of the second game.
A second challenge is related to bundling or discounts. As these games are sold on a platform, it is possible that the platform bundles the games together by developer and may offer a discount on the old game upon the release of the new game. In this case, the ATE is not consistent as the price, not the information spillover, is driving the result. However, it seems unlikely that it is driving all of it, otherwise the price would have been lower in the first place, assuming that the platform chooses prices optimally. Nevertheless, it would be important to account for bundles and discounts, which I cannot do in this sample.
However, in the case where the consumer had no knowledge about the previous product, the bundle may serve as well as an informational spillover, since it informs consumers about the new release as well as the previous one. Should the bundle be purchased, there is still backward spillover effects, independently of the price charged, given that the consumer will only purchase the bundle and not the individual new release due to backward spillover effects.
Steam is known for regularly having big sales, which follow a similar pattern every year, with small deviations in terms of dates. So it may be the case that some of the variation being captured is cause by local sales shocks rather than backward spillover effect. However, this is unlikely to happen throughout several release orders and even less likely in the adjacent games regression. Nevertheless, if it is the case it would invalidate the results, meaning that I’m only capturing the effect of the sale.
My outcome variable is a stock variable. In an ideal world, I would use the change in the number of owners to estimate the ATE. However, that data is very noisy and most likely suffers from measurement error. For example, there are several observations for which the number of new owners is negative, which means that individuals returned the game. This
5There are only 17 sequels in my dataset. I use the standard definition of sequel, which requires a coherent
is close to impossible, as Steam has a very strict return policy. Therefore, using a stock variable reduces the weight of each observation, which effectively dampens our estimation for the ATE, which can be then thought of as a lower bound. However, it also reduces the impact of the measurement error and, if that error is uncorrelated over time, may yield increasingly consistent estimates.
The sample also exhibits some measurement error, which is not just present in the number of owners. This measurement error does not seem to exhibit any discernible pattern, and I am therefore assuming it is random. In this case, a random measurement error will again imply dampening, i.e., my estimates for the ATE are being pushed towards zero.
There is also a concern that, even without using a stock variable, there is significant time dependence in games over time. The ideal approach to solve this problem would be to model this dependence explicitly using the method in Newey and West (1987). If there is time dependence, even though the ATE effects are not affected, the standard errors are not consistent. However, using this method involves the estimation of an additional vector of parameters, with limited power. Given the structure of the data, I find that clustering by developer, which accounts for variation within the developer, is a first order problem, and more important than addressing time dependence. Hence, in a choice between the two, I would prefer to cluster. Moreover, if the time dependence in the games is not very different within the developer, the combination of the developer fixed effect and the clustering already accounts for it.
4
Conclusion
Consumers do not have perfect information about products. Therefore, product discovery plays a key role, particularly in very dynamic markets which generate massive amounts of information. This creates a role for an information intermediary, such as a platform, that produces top charts or bestseller lists, that depend on popularity. This intermediary has a significant impact on the success of a product. In this situation, dominant firms who are able to sustain high levels of advertising, can augment their market power through presence in these lists. Moreover, product discovery on the part of consumers is also an important element for the success of a product.
In this thesis, I use a dataset of video-games to estimate the causal effect of the release of a new game on the performance of older games by the same company. Video-games are an
ideal market to study, as consumers often use platforms that aggregate information about the products. I find that, in the weeks before the release of a new game, the old game underperforms. I attribute this to a substitution effect - consumers are either postponing the purchase of the older game or they saving to purchase the new one. In the weeks that follow the release, there is a slow increase in performance for the old game, peaking at an average treatment effect of 20%, which then slowly decays. I take this as evidence of product discovery on the part of the consumers.
There are concerns that part of these results can be driven by a reaction in the pricing behavior of platforms, either through discounts on the older games or bundling. I cannot address these concerns directly due to data limitations but, even if they are true, they still suggest that the platforms internalize product discovery. Therefore, the effects I find are not causal, but still suggestive.
Overall, I find that the release of a new game serves as an advert for the old game. This advert is costly, both through the direct cost of a new game and through the negative effect in the old game in the period before the release, but effective. It remains to be seen whether this type of advertisement is persuasive or truth-telling.
References
Aguiar, Luis and Joel Waldfogel, "Platforms, promotion, and product discovery: Evi-dence from Spotify playlists", 2018
Bakos, J. Yannis, "Reducing buyer search costs: Implications for electronic marketplaces", Management Science, 1997, 43 (12), 1676-1692
Brynjolfsson, Erik, Yu Hu and Duncan SImester, "Goodbye Pareto principle, hello long tail: The effect of search costs on the concentration of product sales", Management Science, 2011, 57 (8), 1373-1386
Fleder, Daniel and Kartik Hosanagar, "Blockbuster culture’s next rise or fall: The impact of recommender systems on sales diversity", Management Science, 2009, 55 (5), 697-712
Goeree, Michelle S., "Limited information and advertising in the US personal computer industry", Econometrica, 2008, 76 (5), 1017-1074
Grossman, Gene M. and Carl Shapiro, "Informative advertising with differentiated product", Review of Economic Studies, 1985, 51 (1), 63-81
Hendricks, Ken and Alan T. Sorensen, "Information and the skewness of music sales", Journal of Political Economy, 2009, 117 (2), 324-369
Newey, Whitney and D. Kenneth West, "A simple, positive definite, heteroskedasticity and autocorrelation consistent covariance matrix", Econometrica, 1987, 55 (3), 703-708
Sorensen, Alan T., "Bestseller lists and product variety", Journal of Industrial Eco-nomics, 2007, 55 (4), 715-738
Appendix
FIGURE A.1. ATE for release of second game on first game
FIGURE A.3. ATE for release of third game on first game