MERGERS AND ACQUISTIONS:
THE CASE OF ZON MULTIMÉDIA AND SONAECOM
Ana Raquel Campelo Ferreira
Advisor: Peter Tsvetkov
Dissertation submitted in partial fulfillment of requirements for the degree of MSc in
Business Administration, at the Católica Lisbon School of Business & Economics
1 Ana Raquel Ferreira M&A: Zon and Sonaecom
ABSTRACT
The possible merger between Zon and Sonaecom is something that has been discussed on the market in the last years, and this dissertation aimed to make a thorough analysis of the companies and whether there is value creation with the completion of the merger.
The telecommunications market in Portugal is reaching a stage of maturity, and the country's economic situation together with the intense competition makes it difficult for companies to have a high organic growth. Instead, in recent years companies had results below expectations mainly due to lower private consumption that is taking place in the country, and its market value significantly devalued. Therefore, a merger between the companies would allow the rapid creation of value for Zon and Sonaecom’s shareholders because of both cost and revenue synergies, along with the fact that the merged company would become a stronger business and would be able to compete with the main competitor, Portugal Telecom.
Thus, according to the methodology explained in the literature review, I calculated the Sonaecom standalone value and the synergies from the merger, and the Sonaecom’s last closing price is found to be undervalued, with 5% upside potential, and synergies are estimated at around 131% of Sonaecom’s market capitalization1. It is therefore concluded that Zon must make a tender offer to Sonaecom offering a price of 1.21€ per share plus a premium that covers the total or partial value of synergies.
2 Ana Raquel Ferreira M&A: Zon and Sonaecom
ACKNOWLEDGMENTS
I would like to express my acknowledgments to Professor Peter Tsvetkov that gave me great support throughout this semester, and who I knew I could count on to clarify all my doubts, and that was always available. The professor also organized very well all the sessions, which motivated me to start and continue to work hard on the thesis until the end.
I would also like to thank to my partner Nuno Manuel Marques da Cunha de Almeida Mota who always supported me in all my decisions and in my university studies in the last five years, helping me to be more organized and persistent throughout the completion of the thesis. I must also thank my family for given me support in all my choices, for having patience with me in times of stress throughout the dissertation, and who I know I can always count for everything.
And I am especially grateful to my parents Jacinto Marques Ferreira and Beatriz Maria Oliveira Campelo Ferreira, for providing me everything I have today and for offering me the opportunity to study as much as I wanted.
3 Ana Raquel Ferreira M&A: Zon and Sonaecom
Table of Contents
1. INTRODUCTION ... 9
2. LITERATURE REVIEW ... 10
2.1. Types of Mergers & Acquisitions... 10
2.2. Factors to be taken into account when making a valuation ... 11
2.3. Valuation of the acquisition ... 12
2.3.1. Valuation Approaches ... 12
2.3.1.1. Discounted Cash Flow Valuation ... 13
2.3.1.1.1. WACC ... 13
2.3.1.1.2. Growth Rate ... 15
2.3.1.1.3. Equity Valuation ... 15
2.3.1.1.4. Firm Valuation ... 16
2.3.1.1.5. Adjusted Present Value ... 17
2.3.1.2. Multiples... 19 2.3.2. Premium ... 21 2.3.2.1. Value of Control ... 21 2.3.2.2. Synergies ... 22 2.3.2.2.1. Operating Synergies ... 22 2.3.2.2.2. Financial Synergies ... 22 2.3.2.2.3. Valuation of Synergies ... 23 2.4. Methods of Payment ... 23
3. COMPANY AND MARKET ANALYSIS ... 25
3.1. M&A in the telecom industry... 25
3.2. The Portuguese telecoms market ... 26
3.3. Sonaecom SGPS, SA ... 29 3.3.1. Capital Structure ... 32 3.3.2. Business Areas ... 32 3.3.2.1. Telco Business ... 32 3.3.2.2. SSI Business ... 34 3.4. ZON Multimédia SGPS, SA ... 36 3.4.1. Capital Structure ... 38 3.4.2. Business Areas ... 39 3.4.2.1. Triple Pay ... 39
4 Ana Raquel Ferreira M&A: Zon and Sonaecom
3.4.2.2. Cinema and Audiovisuals ... 40
4. STANDALONE VALUATIONS ... 42
4.1. Analysis of the Economic Environment in Portugal ... 42
4.2. Sonaecom’s Standalone Valuation ... 43
4.2.1. Cost of Capital ... 43
4.2.1.1. Financial Structure ... 43
4.2.1.2. Cost of Debt ... 44
4.2.1.3. Cost of Equity ... 44
4.2.3. Free Cash Flow to the Firm ... 45
4.2.3.1. Mobile ... 46
4.2.3.2. Fixed ... 47
4.2.3.3. SSI ... 48
4.2.3.4. Media ... 49
4.2.3.5. Depreciation and Capital Expenditures ... 50
4.2.3.6. Working Capital ... 51
4.2.4. Firm Valuation with WACC ... 52
4.2.5. Adjusted Present Value ... 52
4.2.6. Multiples ... 53
4.3. Zon’s Standalone Valuation ... 55
4.3.1. Cost of Capital ... 55
4.3.1.1. Financial Structure ... 55
4.3.1.2. Cost of Debt ... 55
4.3.1.3. Cost of Equity ... 56
4.3.2. Free Cash Flow to the Firm ... 57
4.3.2.1. Triple Pay ... 57
4.3.2.2. Cinema and Audiovisuals ... 59
4.3.2.3. EBITDA Margin ... 60
4.3.2.4. Depreciation and Capital Expenditures ... 60
4.3.2.5. Working Capital ... 61
4.3.3. Firm Valuation with WACC ... 62
4.3.4. Adjusted Present Value ... 62
4.3.5. Multiples ... 63
5. MERGED COMPANY VALUATION ... 65
5 Ana Raquel Ferreira M&A: Zon and Sonaecom
5.1.1. Cost of Capital ... 65
5.1.2. Firm Valuation with WACC ... 66
5.1.3. Adjusted Present Value ... 66
5.2. Merged Company Valuation - With Synergies ... 66
5.2.1. Synergies ... 66
5.2.1.1. Revenue Synergies ... 67
5.2.1.2. Cost Synergies ... 68
5.2.1.3. Costs of Merger ... 69
5.2.2. Cost of Capital ... 70
5.2.3. Firm Valuation with WACC ... 70
5.2.4. Adjusted Present Value ... 71
6. ACQUISITION... 72
6.1. Price and Method of Payment ... 72
6.2. Portuguese Competition Authority ... 73
7. CONCLUSION ... 74
8. APPENDIXES ... 75
9. BIBLIOGRAPHY ... 88
6 Ana Raquel Ferreira M&A: Zon and Sonaecom
List of Appendixes
Appendix 1: Portuguese Government Bonds 10 Yr ... 75
Appendix 2: Default spread by credit rating ... 75
Appendix 3: Estimation of Risk Premium ... 76
Appendix 4: Sonaecom's Cost of Capital ... 76
Appendix 5: Sonaecom - FCFF ... 77
Appendix 6: Sonaecom - Forecast of the Mobile Segment ... 77
Appendix 7: Sonaecom - Forecast of the Fixed Segment ... 78
Appendix 8: Sonaecom - Firm Valuation with WACC... 78
Appendix 9: Sonaecom - Adjusted Present Value ... 79
Appendix 10: Zon's Cost of Capital ... 80
Appendix 11: ZON - FCFF ... 81
Appendix 12: ZON - Forecast of the Triple Play ... 81
Appendix 13: ZON - Firm Valuation with WACC ... 81
Appendix 14: ZON - Adjusted Present Value ... 82
Appendix 15: Merged Company (no synergies)'s Cost of Capital ... 83
Appendix 16: Merged Company (no synergies) - Firm Valuation with WACC ... 83
Appendix 17: Merged Company (no synergies) - Adjusted Present Value ... 84
Appendix 18: Revenues and Costs reductions and Costs of Merger ... 84
Appendix 19: Sonaecom Fixed Costs and Costs Synergies ... 85
Appendix 20: Part of Sonaecom's Financial Statement and Costs Synergies ... 85
Appendix 21: Value of fees, according to the Lehman Formula... 85
Appendix 22: Merged Company (with synergies)'s Cost of Capital ... 86
Appendix 23: Merged Company (with synergies) - Firm Valuation with WACC ... 86
7 Ana Raquel Ferreira M&A: Zon and Sonaecom
List of Tables
Table 1: Sonaecom's Operational KPIs from Mobile Segment ... 33
Table 2: Zon's Operational KPIs from Triple Pay Segment ... 39
Table 3: Portugal's GDP ... 43
Table 4: Sonaecom's Peer Group ... 53
Table 5: Enterprise Value calculated using the EV/EBIT multiple ... 54
Table 6: Zon's Subscribers ... 57
Table 7: Zon Business Indicators - Pay TV ... 58
Table 8: Zon's Peer Group ... 63
8 Ana Raquel Ferreira M&A: Zon and Sonaecom
List of Figures
Figure 1: M&A activity in the last 10 years in telecom (SOURCE: Dealogic) ... 25
Figure 2: Portuguese Telecommunications Market ... 27
Figure 3: Market Growth Rates (%) ... 27
Figure 4: Penetration Rate (%) ... 28
Figure 5: Telecommunications Market Share in Users ... 28
Figure 6: Zon and Sonaecom's Closing Price (last 6 months) ... 29
Figure 7: Sonaecom - Breakdown of Revenue... 30
Figure 8: Sonaecom Performance... 30
Figure 10: Sonaecom - Operating Costs ... 31
Figure 9: EBITDA/Revenues (%) ... 31
Figure 11: Sonaecom Shareholding Structure ... 32
Figure 12: Mobile: Optimus Market Share ... 33
Figure 13: Growth of Mobile Subscribers (y.o.y.) ... 33
Figure 14: Wireline: Total Accesses (EOP) ... 34
Figure 15: SSI Total Revenues ... 35
Figure 16: Zon - Breakdown of Revenue ... 36
Figure 17: Zon Performance ... 37
Figure 19: Growth rates and EBITDA/Revenues ... 37
Figure 18: Zon Operating Costs ... 37
Figure 20: Zon Shareholding Structure ... 38
Figure 21: Market Share of Cinema Distribution Revenues - 2011 (%) ... 40
Figure 22: Sonaecom's Depreciation ... 50
Figure 23: Distribution of Operating CAPEX by segments... 51
9 Ana Raquel Ferreira M&A: Zon and Sonaecom
1. INTRODUCTION
The aim of my thesis is to examine the possible merger of Zon and Sonaecom, and whether it creates value for both companies’ shareholders. In order to do this, the dissertation was divided into several key points.
The first section is the literature review, where it was made an analysis of the existing academic literature about valuation approaches and what points should be taken into account in a merger and acquisition operation.
In the following section there is an analysis of the M&A telecom industry, and the situation of the Portuguese telecom market. Then it is analyzed the situation of Zon and Sonaecom in recent years and their goals for the future.
The third section is intended for a standalone valuation of both companies, but before the valuation is made an introduction regarding the economic environment in Portugal.
Then there is a section devoted to the valuation of the merged company, where it is first performed a valuation of the merged company without synergies, and then a valuation with synergies. Lastly, it is considered if the acquisition should be made or not, how much to pay and how to pay it.
10 Ana Raquel Ferreira M&A: Zon and Sonaecom
2. LITERATURE REVIEW
For years companies have been making mergers and acquisitions, and quite a few studies have shown that these transactions create value for its shareholders with the largest gains occurring in the acquired company (Andrade, Mitchell, and Stafford – 2001). More specifically, studies such as Devos, Kadapakkam and Krishnamurthy (2009) and Houston, James, and Ryngaert (2001) have found that the average gains from mergers are around 10%. However, more than a simple investment, these operations allow companies to make a shortcut to their strategic objectives, but before proceeding with an acquisition it is necessary to find whether the combined company after the merger will be more valuable than the sum of both companies and from where the creation of value comes. According to Andrade, Mitchell, and Stafford (2001) this creation of value can result from several sources such as synergies due to efficiency reasons, like economies of scale; creation of market power, resultant from the creation of an oligopoly, however this possibility has become more difficult since the 1940s due to antitrust laws; improvement of the management of the acquired company, thereby making it more efficient; and in order to diversify the company. Damodaran (2002) also refers that this decision may be made without taking into account the shareholders wealth maximization, but managerial self-interest, and therefore instead of creating opportunities for the company, may even destroy value.
There are various types of acquisitions and all of them can result in very good investments and enable the company to reach its goals faster because it can boost the expansion of the business and create several sources of returns, assuming that the valuations are well made. In order to facilitate the understanding and make clear the procedures which are required when making an acquisition, this literature review is divided into four main sections: types of mergers and acquisitions, factors to be taken into account when making a valuation, valuation of the acquisition and methods of payment.
2.1. Types of Mergers & Acquisitions
According to Damodaran (2002) there are several types of mergers and acquisitions, differing from each other in the way of how both companies reach an agreement, the percentage of the target company that is acquired and how is the company resulting from this operation.
When one company acquires another this may be a merger if the board of directors of both companies reached an agreement to combine them, and if most of the
11 Ana Raquel Ferreira M&A: Zon and Sonaecom
shareholders have agreed with the decision, being the result of this operation the end of the target company since it will be fully incorporated in the acquiring company; It is a consolidation if the merger of both companies results in a new company owned
by shareholders of both companies that have joined;
It is a tender offer the acquiring company makes an offer directly to shareholders and the managers and board of directors of both companies do not reach an agreement, thus the merger will happen if the shareholders sell their shares to the acquiring company (this method is used to make hostile takeovers);
It can also be an acquisition of assets, when the company simply buys assets from another (there is still needed an approval by votes from shareholders).
Lastly, another form of acquisition is a buyout and occurs when the management of the company or outside investors acquires the company through a tender offer, thus the target company will no longer be a publicly traded and will become again a private company.
Of all these types of acquisitions, according to Loughran and Vijh (1997) the one that has a greater postacquisition wealth gains is the tender offer, however according to Travlos (1987) the explanation for this to happen may be due to the fact that this type of acquisition usually uses cash offers as method of financing.
Brealey, Myers, and Allen (2008) suggest a different way to divide the types of acquisitions as horizontal, vertical and conglomerate merger. When the acquisition occurs between companies that belong to the same industry is known as horizontal merger, and if it is between companies at different stages of production, such as client-supplier, is knows as vertical merger. Finally, the operation is classified as conglomerate merger if involves companies from unrelated business.
2.2. Factors to be taken into account when making a valuation
By proceeding with a valuation, in order to avoid errors, it is important to try to understand why the market is very skeptical about the value created by acquisitions and Sirower and Sahni (2006) suggest that this is because an acquisition requires a full payment upfront, and if the company had invested in other areas instead, such as R&D, the payment would be made in different phases and thus with a lower risk; the authors also refer that synergies only occur when the new company can overcome the performance that was already expected for the companies separately, and often in the calculation of synergies it is considered a certain
12 Ana Raquel Ferreira M&A: Zon and Sonaecom
performance improvement that was already expected, which leads to errors; furthermore, no synergy is free and it is necessary to incur in costs to achieve it, and finally once an acquisition goes wrong, if the integration was already started it will be very expensive to cancel it. Thus, when making a valuation, these points should be considered to transmit a good image to the market.
Lastly, another point that it would also be interesting to check would be to verify why some acquisitions are successful and others not and what are the long-term effects resulting from a merger, but the studies that were conducted on this issue do not have much to say (Andrade, Mitchell, and Stafford – 2001). Therefore, the specific situation of each company must be taken into account when an acquisition is being considered, the managers should not be carried away by the enthusiasm of the acquisition and overestimate the value that result from it, and should be very critical in order to make a rigorous analysis and as true as possible.
2.3. Valuation of the acquisition
In order to decide how much to pay for a company when making an acquisition it is necessary to value the target company and the value created that will result from the operation. One of the most common ways to compute the value of the final company is by calculating the value of both companies separately, the value of synergies that will occur after the merger and the value created due to better management and improvement of the acquired company in terms of efficiency (Damodaran – 2005).
2.3.1. Valuation Approaches
Understanding the process of valuation is an important prerequisite for those who want to have an important role in resource allocation decisions of a company (Luehrman 1997a). For instance, this process is essential not only for the acquirer but also for the target firm. The first will have to make a valuation of the target firm in order to know how much it will be the initial offer. On the other hand, the target firm will also have to make a valuation of itself in order to know how much it’s worth and decide if it should accept or reject the offer (Damodaran – 2002).
There are several methods that can be used to value a company, and the opinions vary regarding which method is the best. Discounted cash flows methodology is the one chosen and
13 Ana Raquel Ferreira M&A: Zon and Sonaecom
used by the academics over the past 20 years (Luehrman 1997b). However, by using both discounted cash flows and relative valuation the results will be more complete (Kaplan & Ruback 1996).
2.3.1.1. Discounted Cash Flow Valuation
When using a discounted cash flows methodology it is necessary to predict the future value of cash flows and then discount them to the present, using a discounting rate that will represent their riskiness (Luehrman 1997b). However, there are different ways to execute the valuation. The discounted cash flows methodology using the weighted average cost of capital (WACC) has a discounting rate that has been used in the last years as the standard version, but nowadays the adjusted present value (APV) is viewed from many as the best methodology (Luehrman 1997a).
2.3.1.1.1. WACC
The WACC is estimated as the weighted average of the cost of debt and the cost of equity, being the combination called as the weighted average cost of capital (Brealey, Myers, and Allen - 2008). Since this discounting rate has to represent the level of risk of the cash flows (Luehrman 1997b), it has to be adjusted to reflect the value that results from the financing program. As a result, to calculate the cost of capital it is needed both the cost of equity and cost of debt, as well as the weight of debt and equity in the company.
According to Brealey, Myers, and Allen (2008), the formula for estimating the after-tax weighted average cost of capital is the weighted average of after-tax cost of each source of capital:
WACC = rD(1 – Tc) + rE
Where the D and E are the market values of debt and equity, and V is the total market value of the firm. The rD and rE are the costs of debt and equity, and Tc is the marginal tax rate.
- Cost of Equity
The cost of equity is the expected rate of return to investors and the capital asset price model, or CAPM, is the standard model to measure it (Brealey, Myers, and Allen - 2008). According to
14 Ana Raquel Ferreira M&A: Zon and Sonaecom
Damodaran (2002), the model assumes that there are no transaction costs and that all the investors have access to the same information. Because of that, all the investors are diversified by holding a market portfolio, not being exposed to the firm specific risk. Thus, it will be measured the rate of return that diversified investors demand to put money into the firm. Concerning the capital asset price model, according to Booth (1999) the cost of equity will be primarily determined by the estimation of the appropriate risk-free rate and the risk premium, and lastly the equity risk premium will be adjusted for the particular risk of the firm. Then, the cost of equity can be calculated by using the next formula:
kj = rF + j*(E(re) – rf)
Where the kj is the required return to investors, the rF is the risk-free rate and the value that is
used in most equity discount rates calculations is the Long-term Treasury Bond yields (Booth - 1999). The risk premium will be the difference between the expected return of the market (E(re)) and the risk-free rate, and the most used estimation of the risk premium is comparing the returns on stocks over a long time period with the returns earned on a default-free asset, and the difference among the two returns will represent the historical risk premium (Damodaran - 2002). However, according to the same author, another way to calculate the risk premium is to add the adjusted country risk premium (that is estimated by multiplying the default spread according to the specific country’s rating, by 1,52) with the historical risk premium for a mature equity market. Lastly, the j is the firm’s beta coefficient that represents
the non-diversified risk and it is estimated by the slope coefficient of the regression between past returns of the firm and the market (Bruner, Eades, Harris and Higgins – 1998).
- Cost of Debt
In addition to obtaining money through equity investors, the company is also financed through lenders. These last lend money to the company and expect to get a certain return, represented by the cost of debt. This rate is determined by the risk-free rate plus the default-risk of the company, thus the cost of borrowing money will increase as the riskless rate and the default-risk increases (Damodaran - 2002).
15 Ana Raquel Ferreira M&A: Zon and Sonaecom
2.3.1.1.2. Growth Rate
According to Damodaran (2002) the growth rate can be estimated in three ways: (1) by looking at the historical earnings and analyze how it has developed, however this method does not become suitable for the case of a company that does not have stable results, and this happens with the companies that are being analyzed, which in recent years showed considerable variations in the results. (2) a second way is by using the estimations of the equity research analysts, and if these values are trustworthy it can be a good estimation of the growth rate, as the analysts have been following and analyzing the firm for a long period of time. (2) Lastly, by estimating the growth from firm’s fundamentals, determined by the return on investment (ROC) and the reinvestment rate3. Although those determinants can remain stable for most businesses, for high growth firms the estimation of those values can be challenging.
Regarding the estimation of the evolution that cash flows will have in the long term it is needed to calculate the terminal growth rate, and according to Kaplan and Ruback (1996) the terminal growth rate should reflect both expected real growth and inflation growth. Thus, the latter method of calculating this rate will be used to obtain the terminal value during the valuation.
2.3.1.1.3. Equity Valuation
According to Damodaran (2002), the equity valuation model discounts the expected free cash flows to the equity (that are what result after the firm meets “all expenses, reinvestment needs, tax obligations and net debt payments”), using a discounting rate that represents the rate of return required by the equity owners, i.e., the cost of equity.
Damodaran (2002) states that in this method it is necessary to calculate the forecasted values of FCFE by subtracting the Net Capital Expenditure, Change in Net Working Capital and Debt Repayment to the Net Income, and finally by adding the value of New Debt4; and also the cost of equity in order to calculate de value of equity.
n E E n n i i E i k g k FCFE k FCFE ) 1 ( 1 * ) ( ) 1 ( Equity of Value 1 1
3Growth rate = ROC * Reinvestment rate
4 FCFE = Net Income - Net Capital Expenditure - Change in Net Working Capital + New Debt - Debt
16 Ana Raquel Ferreira M&A: Zon and Sonaecom
- Limitations
According to Copeland, Koller and Murrin (2000) this method is very simple in theory but it will present many difficulties in its practical application. Firstly, when performing these calculations it is only obtained the equity value of a company, instead of the enterprise value. Thus, does not take into account the debt and its positive and negative effects. The same authors also reported that this method of discounting cash flows to the equity is less transparent regarding sources of value created and it is not useful in identifying opportunities to create value to the company.
2.3.1.1.4. Firm Valuation
The firm valuation model values the equity as the value of a firm's operations less the value of debt and other investor claims that are superior to common equity (Copeland, Koller and Murrin – 2000). Thus, according to Damodaran (2002), the future cash flows to the firm will be obtained after the firm meets all its “operating expenses, reinvestment needs and taxes”, and before payments to equity holders and debt.
In this method it is used the forecasted values of FCFF that are calculated by subtracting the Taxes, Depreciation, Changes in Net Working Capital and Capital Expenditures to the value of EBIT5; and it is also used the weighted cost of capital in order to calculate de value of the firm (Damodaran – 2002): n n n i i i
WACC
g
WACC
FCFF
WACC
FCFF
)
1
(
1
*
)
(
)
1
(
Value
Enterprise
1 1
- Limitations
According to Luehrman (1997b) this version of discounted cash flow valuation became the standard since 1970s, however nowadays this method is considered by many authors as outdated since there is a wide range of technology and information available and consequently other valuations methods became better, cheaper and easy to use. Regarding this methodology, there is a simplification that is made when the weighted average cost of capital is being calculated that assumes a constant financial leverage until perpetuity when calculating
17 Ana Raquel Ferreira M&A: Zon and Sonaecom
the terminal value, thus if the capital structure is expected to change the result of the valuation will not be longer correct since the cash flows should be discounted at a different discounting rate (Brealey, Myers, and Allen – 2008). Luehrman (1997a) also refers another pitfall of using this method concerning the valuation of the financial effects since it only addresses tax effects, not taking into account other possible effects.
2.3.1.1.5. Adjusted Present Value
The Adjusted Present Value methodology appeared about 20 years ago as an alternative to the use of the WACC as the discount rate (Luehrman – 1997b). At that time the several components that needed to be calculated by the APV made the method expensive to be used. However nowadays, due to technological developments, that extra informative component is very inexpensive (Luehrman – 1997a).
This approach is view for many as a more transparent and versatile method since it allows to easily see the various sources of value and also to tailor the analysis. For instance, the valuation can be more specific where it makes more sense for a specific industry (Luehrman – 1997a). Moreover, it has the advantage of being more useful in valuing companies that do not have a constant level of leverage, and the same does not happen in WACC which assumes a fixed capital structure for calculating the discount rate (Copeland, Koller and Murrin – 2000). In this approach the valuation will have several steps. Firstly will be calculated the value of the company without debt. Subsequently, as the debt is added, it will have to be considered both positive and negative effects that the leverage will bring to the firm (Damodaran – 2002). On the positive side it will be considered interest tax shields resulting from the reduction of the taxable income by the amount of the interest, which will reduce the tax amount to be paid by the company (Luehrman – 1997a). Moreover, the bankruptcy costs should also be considered in this valuation as a negative effect of the financing program, this happens because the more indebted a company is, the higher will be the risk of bankruptcy (Damodaran – 2002).
- Unlevered Firm Valuation
The first step will be to forecast the Free Cash Flows to the Firm and then discount all those cash flows to their present value using the unlevered cost of equity as the discounting rate (Luehrman – 1997a) and it also has to be considered the growth rate in case there is a steady growth of cash flows until perpetuity (Damodaran – 2002).
18 Ana Raquel Ferreira M&A: Zon and Sonaecom
n unlevered E unlevered E n n i i unlevered E i k g k FCFF k FCFF ) 1 ( 1 * ) ( ) 1 ( Firm Unlevered of Value 1 1
Where FCFF is the Free Cash Flow to the Firm, kE unlevered is the unlevered cost of equity and g is
the expected terminal growth rate (Damodaran – 2002). In order to proceed with the valuation it is necessary to estimate the unlevered cost of equity. It was seen before how to estimate the cost of equity, however was being used the current equity beta of the firm and in this point it will be need the unlevered beta,
E D
t)
1
(
1
levered unlevered
Where βunlevered and βlevered are respectively the unlevered and levered equity beta of the firm, t
is the tax rate for the firm and D/E is the current debt/equity ratio (Damodaran – 2002).
- Expected Interest Tax Shields
The next step will be the calculation of the interest tax shields that result from a certain level of debt and in this calculation it will be used the tax rate and the interests that the company pays, being discounted at a rate that represents the risk of these cash flows (Damodaran – 2002). However, academics do not agree on the rate that should be used to discount the interest tax shields. Some argue that the discount rate to be used should be higher than the cost of debt since the managers will adjust the level of debt as the company's performance change, and this will result in fluctuation of the level of debt depending on how the operating results will fluctuate (Luehrman – 1997a). On the other hand, Miles and Ezzell (1985) propose discounting the tax savings in the first year at the cost of debt and the following years at rA,
thus the correct formula for the Terminal Value of Tax Shields with a perpetuity growing at a rate g would be:
)
1
)(
(
)
1
(
)
(
D A A T DK
g
K
K
D
tK
TS
TV
Nevertheless, most academics such as Damodaran (2002), Brealey, Myers, and Allen (2008), Modigliani and Miller (1963) and Myers (1974) propose that the cost of debt should be used assuming that tax shields have a similar risk to debt, so the Present Value of the Tax Shields will be:
19 Ana Raquel Ferreira M&A: Zon and Sonaecom
c D c D
D
T
K
T
K
D
*
*
*
Shields
Tax
the
of
Value
Present
- Costs of Financial Distress and Net Effect
According to Damodaran (2002), when a company has a certain level of debt, there is a risk of default that results from the probability that a company will be unable to pay the debt. If this happens the company will incur in costs of financial distress. In order to calculate the present value of those costs it is used the following formula, where default is the default probability:
Costs of Financial Distress = default*(Value of the unlevered firm)*%loss
According to Korteweg (2007), the percentage of loss of the firm value in case of financial distress is 18,5% for the telecom industry, and the default spread will be related with the rating of the company. Thus, after calculating the CFD for each year, it will be discounted at the cost of debt (the same as tax shields).
- Limitations
According to Luehrman (1997a) this is a very versatile and transparent methodology but it has some limitations, one of them is related with the inability to adapt this discounted cash flow methodology to valuing projects that are essentially options. Another fact that the author point out is the difficulty in estimating the costs of financial distress, and if this value is not well calculated the firm value will be overvalued, especially if it has considerable high debt ratios (Damodaran - 2002).
2.3.1.2. Multiples
The method of relative valuation is based on how similar are the assets that are listed in the market (Damodaran - 2002), and the result of this valuation will be directly proportional to future payoffs and inversely proportional to risk (Liu and Thomas – 2000). Therefore, Liu and Thomas (2000) suggest that this method can be a substitute for comprehensive valuations since it has the same essence, or that can also be used as a complement for those comprehensive valuations, by helping to calibrate them and to obtain terminal values. This last suggestion is also made by Kaplan and Ruback (1996) that after their study of the valuation of 51 HLTs found that although discounted cash flows methods perform better than relative
20 Ana Raquel Ferreira M&A: Zon and Sonaecom
valuation, suggest that both methods should be used in order to have extra explanatory power in the estimations.
According to Kaplan and Ruback (1996) the firms’ value is calculated by multiplying a specific multiple by the performance measure for the company to be valued, however it is essential to make the assumption that on one hand it is assumed that the comparable companies will have the same expected growth rate and level of risk for their cash flows as the company being valued has, and on the other hand that the changes in value of the company and the changes in the performance measure will vary in the same proportions. Damodaran (2002) also suggests that the prices of the companies should be converted into multiples of earnings, book values or sales in order to standardized prices.
- Different comparables
There are several multiples that are used in relative valuation, it can be multiples using earnings, book values or revenues, for example. According to Damodaran (2002), the earnings multiple is very intuitive since the price/earnings ratio will result in how much earnings it is expected per share, however when the multiple is being used in order to analyze the value of a company that will be acquired, it is better to use EBITDA instead of earnings. Another multiple that Damodaran (2002) refers is the relationship between the market value and book value of equity, and this multiple is mostly used to analyze if the stock is well valued. However, it may not be good for making analyzes between different industries since it is related with the expected growth and projects available for a company in a specific industry. Lastly, since several multiples are very influenced by accounting rules, this link will be much smaller by using a ratio such as price/sales, and may be beneficial to compare companies that are in countries with different accounting rules. However, Liu and Thomas (2000) suggest that multiples with sales are those with a worse performance in their study. Furthermore, some academics (Damodaran – 2002) suggest that it should be used some multiples that would be specific to certain industries, but Liu and Thomas (2000)do not agree that among different industries it would be better to use different multiples since in their study the best multiples are consistently the same for different industries.
-
Limitations
In this methodology it is very important to have a group of comparable firms that are very similar, and a limitation that Kaplan and Ruback (1996) refer is the fact that it is impossible to
21 Ana Raquel Ferreira M&A: Zon and Sonaecom
have a comparable set of companies that are perfect matches in order to use multiples. Because of this problem Goedhart, Koller and Wessels (2005) suggest to use peers with similar prospects for ROIC and growth in order to minimize the differences among companies and to have similar perspectives of growth and investments for them to be compared. Another limitation is the fact that there is no measure of performance that it is considered the best among all the others, thus the choice of the multiple to use is not obvious (Kaplan and Ruback - 1996). Lastly, Damodaran (2002) also suggests that because this method represents the expectations of the market it can be influenced with some speculations and furthermore it also refers the fact that the method can be subject to some manipulation because it is not very transparent.
2.3.2. Premium
When there is an acquisition there will be a value creation which is why in order to increase the wealth of its shareholders, the acquiring company makes a bid to buy another company. Thus, the price to be paid for the target company is not only its value but that value plus a premium, so it is necessary to calculate that difference in order to decide what premium must be paid.
This premium may result through improved management of the acquired company in order to become more efficient (Value of Control), increased market power or from the synergies that will result from the merger between the two companies (Andrade, Mitchell, and Stafford - 2001). However, it is very important to calculate these values separately to avoid any double counting (Damodaran – 2005).
2.3.2.1. Value of Control
According to Damodaran (2005), the value of control occurs when the target company is being mismanaged and it is not being as efficient as possible, so there is potential to create value by improving these aspects. However, this improvement could be held without the target being acquired and because of that, it is acceptable to offer 100% of the value of control as premium. The author also suggests that the value of control should be found by calculating the value of the acquired company assuming a better management and all the improvements minus the status quo (valuation of the target with the same management).
22 Ana Raquel Ferreira M&A: Zon and Sonaecom
2.3.2.2. Synergies
Synergies are usually the main justification of the acquiring company to proceed with an acquisition and result from the value that is created by merging two companies that would not be created if they were independent from each other. Synergies may arise from various sources and according to Damodaran (2005) and Devos, Kadapakkam and Krishnamurthy (2009) the most common way to divide them is by categorizing as operating and financial synergies. However, these sources of value creation for the company are often overvalued by analysts (Damodaran – 2005), and managers also tend to give a greater value to it due to the enthusiasm resulting from the acquisition, thus the correct valuation of synergies becomes a focal point in order not to pay a premium above the one that is really created. Therefore, corporate boards should always check whether there are sufficient procedures to avoid criminal activity by management and if the data given to shareholders represent the true state of business (Sirower and Sahni – 2006).
2.3.2.2.1. Operating Synergies
This type of synergies result from changes that occur in cash flows that are related with operations (Devos, Kadapakkam and Krishnamurthy - 2009) and according to Damodaran (2005) it can be created through economies of scale that occur mostly in companies from the same sector since it will allow the company to be more cost-efficient and profitable by joining the assets of both companies and create a production with a larger scale; additional pricing power resulting from a less significant competition and higher market share, also more likely in horizontal mergers; a higher potential to grow that occur, for example, when acquiring a company in an emerging market; or due to combination of functional strengths among both companies.
2.3.2.2.2. Financial Synergies
According to Damodaran (2005) these synergies arise when there is an increase in cash flows or a decrease in the discount rate, and it can result from tax benefits that can occur, for example when a company acquires another that is losing money; diversification, although this point does not have much consensus among academics, and the markets seem to not believe in creating value through diversification; higher debt capacity since the cash flows of both companies are not perfectly correlated resulting in a lower risk; or uses of excess cash and this
23 Ana Raquel Ferreira M&A: Zon and Sonaecom
happens, for example, when a company that does not have investment opportunities and has excess cash purchases another that has many investment opportunities.
2.3.2.2.3. Valuation of Synergies
Damodaran (2005) suggests that synergies should be valued by using the discounted cash flows approach by first valuing both companies and then find the value of synergies by changing different inputs depending from where the synergy to be valued manifests itself. For example, if the company has cost savings the costs account will be smaller and consequently it will result in higher cash flows. However, it is necessary to have some tact to estimate synergies, since there is synergies that can be calculated in a controlled manner as is the case with cost synergies, but on the other hand there are others such as growth synergies, that will put a higher growth rate in calculations and that must be limited to the skepticism of who is calculating it.
- Limitations
The limitation that is most obvious is that it is difficult to estimate the value of synergies that are created with an acquisition. Several values are estimated, which makes the calculation prone to error, and it is also easier to generate synergy theoretically than in practice. Consequently, according to Damodaran (2005) the limitations of the synergies are due to common errors incurred by analysts that are making the valuation such as subsidizing target firm shareholders by offering a premium higher than they deserve since shareholders do not play any role in the value creation resulting from the synergies, and therefore the acquiring company must keep part of that increased value; the use of an incorrect discount rate also results in synergies being miscalculated; another common mistake is to confuse the value of control and the synergies, and the best way to avoid this error is by assess both values separately as mentioned above. Sirower and Sahni (2006) also suggests that synergies are not free and it is necessary to incur in costs to achieve them, and those costs are never considered during the valuation.
2.4. Methods of Payment
After making the valuation of the acquisition becomes necessary to decide how the acquiring company will pay for it. There are two main ways to finance an acquisition, either through a
24 Ana Raquel Ferreira M&A: Zon and Sonaecom
cash offer or a common stock exchange offer. But these two methods are seen differently by the market due to the existence of asymmetric information, so Sirower and Sahni (2006), Travlos (1987), Loughran and Vijh (1997) and many other authors have conclude that cash deals outperform stock deals.
It is observed that cash offers usually occur in tender offers (Travlos – 1987) and that are less common to occur - on average only represent 12% of all deals (Sirower and Sahni – 2006). The choice for this method of payment is because the acquirer’s managers will decide to pay the acquisition in way that results in a higher profitability for its shareholders (Travlos - 1987), so it is expected that they will make cash offers when the stocks are overvalued (Loughran and Vijh - 1997). Moreover, common stock exchange offers usually occur in mergers and, for the same reasons, the managers will choose this method when they believe that stocks are undervalued (Travlos – 1987).
Travlos (1987) suggest that if the market receives a common stock exchange offer to an acquisition as bad news and a cash offer as good news, this will have an impact on the value of the stock of the acquiring company. So, the change in value of the company after the acquisition will not only reflect the creation of value through the acquisition but also the reaction that the market had to the method of payment. Therefore, as the market has a good reaction to cash offers and since the majority of tender offers are financed with cash, this will result in greater gains for acquisitions through tender offers.
Furthermore, these two payment methods have different policies regarding taxes. On the one hand, with a cash offer the company will pay taxes but will also be able to increase the depreciation basis of assets acquired, resulting in a higher acquisition price; on the other hand with a common stock exchange offer the company will not need to pay taxes but the depreciation basis of the new assets will also remain the same. Thus it is not clear whether the benefit resulting from the good reaction of the market to a cash offer will be greater than the extra taxes that will have to be paid (Travlos - 1987).
25 Ana Raquel Ferreira M&A: Zon and Sonaecom
3. COMPANY AND MARKET ANALYSIS
3.1. M&A in the telecom industry
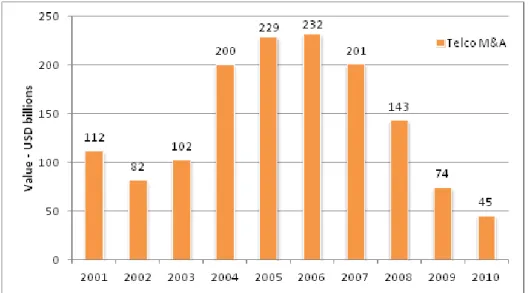
Mergers and acquisitions deals have always been very significant in the telecommunications industry, and by 2008 this industry was in the midst of a wave of such businesses, since the operators were looking for inorganic growth, but in recent years these operations decreased a lot (Sabbagh, Goussous and Mastoras – 2011). According to Lebraud and Karlströmer (2011), besides the decrease in the number of transactions, is also observed a greater share of transactions in emerging markets. From 2001 to 2006 most of the business occurred in Europe and North America, while from 2007 to 2010 emerging markets began to perform more of this type of business and started to generate roughly half of total activity in value terms (whereas from 2001 to 2006 generated less than a quarter of the total activity).
Figure 1: M&A activity in the last 10 years in telecom (SOURCE: Dealogic)
In recent years there have been changes in the nature of transactions in this industry. Firstly, cross-border M&A deals in the core business area6 have decreased, and a possible factor for this to happen is the slowdown in subscriber growth across the world, so it became less interesting to carry out many cross-border deals. Second, during the past 5 years adjacent7 segment deals have been increasing in value (and now represent about half of the number of deals made by operators), one possible reason why this could occur is the choice of telcos to
6
Voice, Broadband, Internet, Network Equipment and Infrastructure. 7 ICT, Multimedia and Financial Services.
26 Ana Raquel Ferreira M&A: Zon and Sonaecom
explore growth outside of their core operations. Finally, deals that occur within the same country continue to be higher, both in number and value, than the cross-border M&A, this highlights the value telecom players have on their countries' markets, and also may indicate that managers are taking into account that the home environment is more conducive to capture synergies. (Lebraud and Karlströmer - 2011)
Lebraud and Karlströmer (2011) also believe that there are three key points that will determine the future of mergers and acquisitions deals in the telecommunications industry: if operators are eligible to gain scale benefits and if they can reach those gains in a cross-border basis; the amount of consolidation that regulators will allow within each country; and if the operators will decide to expand into non-core areas.
In the case of Portugal, to study the possibility of a M&A deal, it must be taken into account whether regulators will allow a merger between two major players in the market, and analyse if the current situation of the country together with the little confidence in the markets will allow to proceed with this operation.
3.2. The Portuguese telecoms market
In recent years several sectors have been affected by serious macroeconomic conditions, particularly the European sovereign debt crisis, that has deteriorated over the year 2011 with the worsening situation in Greece. In the specific case of Portugal, due to austerity measures in force, associated with restrictions on access to credit and high unemployment, it is expected a decrease in private consumption in 2012 (Table 3), which makes the macroeconomic environment very challenging and uncertain.
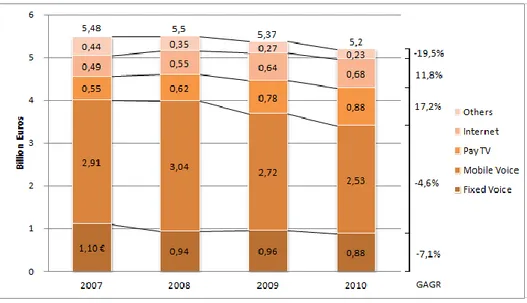
According to Anacom8, in Portugal the telecommunications sector had revenues of 5.2 billion euros9 in 2010 (a decrease of 3,2% compared to 2009), representing 4,4% as percentage of GDP (decreased since in 2009 since the total sector revenues as a percentage of GDP was 4.49%).
8 ANACOM makes the regulation, supervision and representation of the communications sector.
9
27 Ana Raquel Ferreira M&A: Zon and Sonaecom
Figure 2: Portuguese Telecommunications Market
The various telecommunications businesses are the fixed voice, mobile voice, pay TV, internet, and others, and within those, mobile voice is the one with higher revenues, followed by fixed voice and pay television. According to the data, in 2010 there was a decrease in voice revenues but the market for pay television and internet increased.
Although this market has shown growth in previous years, 2010 was not favorable for the telecommunications market. However, in order to analyze the market it is necessary to take into account several factors such as the country and its economic climate, growth rate, rate of penetration of services, competition in this market, among others. As mentioned above, Portugal is experiencing a climate of austerity
and this may be causing a decrease in private consumption and in 2010 the growth rates of all areas of business telecommunications decreased, but the business of pay television and the Internet continued to grow.
28 Ana Raquel Ferreira M&A: Zon and Sonaecom
Figure 4: Penetration Rate (%)
The mobile voice showed the greatest increase in penetration rate, reaching more than 15.4 million subscribers, mainly due to the growth of post-paid and pre-paid subscribers. But mobile voice revenues have been declining despite a penetration rate of around 145%. The pay television and internet have been showing revenues growth, and in addition also have a higher penetration rate demonstrating the trend of growth in these markets.
Regarding the evolution of the market share of Portuguese telecommunications operators (number of business customers Voice Mobile, Fixed Voice, Mobile Internet, Internet and Fixed Pay Television), can be seen that only Zon and Vodafone have increased their market shares by 0.4 pp, being the Optimus the company that had a greater loss of market
29 Ana Raquel Ferreira M&A: Zon and Sonaecom
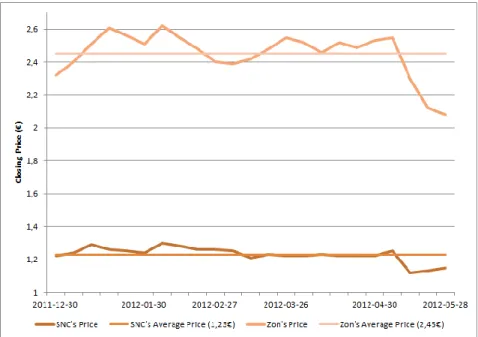
And finally, looking more particularly to the companies, at the Figure 6 it is clear that in the last six months the share price of both companies continue to have a negative trend. Therefore, the average price in the last six months of Sonaecom and Zon was 1.23€ and 2.45€ respectively.
Figure 6: Zon and Sonaecom's Closing Price (last 6 months)
3.3. Sonaecom SGPS, SA
Sonaecom emerged in 1994 and is a Portuguese company that is being transacted in the PSI-20 (Portuguese Stock Index with the twenty largest companies listed in the Lisbon stock exchange). It is a sub-holding of the Sonae Group and operates in three main business areas: Telecommunications, Media and Software and Information Systems. Optimus is the only brand of Sonaecom for the telecommunications sector and covers all market segments - residential, private, mass business, corporate and wholesale. This sector has about 4 million users and offers services for voice, internet, TV and data via mobile or fixed terminals. In the media sector the group has the daily newspaper Público that disseminates information through its various platforms: media, internet and phone. The area of SIS was established in 2002 and includes companies Bizdirect, Mainroad, WeDo and Saphety.
30 Ana Raquel Ferreira M&A: Zon and Sonaecom
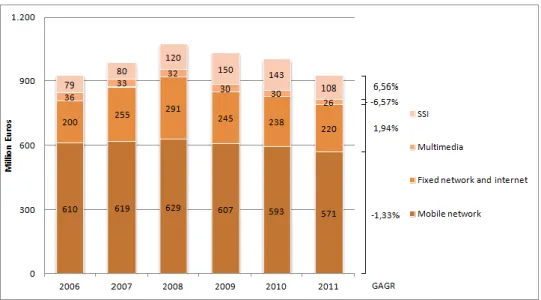
Figure 7: Sonaecom - Breakdown of Revenue
There has been a decrease of sales in both mobile network and fixed network and internet which have greater weight in terms of revenues. The mobile revenues have been declining since 2009, and although the number of customers in this business have increased from 3.6 to 3.64 million (1%), there were negative impacts on key performance indicators (KPIs) such as in the MOU (minutes of usage) and ARPU (average revenue per customer). MOUs decreased 5.8% y.o.y. to 126 minutes per month and mobile customers’ ARPU decreased to 12.9 euros (less 0,8 euros than in 2010). The wireline (fixed network and internet) revenues have been declining since 2008, but the company claims that the SMEs and corporate segments have been increasing and that those are a strategic part in this business area. Moreover, both multimedia and SSI also had a decrease in revenues from 2010 to 2011 of 12,5% and 23,9% respectively.
31 Ana Raquel Ferreira M&A: Zon and Sonaecom
Although revenues have been declining since the year 2008 to the current years, the rate of decrease of these values is easing. Moreover, the net income has increased considerably since 2008, reaching the 62.5 million in 2011. By analyzing the EBITDA margin is also observed an upward trend, and the EBITDA/revenue rate of 2011(24,4%) is even higher than in 2006 (21,2%), which may indicate that the company is having a better control of operating costs.
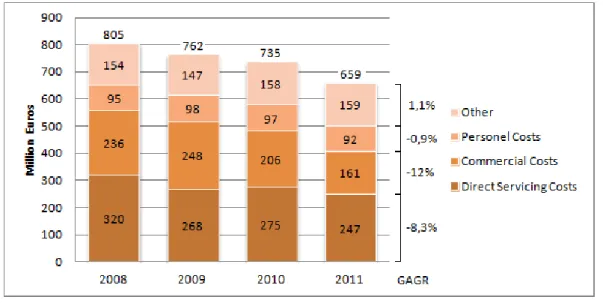
Figure 10: Sonaecom - Operating Costs
Regarding costs, the major one is the direct servicing costs, representing 37% of operating costs, and includes interconnection and content, leased lines and other network operating costs. The commercial costs are biggest costs after the direct servicing costs and include cost of goods supplied (COGS) and marketing and sales costs. The other operating costs account also has a significant weight on the total operational costs and has been increasing its percentage, being 24% in 2011. This item includes outsourcing services, general and administrative costs (G&A), provisions and others. In 2011 operating costs decreased 10.3% to 659.5 million euros. Sonaecom states that the optimization plan implemented in recent years has enabled Optimus to create an organization more efficient, resulting in the generation of positive results in several business areas.
32 Ana Raquel Ferreira M&A: Zon and Sonaecom
Figure 11: Sonaecom Shareholding Structure
3.3.1. Capital Structure
Sonaecom is listed since 2000 and have a stable shareholder structure. Sonae SGPS is the largest shareholder with a position of 53.17%, followed by France Télécom that holds a 20% stake of Sonaecom. Sonae SGPS is a Portuguese multinational group that has interests in retail, shopping centers and insuranc; and France Telecom is the leading telecommunications company in France and one of the largest telecom operators in the world, developing and commercializing products in the business of fixed line and mobile telephony, Internet, digital television and IT services.
3.3.2. Business Areas
3.3.2.1. Telco Business
- Mobile
The Optimus brand was launched in 1998 (after having won the third GSM mobile license in Portugal) and develops mobile communications activities. Later in 2007, the subsidiary that developed the activities of Sonaecom’s mobile communications (Optimus) and the former subsidiary of fixed communications services (Novis Telecom, SA) merged, and the new company adopted the name of Sonaecom - Serviços de Comunicações, SA, now known as Optimus - Communications, SA since 2010. So today the Optimus brand covers all activities of telecommunications, with a significant presence in all market segments. Optimus offers a wide range of mobile communications services to both residential and corporate customers, including offers of voice, data, mobile TV and mobile solutions and various roaming services, as well as wholesale services to third parties. Moreover, in 2001 the company created some
33 Ana Raquel Ferreira M&A: Zon and Sonaecom
shared services between fixed and mobile teams in order to obtain synergies and allowing them to offer a product resulting from this convergence, the Optimus Home.
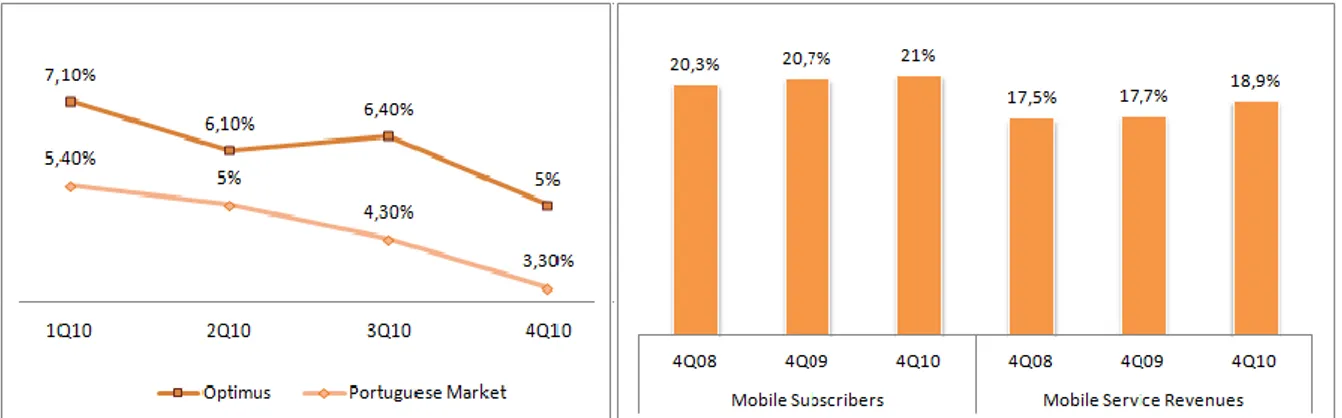
Optimus Mobile customer base has been growing above market, ensuring a steady market share growth, allowing Optimus to consolidate its position in the Portuguese market in 2011 with 3.64 million customers and a market share of about 21%.
Table 1: Sonaecom's Operational KPIs from Mobile Segment
2008 2009 2010 2011 GAGR Customers (EOP) (’000) 3191,6 3432,57 3604,1 3639,37 4,5% Net additions (’000) 298,1 241 171,5 35,3 -50,9% MOU10 (min) 128,4 132,4 133,9 126,1 -0,6% ARPU11 (euros) 16,8 14,8 13,7 12,9 -8,4% ARPM12 (euros) 0,13 0,11 0,1 0,1 -8,4% EBITDA margin 22,6% 27,5% 31,3% 35% 15,7%
Operating CAPEX as % of turnover 23,1% 13,6% 14,2% 16% -11,5%
Despite the growth of mobile customers, revenues have been declining since 2008, as many KPIs, such as minutes of use per customer per month (MOU), average monthly revenue per user (ARPU) and average revenue per minute (ARPM). This may happen because the attempt to acquire new customers is often based in lowering prices, such as the TAG promotion which
10
Minutes of use per customer per month. 11
Average monthly revenue per user. 12 Average revenue per minute.
34 Ana Raquel Ferreira M&A: Zon and Sonaecom
is targeted to young people and enables subscribers to conduct free communications between the clients of this package. But in this market the mere fact of offering the lowest prices and the more appealing packages does not automatically result in new customers, since the decision about which operator to use is very dependent on the client's group of friends and their operators. This happens because the communications between clients with the same mobile service is cheaper and so individuals will choose the mobile operator that offers the lowest prices in order to communicate with their networking. Finally, it should be noted that the EBITDA margin has improved which can result from better control costs, creation of operational synergies, among others.
- Wireline
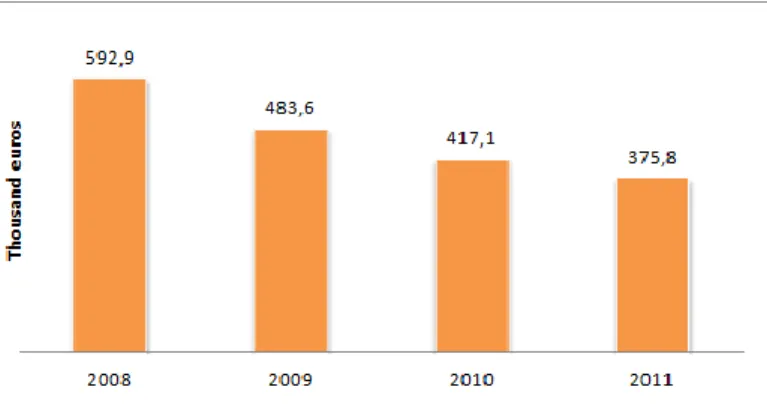
Wireline activities were carried out after the liberalization of the Portuguese fixed communications market in 2000, and the subsidiary Novis Telecom, SA, developed the activities in this segment until 2007, when it was merged and incorporated the Optimus Telecommunications SA. Also in 2007 the fixed communications services were strengthened with the acquisition of Tele2 Portugal and a former competitor’s residential and small office-home office (SOHO) customer base. Sonaecom is present in the residential market and the business market, offering services of voice, data and television.
The Corporate and SMEs segment increase its presence in the market by having more 7 thousand accesses (a growth of 4,7% between 2010 and 2011). However, the number of total accesses decreased 9.9% y.o.y. to 376 thousand accesses, mainly because of the residential segment.
3.3.2.2. SSI Business
The division of SSI was established in 2002 and currently includes four companies:
WeDo Technologies - Provider of business assurance solutions, focusing its activity on the optimization of systems and processes of performance and risk management. With
35 Ana Raquel Ferreira M&A: Zon and Sonaecom
the acquisition of Cape Technologies Limited, since 2007 has become a world leader in the software market integrated of revenue assurance.
Bizdirect - It is a leading reference in the commercialization of multi-brand IT solutions, supported by partnerships with leading manufacturers in the market, and in the management of corporate contracts for software licenses, based on new business models.
Mainroad - It is a leading company in information technologies, providing services and solutions for IT managed services, IT security, business continuity and ITIL consulting, backed in its data centre.
Saphety - It was created in 2006 from the operations of fixed telecommunications, is a provider of certification services, electronic billing and security in B2B transactions. A decision was made to integrate the previous drive B2B Bizdirect in Saphety in late 2008, a restructuring designed to capitalize on the synergies between the two companies.
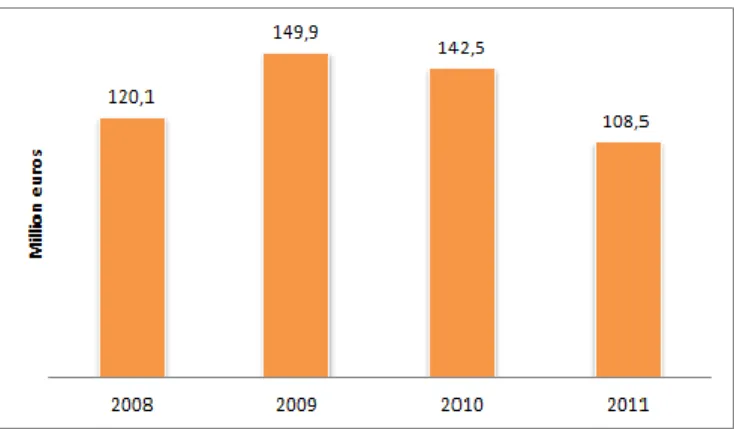
The SSI subsidiaries’ revenues have been increasing not only to organic growth, but also to mergers and acquisitions at WeDo
Technologies. In 2011 there was a drop of 51,5% in equipment sales (impacted by the end of e-initiatives program), but there was an increase in service revenues of 4.7% y.o.y.. However, from 2010 to 2011 the number of total SSI revenues decreased 23.9% y.o.y. to 108,5 million euros.
3.3.2.3. Online & Media
This segment includes a range of businesses like Miau.pt and Público, the latter is a newspaper of reference in Portugal, which has completed 22 years of existence, and the Publico.pt is currently the leader in digital media sector in Portugal, being online since 1995.
Service revenues were 3.9 million euros in 2011 and are mainly related to management services provided to subsidiaries. In 2010 the same account had a value of 6.3 million since it has included: management of the regulatory framework; support in the search for new
36 Ana Raquel Ferreira M&A: Zon and Sonaecom
financing, internal audit and risk management, legal and tax support, and allocation of temporary employees to subsidiaries.
3.4. ZON Multimédia SGPS, SA
ZON Multimedia is a business group that is present in the main national stock index, the PSI-20. In 2006 Sonaecom launched a bid to the capital of Portugal Telecom and PT Multimedia, beginning at that time the split (spin-off) between PT Comunicações and PT Multimedia. Then in 2008, after the separation of TV Cabo and its incumbent operator, ZON Multimedia emerges as an independent brand. Nowadays the company leads the market for pay TV in Portugal and is the second largest internet provider. Nationally, it is also a leader in cinema market. Its main services are cable TV, internet, distribution of audiovisual content, film and telecommunications. The ZON brand is applied to all its services, being named as ZON Lusomundo (film and audiovisual), ZON Netcabo (internet), ZON TV Cabo (television), ZON Phone (landline), ZON contents (content distribution) and ZON mobile (mobile).
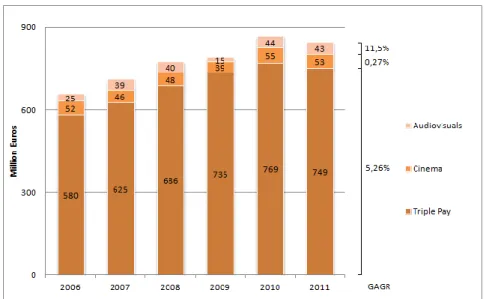
Figure 16: Zon - Breakdown of Revenue
Revenues from pay TV, broadband and voice recorded an annual decrease of 2.6% (2010 to 2011) to 749.2 million euros. In the main business of ZON there was a decrease in the last quarter of 2011 (over the last quarter of 2010) on revenue of Premium subscribers. But Zon states that Triple Play services have proved resilient to the challenging economic environment. Cinema revenues decreased 3.6% in 2011 to 52.6 million euros due to falling revenues not related to the sale of tickets. The revenues of the audiovisual division grew 9,2% from the third to the fourth quarter, driven by an improvement in revenues from film distribution, and joint
37 Ana Raquel Ferreira M&A: Zon and Sonaecom
venture Dreamia. But DVD sales continue to show a negative trend, thus diluting the positive performance of this business unit, and in relation to the year 2010 revenues from audiovisual decreased 1.6%.
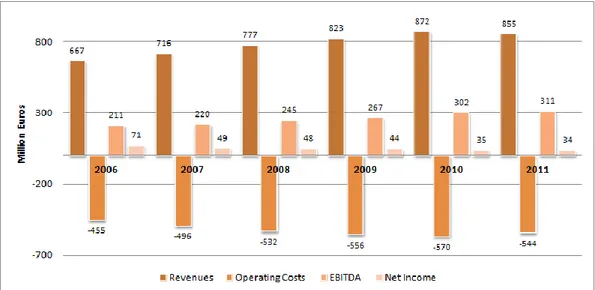
Figure 17: Zon Performance
Zon’s EBITDA had a continuous growth over the last few years, even though revenues in 2011 have suffered a decrease of 2.01%. But the net income has been declining since 2008, which is not related to operational costs. From 2008 to 2009, the net income declined from 48 million to 44 million euros, despite the increase in revenues, so this decline was due to increased depreciation by 34.4%. In 2011, although revenues have risen 2.9% the net income declined by 3.4%, having a value of 34 million euros. This decrease was due to increased income taxes, which in 2010 were approximately 20% of EBIT, moving in 2011 to be approximately 30% of EBIT.
Figure 18: Growth rates and EBITDA/Revenues
38 Ana Raquel Ferreira M&A: Zon and Sonaecom
Regarding costs, the major one is the direct costs, representing 45% of operating costs, and includes programming and exhibition costs (being the most significant), telecommunications costs, advertising shared revenues and others. The commercial costs are biggest costs after the direct costs and include commissions, marketing and publicity expenses and costs of equipment sold. These costs have been decreasing as a result of a more efficient use of available sales channels and because there is a less aggressive competitive and promotional environment. The growth rate of revenues has remained higher than the growth rate of operating costs, which means that besides the company is being able to continue to have a good level of revenues, is also able to control costs more effectively, increasing the EBITDA margin.
3.4.1. Capital Structure
The ownership structure of Zon Multimédia is widespread, and CGD is the main shareholder holding 11% of the shares. In addition, Kento Holding Limited also owns 10%, being the second largest shareholder. The latter came into the ownership structure of Zon just a few years ago and allowed to strengthen the partnership with Angola. Thus, a large percentage of Zon belongs to a wide number of shareholders, ie, over 33% of
the company belongs to shareholders who hold less than 2% of capital each. Figure 20: Zon Shareholding Structure