Measuring consumer
perceptions of online shopping
convenience
Master’s Final Work in the modality of Dissertation presented to Catholic Universiy of Portugal to fullfill the requirements for the degree of MSc. in
Marketing by
Margarida Bernardo Ferreira
under the supervision of PhD. Professor Susana Costa e Silva
Católica Porto Business School, Universidade Católica Portuguesa March 2016
ii
Acknowledgments
I would like to express my sincere gratitude for the availability, support and motivation of those who contributed for this important achievement, in a particular way to:
Prof. Dr. Susana Costa e Silva for her tireless, constant and invaluable orientation and support during the development of this master thesis, crucially contributing to its realization.
My parents and sister, for all the suport, motivation and love. Their availability and encouragement were incondicional.
My friends, for all the words of support and encouragement and for the enrichement times spent together.
My acknowledgement is also extended to those who responded and gently shared the online survey. Their collaboration was fundamental for the obtained results.
iv
Abstract
The aim of this master thesis is to identify which dimensions of convenience affect consumers’ intention of using online shopping. Also it explores a conceptual model to measuring consumer perceptions of online shopping convenience. This paper contains prospects about online consumer behavior, and the results have important implications for retailers, managers and marketers, related to online shopping strategies.
An empirical investigation was carried out to test the hypotheses. In order to answer the research question, data collection was done through a web-based survey with a convenient sample as a means to collect customers’ feedback, opinion, feelings, attitudes, and perceptions about their last online shopping experience. The findings were further discussed in the light of existing literature.
The sample includes 250 young Portuguese anonymous participants. It was used a Confirmatory Factor Analysis (CFA) in the scale validation for the analysis and measurement of specific constructs and a Structural Equation Model (SEM) in order to test the relationships of the model. The results reveal that the model proposed Possession, Transaction and Evaluation are the dimensions with more influence in online shopping convenience.
The outcomes of this study help to understand which dimensions of online convenience prevent or encourage the use intention of online shopping. The results not only help develop a better understanding of online shopping theories for researchers, but they also offer viable knowledge to those involved in promoting online shopping to potential purchasers.
Keywords: online convenience, online shopping, construct of convenience, dimensions online purchase behavior, Portugal.
vi
Table of Contents
Acknowledgments ... ii
Abstract ... iv
Table of Contents ... vi
List of figures ... viii
List of tables ... x
Introduction ... 12
Literature Review and Proposed Model ... 14
2.1 Online convenience ... 14
2.2 The multidimensional nature of online convenience ... 16
2.3 Proposed Model ... 17 2.3.1 Access convenience ... 18 2.3.2 Search convenience ... 19 2.3.3 Evaluation convenience ... 20 2.3.4 Attentiveness convenience ... 20 2.3.5 Transaction convenience ... 21 2.3.6 Possession convenience ... 22 2.3.7 Post-possession convenience ... 22
2.3.8 Online satisfaction convenience ... 23
2.3.9 Behavioral intentions ... 24
2.3.10 e-WOM (Electronic word-of-mouth) ... 24
vii 3.1 Overview ... 27 3.2 Questionnaire’s structure ... 27 3.3 Sample ... 28 3.4 Data collection ... 29 3.5 Procedure ... 30 3.6 Scales ... 30 Empirical study ... 34 4.1 Data analysis ... 34
4.2 Confirmatory Factor Analysis ... 35
4.3 Structural equation model ... 42
Discussion and findings ... 46
5.1 Theoretical implications and contributions ... 47
5.2 Managerial Implications ... 50
5.3 Limitations and Future Research ... 52
viii
List of figures
Figure 1: Conceptual Model ... 26 Figure 2: Demonstration of the CFA model ... 38 Figure 3: Model Results ... 45
ix
x
List of tables
Table 1: Items of the constructs used in the online survey ... 33 Table 2: Descriptive analysis of online convenience dimensions calculated by averaging ... 29 Table 3: Fit indices for measurement model ... 37 Table 4: Results from the CFA: Reliability, average variance extracted and factor loadings of items ... 40 Table 5: Correlations between constructs ... 41 Table 6: Regression weights, Standardized Regression Weights and probability associated ... 44
12
Chapter 1
Introduction
Consumer decision making is significantly influenced by both the speed and ease with which consumers can make contact with retail outlets. Many consumers turn to the Internet to reduce the effort associated with making a decision (Beauchamp & Ponder, 2010). The Internet presents a new paradigm for conducting business relations - is becoming an increasingly popular medium that facilitate information search, decision, and purchase. The degree to which shoppers are now adopting the Internet as a shopping channel enhance the need to better understand and predict consumers’ online shopping behavior. Consequently, online convenience has been one of the principal motivations underlying customer’s inclinations to adopt online purchasing (Brown, 2001; Zhilin Yang et., al 2013)
While shopping, consumers spend time and effort to complete multiple tasks and because today’s customer is more time-starved than ever, it is appropriate to consider the benefits of providing online shopping convenience. Online retailers are certainly able to supply more convenience, as store location becomes irrelevant and consumers may do the shopping from any location (provided they have an Internet connection), 24 hours a day, seven days a week (Beauchamp & Ponder, 2010). Therefore, customers’ attention has been intensively deviated to virtual online as a convenient medium. Because the demand for online convenience has become so strong, marketers must develop a more precise understanding of the concept. Hereupon, our study pretend to investigate which convenience dimensions are the most important to consumers in online shopping.
13
Given the above reasoning, the purpose of this paper is to understand and deepen the discussion concerning with the importance of online convenience by Portuguese consumers. To achieve such a goal, it is proposed to evaluate the dimensions of convenience that consumers value the most in their online shopping experiences. In order to do so, it is important to identify the most common dimensions that positively influence their purchase behavior intentions and satisfaction. The identification of these constructs can help managers in identifying and overcoming important obstacles to the delivery of an excellent and convenient service to customers. This may represent a key driving force in enhancing customers’ satisfaction and in turn in expanding their customer bases.
This document is divided into 5 chapters. Chapter One establishes the study’s motivation, as well as the objectives and the research question. In Chapter Two, literature review is discussed in the light of existing literature, concerning online convenience and the multidimensional nature of convenience. Furthermore, it also presents the model and defines the hypotheses. Chapter Three details the methodology for the study, while Chapter Four presents the empirical study. Finally, Chapter Five discusses the findings of the study, offers the main conclusions, and makes some suggestions for future research.
14
Chapter 2
Literature Review and Proposed Model
2.1
Online convenience
As consumers allocate less time to shopping and more to other endeavors, their wish for convenience has grown and consequently their attention has been addressed to online shopping. The lack of consumer’s time results in a customer who wishes to purchase goods and services that save them time and effort (Berry & Cooper, 1990). Retailers have been focusing on satisfying this demand for services which are able to maximize the speed and ease of consumer’s buying process (Shaheed, 2004). These consumer resources of time and effort are defined in marketing literature as non-monetary costs that influence purchasing behavior (Bender, 1964; Herrmann & Beik, 1968).
The time-saving aspect of convenience has been extensively studied in consumer waiting literature, particularly with respect to consumer reaction to waiting time (Gehrt & Yale, 1993). Objectively, time spent waiting on a service frequently leads to an opportunity cost (Berry et al., 2002) that can represent valuable time in customers daily life. Normally, emotional reactions to waiting may subject consumers to stressful situations (Hui & Tse, 1996). The concept of effort-saving relates to the decrement of cognitive, physical, and emotional activities that consumers must support to purchase goods and services such as searching for product information, locating the product they wish to buy or completing the checkout process (Berry et al., 2002). Berry et al. (2002) have concluded that the greater the time costs associated with a service, the lower the degree of consumers’ perceived service convenience. Hui et., al (1998), claim the
15
more the effort made by a customer, the more customer’ resources are committed, and higher is the potential for frustration.
The Internet presents a new method for conducting business relations and currently is the most viable option for consumers who wants to save time and effort. People find online stores more attractive because of their lives are typically more time constrained. For instance, as people climb higher in their professional careers, the demands on their time increase, forcing them to look for retail formats, where they have to spend the least time possible (Bhatnagar et al., 2000). Their focus is on efficiently completing the shopping experience and obtaining its product with minimum expense of energy (Kaltcheva, V.D et al., 2006). For this purpose, Internet is ideal. Consumers have the ability to shop from their homes or offices for a variety of products and services from all over the world. They are able to view products on their computer screens, and visualize how the products may benefit their needs. They can also easily compare prices (Zhilin Yang., et al 2013) and engage in online discussions with other consumers about the products and services are interested in. Thus, online shopping combines the entire purchasing process, from product exposure to product purchase, into one easily convenient medium. Retail convenience is defined as consumers’ time and effort costs associated with shopping in a retail environment (Seiders, Berry & Gresham, 2000). By saving customers time and energy, retailers increase the value of their market offer (Berry et al., 2000).
Retailers have founded a new type of consumer - one who considers the concept of time as valuable as money. Because today’s consumer is more time-starved than ever, it is appropriate to genuinely consider the benefit of online convenience to consumers as a concept of extreme importance (Beauchamp & Ponder, 2010). Existing empirical findings focusing on convenience indicate that this concept plays a decisive role in the relationship between customers and their service providers: inconvenience has been shown to be a reason why customers abandon the connection with a firm (Keaveney, 1995; Pan & Zinkhan, 2006),
16
whereas convenience has been shown to be a major reason for customers to intensify a relationship (Seiders et al., 2007).
2.2
The multidimensional nature of online
convenience
The concept ‘convenience’ was first used by Copeland (1923) who referred to it as the measure of time and effort wasted in purchasing a consumer product. Researchers taking a closer look at the concept of convenience describe it as a multidimensional construct (Yale and Venkatesh 1986; Brown, 1990; Seiders, Berry & Gresham 2000; Berry, Seiders & Grewal 2002), or as a second-order construct consisting of different types of time and effort costs. Thus, online convenience is not an inherent characteristic of a service being offered by the supplier but a proxy of resources being used by customers (Lew G. Brown, 1989; Farquhar and Rowley, 2009). Based on the consumer buying stages Zhilin, Yang
et al., (2013) have developed five classes of convenience: access, search,
evaluation, transaction and possession/post-purchase convenience. Berry et al., (2002) review of convenience-related literature presented a conceptual model proposing another comprehensive multi-dimensional measure of convenience within a services context. They suggested that service convenience is a multidimensional construct consisting of five components, namely: decision convenience, access convenience, transaction convenience, benefit convenience, and post-benefit convenience. The Berry et al., (2002) conceptual study was developed into a five- dimension instrument - the SERVCON scale by Seiders et
al. (2007). However SERVCON scale, developed in the context of traditional
offline shopping, does not comprehend the unique facets of online shopping convenience since online retailers utilize the internet as a shopping platform. Beauchamp & Ponder (2010), conscious of this gap of research, have developed
17
the convenience dimensions common to both online and offline shopping (access, search, transaction, possession) and examines the relative importance of each dimension from the perspectives of online and offline shoppers. This study found that, compared to conventional in-store shopping, consumers perceive shop online as being more convenient for purposes of access and search convenience, but not in terms of transaction convenience.
Understanding convenience can be facilitated through an examination of the existing literature review. However, although it has been conceded that convenience encompasses a number of dimensions, there has been no agreement on what these dimensions are (Seiders et al., 2007)
2.3
Proposed Model
Seiders et al. (2000) have argued that the importance that customers put on convenience has prompted retailers to redesign store operating systems and emphasize service sales. These authors also suggested some ideas to offer customers convenient shopping, including strategies to improve the speed and ease with which consumers can reach a retailer; identify, select, and obtain products; and upgrade transactions. In accordance with what was claimed above, our study argues that consumers favor retailers that save them time and energy. Consequently, by understanding an online experience from drive in to check out, retailers will be able to maximize the speed and ease of shopping and build lasting customer relationships. Thus, it becomes crucial to better understand and to develop strategies in order to facilitate and improve consumers’ online shopping experiences.
Based on the reviewed literature, the authors propose the following hypothesis in order to understand some constructs that are crucial for improve perceptions
18
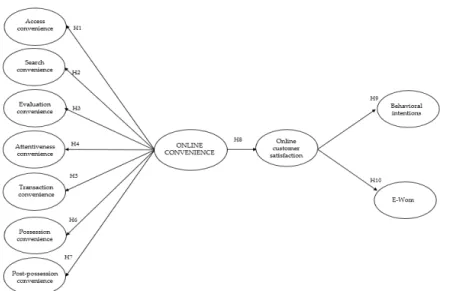
of online convenience. The hypothesis will be analyzed. The theoretical model is presented in Figure 1.
2.3.1 Access convenience
According to Berry et al., this dimension is “characterized as the speed and ease with which consumers can reach a retailer” (Berry et al., 2000, p.81). Access convenience is a deeply important dimension of retail convenience, because if the consumer can’t access the retailer, then he/she will never have the opportunity to obtain the desired product. Traditional retailers may upgrade access convenience by operating from a location that is easy to get to, close to most consumers, and close to other commonly visited stores (Berry et al., 2000). Contrariwise, online retailers are surely able to provide access convenience, as store location becomes irrelevant (Rohm & Swaminathan, 2004), and consumers may shop online from any location, at any hour of the day, seven days a week (Hofacker, 2001). The accessibility of web sites is considered as the most important factor in determining consumer perceived online shopping convenience (King & Liou, 2004). Compared to traditional shopping, shopping online relieves the consumer of travel time/effort to the location, time/effort spent parking, and time/effort spent walking from the parking to the store (Bhatnagar, Misra and Rao 2000). Access convenience gets retailers off to a good start with busy consumers (Seiders
et al., 2000). This way, we would like to propose the following hypothesis:
H1: The greater the perceived access convenience, the greater it would be the perceived
19
2.3.2 Search convenience
The Internet allows retailers to improve their business relations and develop advertising strategies. Through this instrument, consumers are able to view products on their computer’ screens, and visualize how the products may fit their needs. They can also engage in online discussions with other consumers about the products and services they seek and compare prices easily. These types of flexibility (navigation, selection and availability of the product) provide psychological benefits by avoiding crowds, reducing waiting time, and expending less effort in traveling to physical stores (Beauchamp & Ponder, 2010). This is why it is extremely important for retailers to improve their websites; these must be an intuitive instrument, easy to handle and with an appealing design in order to direct the client to decision making. By doing so, retailers are improving search convenience - the “speed and ease with which consumers identify and select products they wish to buy” (Beauchamp & Ponder, 2010; pp.52). So, while access convenience decreases the time and effort necessary to reach a retailer, search convenience helps consumers through the shopping process by aiding them make their decision. Consumers are often confronted with an extensive product assortment and little time to make a decision, and because of that, online retailers have to be available to provide sufficient written information about the product offerings. The more effective retailer’s efforts in facilitating customer’s product searches, the quicker and easier the customer’s journey through the shopping experience. (Berry et al., 2000). Therefore, we would like to propose the following hypothesis:
H2: The greater the perceived search convenience, the greater it would be the perceived
20
2.3.3 Evaluation convenience
Evaluation convenience is associated with the availability of detailed yet easy to-understand product descriptions by using various presentation features, such as text, graphics, and video, on the web site of the company (Zhilin Yang, et
al., 2013). This type of product exposure allows the consumer to get to know the
product and compare it with others as well as to make the purchase process faster. In recent years, the overwhelming assortment of products and detailed information that is accessible, at just one click of the mouse, tend to make online shoppers more sensitive than ever before to evaluation convenience (Zhilin Yang
et al., 2013). Accordingly, we would like to propose the following hypothesis:
H3: The greater the perceived evaluation convenience, the greater it would be the
perceived overall service.
2.3.4 Attentiveness convenience
As Luedi (1997) and Madu (2002) argued, the strong competition in the Web marketplace se online retailers in a situation where simply exposing product or service catalogs on the Web is not enough to guarantee their survival. The attentiveness dimension refers to the extent to which online retailers provide personalized services to their customers (Jun, M et al., 2004). Even though a Web site is an impersonal medium, in order to retain customers, a firm needs to differentiate its products and services from the competition based on its personalized service to customers (Jun, M et al., 2004). Online customers expect customize attention, customization of their needs, and areas for their questions and comments. Due to this fact, many online retailers are offering decision aids (i.e., recommendation agents or shopping bots) in order to give better personalized service (Beauchamp & Ponder, 2010). This way, we would like to propose the following hypothesis:
21
H4: The greater the perceived attentiveness convenience, the greater it would be the
perceived overall convenience.
2.3.5 Transaction convenience
Transaction convenience is defined as the “speed and ease with which consumers can effect or amend transactions” (Beauchamp & Ponder, 2010, p.53). Stores with quick checkouts and easy return policies rank high in transaction convenience because waiting to pay is an unrewarding experience (Berry et. al., 2000). At traditional stores, shoppers often spend time physically waiting in queues to complete the transaction which can be questionable for companies because waiting times are commonly perceived as longer than they actually are and negatively influence overall service evaluations (Kumar et al., 1997). One of
the main benefits of shopping online is that customers never have to wait in line (Wolfinbarger & Gilly, 2001). Online shoppers are in “virtual check-out lines” where they can fill in the transaction themselves. Thus, ease in finalizing or amending a purchase is crucial once that transaction inconvenience can dissuade a customer from doing business with a retailer in a near future (Berry et al., 2000). Privacy concerns and fear of insecure transactions have been argued to be the biggest inhibitors to shopping online and that’s why easy, safe and convenient online payment methods are crucial for customers. From the above discussion, we would like to propose the following hypothesis:
H5: The greater the perceived transaction convenience, the greater it would be the
22
2.3.6 Possession convenience
Possession convenience “as the speed and ease with which consumers can obtain desired products” define and this includes in-stock merchandise, timely production and time-delivery (Beauchamp & Ponder, 2010, p.53). According to Zhilin Yang et al., (2013), this dimension is concerned with consumers’ perceptions of time and efforts expenditures to possess what they wish. Shopping online disengage shopper’s burden of traveling to physical stores and thus customers prefer to purchase online heavy goods or staples in large quantity in order to avoid dealing with the physical effort (Zhilin Yang et al, 2013). Online shoppers must wait for their orders to be processed and delivered before obtaining their purchase. The time spent waiting for orders to be processed and for delivery is a non-monetary cost related with online shopping (Beauchamp & Ponder, 2010). One of the main motives for choosing traditional over online stores is the ability to leave the store with the intended product (Alba et al. 1997; Rohm & Swaminathan, 2004). Therefore, we would like to propose the following hypothesis:
H6: The greater the perceived possession convenience, the greater it would be the
perceived overall convenience.
2.3.7 Post-possession convenience
The importance of post-possession convenience has been emphasized in recent years because of difficulties encountered by consumers in returning products purchased over the Internet (Seiders et al., 2002). Post-possession convenience becomes important after the service exchange and relates “to the consumer’s perceived time and effort expenditures when reinitiating contact with a company after purchasing the intended product” (Seiders et al., 2002, p.8). Factors that normally determine post-possession convenience often report to a consumer’s need for product repair, maintenance, or exchange (Berry et al., 2002).
23
Sometimes consumers reinitiate contact because of a failure that is not recognize during the service encounter. Other reasons for contacting the retailer also include transaction problems, customer complaints, honoring of a guarantee, defective products or services, a customer change of his mind (Seiders et al., 2007). Post-convenience efforts can also influence other dimensions, according to the stage at which the failure occurred and the stage at which it was identified by the customer (Seiders et al., 2002). For instance, service failure can affect evaluation convenience if a consumer is given unreal information; access convenience if an online connection fails or a transaction convenience if an incorrect price is charged and its correction delays a consumer (Seiders et al., 2002). In general, the less time and effort required of consumers to effectively deal with a failed service, the greater the online experience (Seiders et al., 2002). Therefore, we would like to propose the following hypothesis:
H7: The greater the perceived post-possession convenience, the greater it would be
perceived overall convenience.
2.3.8 Online satisfaction convenience
Customer satisfaction is frequently defined as the customers’ post-purchase comparison between pre-post-purchase expectation and performance received (Minjoon Jun et al., 2004). According to Kim et al., (2006), customer satisfaction is positively affected by the convenience of an online marketplace. This means a higher convenient service would increase the perceived value of customers than a lower one. Therefore, more convenience would lead to higher satisfaction (Pham Ngoc Thuy, 2011). Hsu et al. (2010) advocated that when customers can conveniently and easily experience the benefits of the services, they are more likely to be satisfied and reuse them. Therefore, if online service providers reduce time and effort costs throughout the online purchase experience, they will be increasing customer satisfaction and their willingness to
24
reuse the service (Seiders et., al 2000). This way, we would like to propose the following hypothesis:
H8: The greater the perceived of overall convenience, the greater it would be the impact
on customer satisfaction.
2.3.9 Behavioral intentions
According to the model presented by Zeithaml et al., (1996), behavioral intentions can be perceived by measures as repurchase intentions, word of mouth, loyalty, complaining behavior, and price sensitivity. High service quality (as perceived by the customer) normally leads to favorable behavioral intentions while low service quality tends to lead to unfavorable behavioral intentions. A consumer’s online shopping experience will have a significant effect on his/her future purchase intention for online shopping (Jayaward et al., 2007). Thus, we can say that the more positive the customer’s experience, the more likely he or she is of reusing the service (Godwin et al., 2010).This idea follows the one of Zeithaml et al., (1996) who emphasize that behavioral intentions are relevant to a customer’s decision to remain with or leave a company. From the above discussion, it can be construed that more convenience may affect purchase behavior. Therefore, we would like to propose the following hypothesis:
H9: The greater the perceived of overall convenience, the greater it would be the impact
on behavioral intentions.
2.3.10 e-WOM (Electronic word-of-mouth)
The traditional Word of Mouth (WOM) is a mode of communication that was described originally as a means of sharing opinion and comments as regards to the products and services that people are transacting. WOM has been shown in situations to be more effective than the traditional marketing tools of personal
25
selling and various types of advertising (Katz and Lazarfeld, 1955; Engel et al., 1969). However, word of mouth has evolved into an entirely new form of communication that exploits modern technology. This is nominated as electronic word of mouth (e-WOM) communication. Gwinner et al., (2004) refer to e-WOM as any positive or negative statement made by potential, actual, or former customers about a product or company, which is made available to a multitude of people and institutions via internet. The substantial growth in online social networks has vastly expanded the potential impact of electronic word of mouth (e-WOM) on consumer purchasing decisions. The digital platform is constituted of weblogs, newsgroups, discussion forums, social network websites, review websites, and online newspaper columns. Truly, word of mouth has found a new way to assert its value to product marketing in new forms of communication. (Gruen, 2005)
One type of e-WOM is online consumer reviews, it consists of analyses and commentaries generated and posted by the end users of products who have spent their money on the product and indeed used it. Online shoppers always undertake a review of other shoppers’ comments and experiences before they buy products online. Millions of people have access to a single online review, and this is where the power of e-WOM lies (Cheol Park et al., 2011).
In general, consumers find it important to hear the opinions of others while (or before) making purchase decisions. They talk and discuss their purchase intentions with family members and friends on the Internet. Customers who have good experiences with a retailer are more likely to engage in positive word of mouth (Narayandas, 1998) and as a result, receivers are most likely influenced in their decision-making because they interact and communicate with others (Cheol Park et al., 2011). This argumentation allow us to propose the following hypothesis:
H10: The greater the perceived of overall convenience, the greater it would be the impact
26
Based on the above, the model we would like to propose to state which dimensions of convenience influence consumers’ intention of using online shopping is presented below in figure 1. The scales used were all reflective since it considers that the items reflect the construct (online convenience).
27
Chapter 3
Methodology
3.1
Overview
In order to analyze the relationships of the dimensions, an online survey was designed involving several constructs. The survey was translated from English to Portuguese and reverse translation was used to ensure the consistency and understanding of the questions. The survey was written in Portuguese to raise the response rate, facilitate the understanding of the questions, to avoid misunderstandings or doubts that could happen when responding to a survey written in a foreign language and also because the research took place in Portugal. The authors have perceived that there is a significant lack of prior research concerning online shopping convenience and its dimensions in the Portuguese market and this was the main reason why they have decided to do the research in this country. The data obtained was then analyzed through the statistical software SPSS AMOS 23.0, mainly with the use of structural equations.
3.2
Questionnaire’s structure
In the beginning of the questionnaire the participants were informed about the academic nature of the study and the topic under analysis. The survey was structured into three main sections, as summarized below.
28
Firstly, the initial questions presented information such as ages, gender, locality, academic formation and profession of the respondents in order to guarantee their eligibility.
Afterwards, the participants were asked to indicate their degree of agreement/disagreement with statements regarding to the different dimensions of convenience proposed in our model. All constructs were measured using already calibrated scale 5-point Likert scales.
In the last section, respondents were presented with an open response that sought to understand which other motives - besides those presented in the survey - can lead to online shopping.
3.3
Sample
A sample of 350 potential respondents took part in the study, although only 250 participants replied affirmatively to the survey.
The sample consisted of 167 women and 83 men (N = 250), with the majority under 26 (87.2%) and half of the sample has educational qualifications at the secondary level (50%). Professionally, almost two thirds are students (64.4%) and 26.8% is working on behalf of others
With regard to the location, because it is an open response, it was decided to present only the results of the localities where we found higher frequencies. Thus, approximately 20%, live in Vizela, 18% in Porto, Braga 15.2% and 10.4% in Guimarães.
Almost two thirds of the sample buy online up to 5 times per year and about 20% between 5 and 10 times. The last purchase was made at Zara for approximately 20% of the sample and on E-bay for about 10% of the sample.
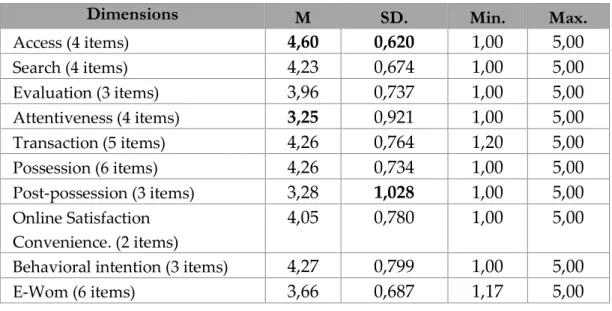
The dimensions of purchase were calculated using the mean value since they were made by a number of different items. The highest average values were observed in the access dimension (M = 4.60) and the lowest in attention
29
dimension (M = 3.25). There was a greater dispersion of agreement on Post-possession (SD = 1.028) and lower dispersion in access (SD = 0.620). Results are presented in Table 2.
3.4
Data collection
The research took place in Portugal and it was based on an online survey using Qualtrics Survey Software. The online survey was distributed with the help of individuals that shared the survey with their contacts.
The survey was formulated by using existing scales in the literature, originally written in English. The survey was also written in Portuguese to raise the response rate and facilitate the understanding of the questions. The questionnaire was also pre-tested in order to identify errors and problems, analyze if the scales’ items were well understood by the respondents and to guarantee the quality of the translation. The pre-test didn’t reveal any major concern. The data collected were then analyzed using statistical software SPSS, mainly through the use of confirmatory factor analysis.
Dimensions M SD. Min. Max.
Access (4 items) 4,60 0,620 1,00 5,00 Search (4 items) 4,23 0,674 1,00 5,00 Evaluation (3 items) 3,96 0,737 1,00 5,00 Attentiveness (4 items) 3,25 0,921 1,00 5,00 Transaction (5 items) 4,26 0,764 1,20 5,00 Possession (6 items) 4,26 0,734 1,00 5,00 Post-possession (3 items) 3,28 1,028 1,00 5,00 Online Satisfaction Convenience. (2 items) 4,05 0,780 1,00 5,00
Behavioral intention (3 items) 4,27 0,799 1,00 5,00
E-Wom (6 items) 3,66 0,687 1,17 5,00
30
3.5
Procedure
Only completed sentences were considered in the sample, uncompleted surveys were rejected from the analysis. Sampling, coverage and measurement errors were also evaluated. A sample of 350 potential respondents took part in the study, although only 250 participants replied affirmatively to the survey. Although questions were marked as mandatory (meaning that the respondents could not move on to the next question without answering the previous one.), 17 respondents only responded to the first five demographic questions and 83 did not respond to any question related to the convenience dimensions. We believe that the main reason for that is associated to the fact that respondents had close the questionnaire without completing the all the questions. However, the sample obtained was considered acceptable given the number of constructs in analysis.
3.6
Scales
Participants were asked to indicate their degree of agreement/disagreement with statements regarding the “Access”, “Search”, and “Evaluation” variables, based on their last shopping experience. The statements were based on Zhilin et.,
al Yang (2013) 1-item “Access convenience” scale; Beauchamp & Ponder (2010)
6-item “Access convenience” scale; 3-item Beauchamp & Ponder (2010) “Search convenience” scale. To measure these three constructs, a 5-point Likert scale ranging from 1 “Strongly Disagree” to 5 “Strongly Agree” was used. This scale has been chosen because it’s used in most of the empirical studies and it allows a more assertive response from the respondents (a larger scale could bring higher response indecisiveness).Then, participants were asked to indicate their degree of agreement/disagreement with statements regarding the “Evaluation convenience” and “Attentiveness convenience” variables, based on Zhilin Yang
31
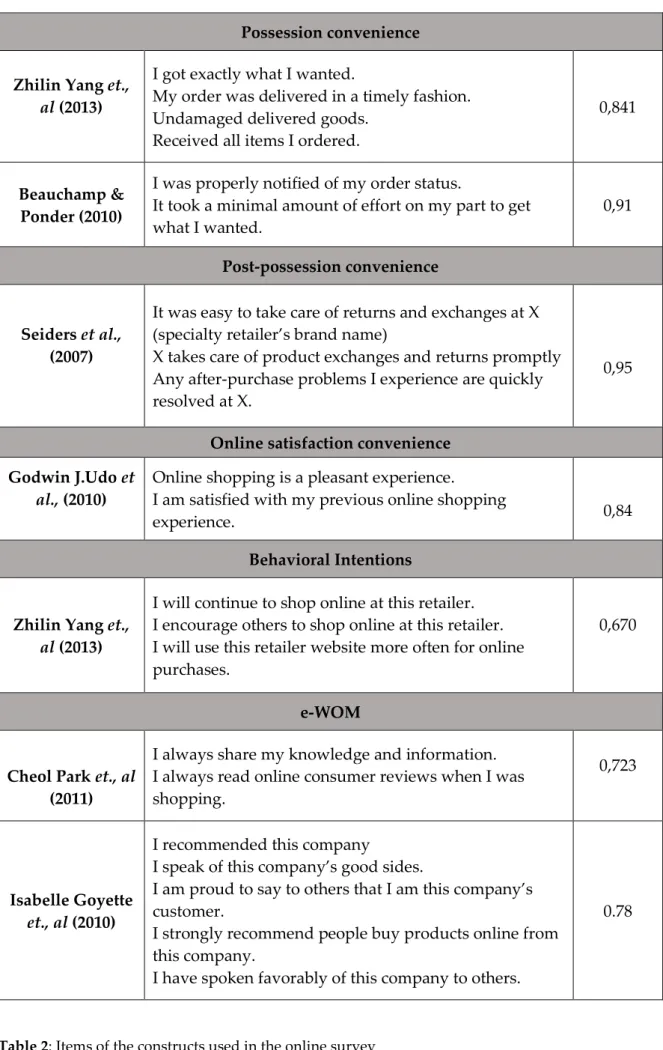
“Attentiveness” scale. Next, participants were asked to indicate their degree of agreement/disagreement with a statement regarding the “Transaction convenience” variable. The statement was based on Zhilin Yang et al., (2013) 1-item “Transaction” scale; Beauchamp & Ponder (2013) 3-1-item “Transaction”. The sixth section concerned the “Possession convenience” variable and it asked participants to indicate their degree of agreement/disagreement with statements from Zhilin Yang et al., (2013) 4-item “Possession” scale; and Beauchamp & Ponder (2010) 1-item scale. Then participants were asked about “Post-purchase convenience”. The statements were based on Seiders et al., (2007) 3-item “Post-purchase” scale. Finally, participants were asked about “Online satisfaction convenience”, “Behavioral Intentions” and “WOM”. The statements were based on Godwin J.Udo et al., (2010) item “Satisfaction”; Zhilin Yang et al., (2013) 3-item “Behavioral Intention” scale; and Cheol Park et al., (2011) 2-3-item “WOM” scale and Isabelle Goyette et al., (2010) 5-item “WOM” scale.
All constructs were measured using already calibrated scale 5-point Likert scales. One of the scales was a nominal scale. Some of the items were adapted from the original scales (see Table 1).
32
Reference Items Cronbach
α Access convenience
Zhilin Yang et.,
al (2013)
Could shop anytime I wanted.
Could order products wherever I am. The website is always accessible.
0,725
Beauchamp &
Ponder (2010) The website was easy to find. 0.80
Search convenience
Beauchamp & Ponder (2010)
It was easy to navigate the website.
I could find what I wanted without having to look elsewhere.
The website provided useful information.
It was easy to get the information I needed to make my purchase decision.
0.89
Evaluation convenience Zhilin Yang et.,
al (2013)
Provides product specifics
Uses both text and graphics of product information. Sufficient information to identify different products.
0,764
Attentiveness convenience
Minjoon Jun (2004)
The online retailer gave me personalized attention. The website had a message area for customer questions and comments.
I received a personal “thank you” note via e-mail or other media after I placed an order.
0.73
Transaction convenience Zhilin Yang
et.,al (2013) Flexible payment methods. 0.784
Beaucham & Ponder (2010)
The check-out process was fast. My purchase was completed easily.
It didn’t take a long time to complete de purchase process.
0,95
33
Possession convenience Zhilin Yang et.,
al (2013)
I got exactly what I wanted.
My order was delivered in a timely fashion. Undamaged delivered goods.
Received all items I ordered.
0,841
Beauchamp & Ponder (2010)
I was properly notified of my order status.
It took a minimal amount of effort on my part to get what I wanted.
0,91
Post-possession convenience
Seiders et al., (2007)
It was easy to take care of returns and exchanges at X (specialty retailer’s brand name)
X takes care of product exchanges and returns promptly Any after-purchase problems I experience are quickly resolved at X.
0,95
Online satisfaction convenience Godwin J.Udo et
al., (2010)
Online shopping is a pleasant experience.
I am satisfied with my previous online shopping
experience. 0,84
Behavioral Intentions
Zhilin Yang et.,
al (2013)
I will continue to shop online at this retailer. I encourage others to shop online at this retailer. I will use this retailer website more often for online purchases.
0,670
e-WOM
Cheol Park et., al (2011)
I always share my knowledge and information. I always read online consumer reviews when I was shopping.
0,723
Isabelle Goyette
et., al (2010)
I recommended this company
I speak of this company’s good sides.
I am proud to say to others that I am this company’s customer.
I strongly recommend people buy products online from this company.
I have spoken favorably of this company to others.
0.78
34
Chapter 4
Empirical study
In this section, the computation model’s main results are presented, the hypotheses are tested. The measures’ reliability and the model’s specification are assessed through preliminary analysis. The properties of the measures are assessed through exploratory and confirmatory factor analysis. To test the hypotheses suggested in the model structural equation modeling are employed.
4.1 Data analysis
Factor analysis was used to analyse the data and to assess construct validity and convergent validity. Then, structural equations modelling (SEM) was used in order to validate the model by measuring all the suggested construct relationships simultaneously. We decide to use this technique because we are measuring a construct that cannot be measured directly and is composed of various dimensions. Sample size, missing data, normality and linearity, outliers and singularity and factorability were verified to conclude that the data was appropriate. All the outliers were eliminated and the non-respondents were not analyzed.
35
4.2
Confirmatory Factor Analysis
The measurement model was subject to a confirmatory factor analysis (CFA), conducted with the support of AMOS 23.0, with the maximum likelihood discrepancy estimation method in order to assess the construct and convergent validity. CFA is useful in the scale validation for the analysis and measurement of specific constructs (Hair et al., 1998) as well as to confirm the multidimensionality of a theoretical construct (Byrne, 2001). The model was assessed in two steps: adjustment of the measurement model (step 1) and adjustment of the causal model (step2). In the current analysis, the specified relationships between the six constructs were tested. Some of the scale items were removed due to low factor loadings in the standardized regression and respondents’ perceived similarity between items. Comrey (1973) states that values for loadings higher than 0.63 are acceptable. Some of the retained items present lower values than this benchmark, yet they present values higher than 0.5 which is the minimal threshold to be accepted. Since these scales were previously used and validated, and to preserve the model integrity, we have decided to kept these items in the model for further analysis. Since some construct show validation problems, the modification indices were analyzed resulting in the drop of three items and construct related to convenience search. In order words, the quality of the global adjustment model was made by the modification indices produced by AMOS and based on theoretical considerations. Also, from the initial 250 responses obtained, only 246 observations were used for the analysis since four of them were considered outliers by the Mahalanobis d-squared test.
The CFA showed that initial model had problems in convergent and divergent validity, therefore the modification indices were used in order to improve the model fit adjustment. The modification indices with higher absolute value were chosen. The analysis of the indices showed that some modifications
36
in the model specification could be made to improve the global fit indices. First, some items were correlated such as Q12_1 (Flexible payment methods) with Q12_2 (The check-out process was fast) and Q13_3 (Undamaged delivered goods) with Q13_4 “Received all items I ordered”. The model was again analyzed and the modification indices suggested to eliminate Q11_4 “I received a personal thank you note via e-mail or other media after I placed an order”. It were observed some improvements, but problems with AVE remained. Then, Q9_3 “I could find what I wanted without having to look elsewhere” and Q13_3 “Undamaged delivered goods” it were eliminated. We run again the model and decided to eliminate the search dimension which improved the discriminant validity. The high correlation between transaction and possession (0,779) still suggest problems with discriminant validity. However, in order to ensure the integrity of the model, we decided to maintain both dimensions. Although CFA suggests that these dimensions do not have a clear identity, we have conducted and exploratory analysis which showed that they are indeed two distinct factors. In other words, the items of transaction were associated to one factor and the items of possession to another one. The strong correlation between those dimensions can be explained by the characteristics of the sample, leading the respondents to answer similarly to these different constructs.
The scales internal consistency was measured using the Cronbach’s α value. According to Hair et al. (2006, p.137), “the generally agreed upon lower limit for Cronbach’s α is 0.7”.As can be observed in Table 1, all of the values obtained are higher than 0.7.
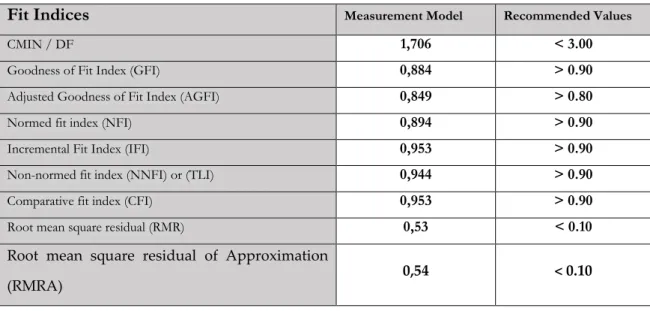
Several model-fit indices were observed to assess the measurement model. As shown in Table 3, some of the fit indices are above the required values and the remaining are very close to the recommended values from previous studies, thereby revealing a satisfactory fit.
37
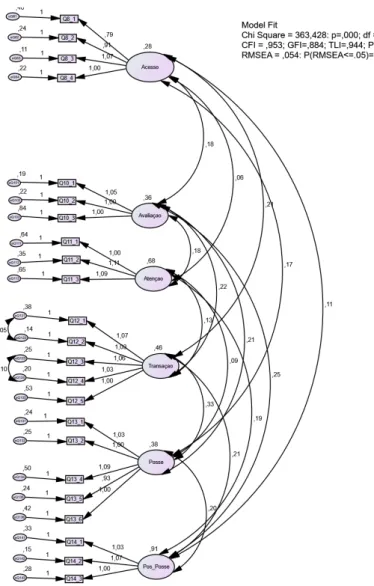
Table 3, present the main results of the CFA model estimation, including Cronbach’s 𝛼, the average variance extracted (AVE), and each item’s factor loadings. The AVE was calculated according to the recommendation of Hair et al. (1998, p. 612)1. From figure 2 it is possible to observe the main results of the CFA model – it presents the values of standardized regression weights and individual reliability of each item in the final model simplified.
1Variance Extracted = 𝛴 𝑠𝑡𝑎𝑛𝑑𝑎𝑟𝑑𝑖𝑧𝑒𝑑 𝑙𝑜𝑎𝑑𝑖𝑛𝑔 2
𝛴 𝑠𝑡𝑎𝑛𝑑𝑎𝑟𝑑𝑖𝑧𝑒𝑑 𝑙𝑜𝑎𝑑𝑖𝑛𝑔 2 + 𝛴 𝜀𝑗 𝛴 𝜀𝑗 = 𝛴 (1 − 𝛴 𝑠𝑡𝑎𝑛𝑑𝑎𝑟𝑑𝑖𝑧𝑒𝑑 𝑙𝑜𝑎𝑑𝑖𝑛𝑔 2 )
Fit Indices Measurement Model Recommended Values
CMIN / DF 1,706 < 3.00
Goodness of Fit Index (GFI) 0,884 > 0.90
Adjusted Goodness of Fit Index (AGFI) 0,849 > 0.80
Normed fit index (NFI) 0,894 > 0.90
Incremental Fit Index (IFI) 0,953 > 0.90
Non-normed fit index (NNFI) or (TLI) 0,944 > 0.90
Comparative fit index (CFI) 0,953 > 0.90
Root mean square residual (RMR) 0,53 < 0.10
Root mean square residual of Approximation (RMRA)
0,54 < 0.10
38
Figure 2: Demonstration of the CFA model
The reliability and convergent validity of the factors were estimated using Cronbach’s α and average variance extracted (AVE) (see Table 3). According to Hair et al. (1998, p.612), “the indicator reliabilities should exceed 0.50 which roughly corresponds to a standardized loading of 0.70.” All of the Cronbach’s α coefficients were above 0.70. According to Hair et al. (1998), the variance extracted value (AVE), should exceed 0.50 for a construct. As can be seen in Table 4, all values of the average variance extracted exceeded the minimum value. Therefore, the extracted variance reveals the basis of convergent validity. Furthermore, as shown in Table 4, convergent validity was also assessed through the factor loadings of the measurement items (>0.50). All of the factor loadings
39
were above the recommended value. This suggest the adequate reliability and convergent validity of the measurements. For satisfactory discriminant validity, the AVE from the construct should be greater than the variance shared between the construct and other constructs in the model. According to Hair et al. (2006, p.129), based on a significance level of 0.05, “factor loadings of ± 0.40 are minimally acceptable, the values greater than ± 0.50 are generally considered necessary for practical significance.”
Items Factor Loadings AVE Cronbach’s Alpha
Access Q8_1 Q8_2 Q8_3 Q8_4 0,553 0,706 0,745 0,859 0,524 0,800 Evaluation Q10_1 Q10_2 Q10_3 0,821 0,789 0,548 0,532 0,727 Attentiveness Q11_1 Q11_2 Q11_3 0,719 0,841 0,745 0,593 0,812 Transaction Q12_1 Q12_2 Q12_3 Q12_4 Q12_5 0,767 0,882 0,822 0,842 0,684 0,644 0,901 Possession Q13_1 Q13_2 Q13_4 Q13_5 0,788 0,776 0,687 0,756 0,688 0,548 0,851
40
According to Bagozzi and Phillips (1991, p.425), discriminant validity refers to “the degree to which measures of different concepts are distinct.” Consequently, in order to be unique and capture some phenomena that other constructs did not, there should be high values for the discriminant validity (Hair et al., 2006). In fact, a high value guarantees that the construct is significantly distinct from related concepts.
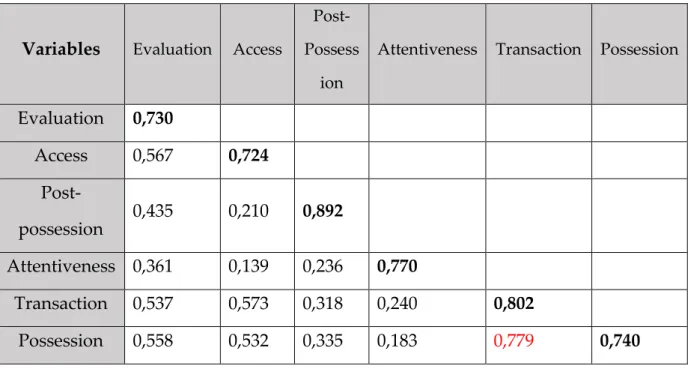
According to Fornell and Larcker (1981), discriminant validity is ensured if “the construct inter-correlations are significantly different from one another, and the shared variance between any two constructs is less than the average variance explained in the items by the construct.” The discriminant validity is visible in the current model, as shown in the correlation matrix (Table 5), wherein the main matrix diagonal values are the square root of the average variance extracted obtained (Fornell & Larcker, 1981) from Table 4 and the remaining elements are correlations. However, as we stated before even using the modification indices, one problem of discriminant validity remained. As we can see in the following matrix, the square root of the AVE for Possession is less than the absolute value of the correlations with Transaction. This means that there is a significant relationship between the two dimensions and that both are very similar. In order to understand the dimension of this problem, an exploratory factor analysis (EFA) was conducted to check for existence of only one factor, however the results have confirmed the existence of two factors with the
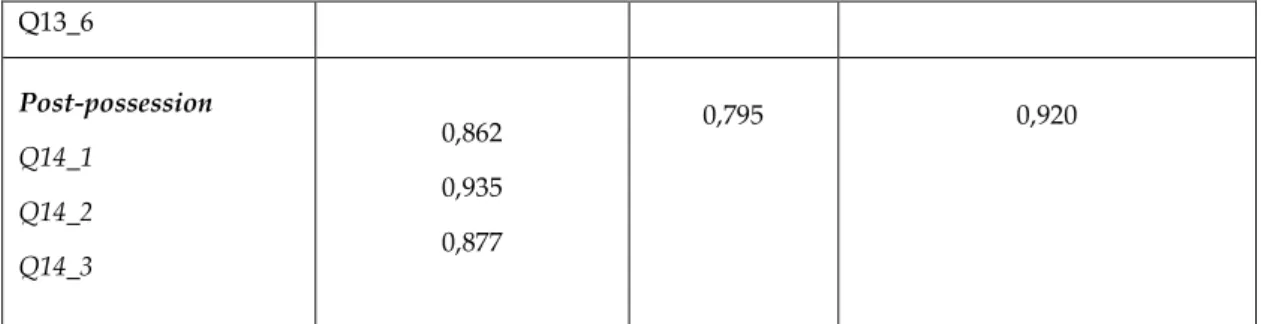
Q13_6 Post-possession Q14_1 Q14_2 Q14_3 0,862 0,935 0,877 0,795 0,920
Table 4: Results from the CFA: Reliability, average variance extracted and factor loadings of
41
variables initially in proposed for each construct. Despite the fact that constructs are very similar, with the support of the EFA, we decide to retain both constructs in the model, ensuring its integrity. These results indicate that there is margin to improve the measurement of the constructs therefore future researchers should take this into account. The model is not perfect but has a satisfactory adjustment.
Variables Evaluation Access
Post-Possess
ion
Attentiveness Transaction Possession
Evaluation 0,730 Access 0,567 0,724 Post-possession 0,435 0,210 0,892 Attentiveness 0,361 0,139 0,236 0,770 Transaction 0,537 0,573 0,318 0,240 0,802 Possession 0,558 0,532 0,335 0,183 0,779 0,740
Table 5: Correlations between constructs
According to Hair et al. (2006, p.778), “nomological validity is tested by examining whether the correlations among the constructs in a measurement theory make sense. Face validity must be established prior to any theoretical testing when using CFA.” In fact, it is vital to understand each item’s content and correct meaning in order to define the measurement theory in a correct way. To test the nomological validity of the model, it was necessary to conduct research and then analyze the scales’ fundamental and founding principles. It was proved that the scales used in the current study passed the nomological validity test.
42
4.3 Structural equation model
The conceptual model proposed in this master’s thesis (Figure 1) involves various relationships between constructs, which should be tested simultaneously. Consequently, structural equations modelling (SEM) was used in order to validate the model by measuring all the suggested construct relationships simultaneously. As previously stated, the model was computed with AMOS v23.0, with the maximum likelihood discrepancy estimation method. The model has six constructs, 23 observed variables out of a total of 88, considering measurement and latent variable errors and inter-correlations between the latent constructs.
Some inter-correlations were done in order to obtain a better fit model: eQ175 “I am proud to say to others that I am this company’s customer” with Q176 “I strongly recommend people to buy products online from this company”. Correlating eQ171 “I always share my knowledge and information.” with eQ172 “I always read online consumer reviews when I was shopping.” and the pair eQ174 “I speak of this company’s good sides” with eQ176 “I strongly recommend people buy products online from this company” we can obtain better adjustments. From this point further, changes have no significant gains or are not theoretically supported. The scales internal consistency of Satisfaction (𝛼 =0,770), Behavioral Intentions (𝛼 =0,924) and e-Wom (𝛼 =0,772) were measured using the Cronbach’s α value. All of the values obtained are higher than 0.7, revealing an adequate reliability.
The null model (χ2 = 855,395, df = 513), defined as a single-factor model without measurement errors (Hair et al., 1998), has a statistical significance level of 0.000. The normed chi-square (χ2 /df) has a recommended level range between 1.0 and 2.0. The current model chi-square equals 1,667 (855,395/513), corresponding to the recommended values. The incremental fit index (IFI), Tucker-Lewis index (TLI), and comparative fit index (CFI) all reveal acceptable
43
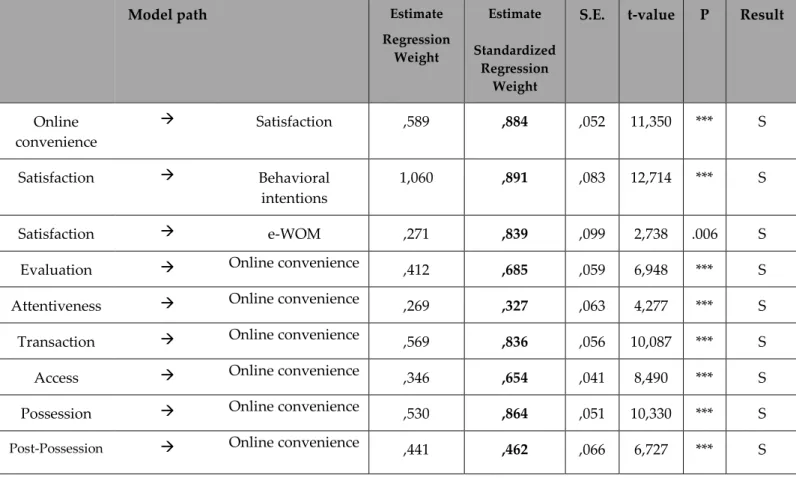
results. These indices should present values above 0.900 (Hair et al., 1998). In the current model, IFI = 0,93; TLI = 0,93, and CFI = 0.93. Regarding the root mean square error of approximation (RMSEA), acceptable models typically have values below 0.10, while values that are greater than 0.10 indicate an unacceptable fit (Browne & Cudeck, 1992). According to Thompson (2004), values below 0.08 are desirable and those below 0.05 are considered outstanding. The current model has an RMSEA of 0.52, which represents a good result, since it way below 0.8. That being sad, the path coefficients from SEM analysis are presented in table 6 with the standardized parameter estimate in bold. All the hypothesis showed statistically significant values. The analysis of the paths between factors revealed that Possession (H6), Transaction (H5) and Evaluation (H3) are the dimensions with more weight (represented in figure 3, with the path of standardized parameter estimate in bold). Contrariwise, Post-possession (H7) and Attentiveness (H4) have demonstrated less influence in online convenience. Besides that, the greater the perceived access convenience, the greater its perceived overall online convenience (H1). Moreover, according with table 6, the greater the perception of overall convenience, the greater the satisfaction (H8). Then, the higher the satisfaction with the service provided the higher the customer's likelihood to repurchase in the same website (H9) and higher the customers’ willingness to share with others their opinion about the online experience (H10). In other words, satisfied customers are more likely share the experience and recommend the company.
44
*** p<0.001; Notes: S= supported;
Table 6: Regression weights, Standardized Regression Weights and probability associated
The structural equation model is presented in Figure 3, with the standardized parameter estimate above and t-value below the arrow. To conclude, the tests performed reveal that the model proposed fits the data well in the population from which the sample was originated. As a result H1 (β= 0,65, t=10,330, p<0,001), H3 (β= 0,69, t=6,948, p<0,001), H4 (β= 0,33, t=4,277, p<0,001), H5 (β= 0,84, t=10,087), p<0,001), H6 (β= 0,86, t=10,330, p<0,001), H7 (β= 0,46, t=6,727, p<0,001), H8 (β= 0,88, t=11,350, p<0,001), H9 (β= 0,89, t=12,714, p<0,001), H10 (β= 0,84, t=2,738, p<0,006) are all supported.
Model path Estimate
Regression Weight Estimate Standardized Regression Weight
S.E. t-value P Result
Online convenience Satisfaction ,589 ,884 ,052 11,350 *** S Satisfaction Behavioral intentions 1,060 ,891 ,083 12,714 *** S Satisfaction e-WOM ,271 ,839 ,099 2,738 .006 S
Evaluation Online convenience ,412 ,685 ,059 6,948 *** S
Attentiveness Online convenience ,269 ,327 ,063 4,277 *** S
Transaction Online convenience ,569 ,836 ,056 10,087 *** S
Access Online convenience ,346 ,654 ,041 8,490 *** S
Possession Online convenience ,530 ,864 ,051 10,330 *** S
45
Model fit indices: chi square = 855,395; df = 513 (p<0.00); CFI=0,93; TLI =0,93; IFI = 0.93; RMSEA=0,52
46
Chapter 5
Discussion and findings
Our main goal was to investigate the convenient dimensions that influence consumers’ intention to engage in online shopping. Therefore, in order to answer this question, an evaluation of online shopping services was performed from customers’ perspective. Previous studies that investigated convenience have somehow ignored some constructs, beliefs in level of websites capability and customers’ motivations. However, our study has successfully included factors such as e-WOM and behavioral intentions, explained by the satisfaction construct. In other words, our investigation proves a deep connection between satisfied consumers and their willingness to reuse and recommend the online service. Thus, H9 and H10 were successfully supported. This inclusion was important because e-WOM and Behavioral Intentions proved to be relevant indicators of system success and customer loyalty. According to our results, which concerns Satisfaction, the greater perceived overall convenience, the greater the impact on customer this dimension (H8). This conclusion was important because Satisfaction is a major factor in maintaining and improving competitive advantage and our study reveals that a convenient experience can help to ensure a better positioning of companies in the marketplace.
Besides that we were also able to conclude that online convenience is a multidimensional construct composed by dimensions such as: access, attentiveness, evaluation, transaction, possession and post-possession. All the studied dimensions demonstrated to have influence in online shopping convenience. In other words: the entire hypothesis proposed by our model were
47
supported. Possession was considered the dimension more importantly (H6) and attentiveness (H4) was the one with less weight in the online consumer buying process. Access (H1), Evaluation (H3) and Transaction (H5) also have revealed significant influence. Along with attentiveness, post-possession is one of the dimensions with less importance for consumers’ online experiences (H7). The results obtained allow us to better understand the crucial role that convenience has in online customers’ behavior and intention. The results also provide insights into the opportunities and risks that are part of the online experience. Overall, this study provides important insights into online consumers’ behavior, and the outputs represent important information for all online retailers. The theoretical implications of this study and contributions will be analyzed in the next sub-chapter.
5.1 Theoretical implications and contributions
Consumers’ service convenience perceptions are influenced not only by the characteristics of the service and individual consumer differences but also by firm-related factors. Marketers can do much to improve consumers’ convenience perceptions. They can lower consumers’ actual time and effort costs in many cases and improve the quality of consumers’ waiting time for service. (Berry et al.,
2002). The results of this study support this idea. To begin with, the analysis of
the factors' paths revealed that Possession is the dimension that most influences the perception of online convenience. Possession convenience has turned out to be the foremost driver of overall shopping convenience. This dimension is the main reason why consumers engage in online shopping – to get the intended product without investing resources such as time and effort. Thus, obtain the intended product with a minimal amount of effort, undamaged and delivered in a timely fashion are some of the main motives that lead consumers to do online shopping. Possession convenience occurs when the virtual product becomes real
48
and in perfect conditions. Although Beauchamp & Ponder (2010) affirm in their study that one of the principal motives for selecting traditional stores over online stores is the ability to leave the store with the desired product, we can assume from our study, that online customers are not obsessed with the delivery time, they still prefer to continue shopping online in order to avoid dealing with the physical effort.
Transaction also presents a strong impact in the perceived overall convenience. As we stated before, we proved that ease in finalizing or amending a purchase surely makes the difference. Thus, we agree with the Berry et al., (2000) argument that transaction convenience demonstrated an evident impact in online shopping because generally waiting to pay is especially ungrateful for consumers. The Wall Street Journal reports studies in which 83% of women and 91% of men indicate that long checkout lines have prompted them to stop patronizing a particular store (Berry et al., 2000). Online shopping facilitates the check-out process due to the fact that this task it is conducted by the consumer and doesn't take too much time to be completed. The entire process can be done from home, enabling customers to save time and effort, as intended. Besides that, flexible payment methods entice and motivate consumer’s engagement.
With respect to evaluation, this dimension also revealed some notoriety in the online consumer perspective. Looking for an appropriate product on a web site is often time-consuming even when customers know specifically what they want. In online platforms customers can research and compare products and costs without physically visiting different locations to find their intended product. Thus, as proven in our study, is extremely important for customers to have detailed descriptions and images of the product since intangibility is one of the major obstacles to shopping online. Extensive and clear descriptions will clarify consumers about the product composition and appearance, and will make him/her feel more confident about the purchase. This type of exhibition also allows the consumer to know the product and compare it with others which can
49
reduce which can reduce the need for further exchanges and the probability of disappointment with the service.
It seems important for online consumers to have the advantage of shopping at any time, wherever they are, without any kind of effort (access convenience). As stated in the literature review, by Zhilin Yang et al., (2013) consumers enjoy the benefits of accessibility to products and stores that are not available or close to the location where they reside or work through a simple and always available website.
Post-possession is concerned with the easily to return unwanted products. In our study, it was revealed as one of the dimensions with less importance. Nevertheless consumers must be properly secured of company’s exchange policies in order to feel secure and do not be afraid to engage in an online purchase. Regarding attentiveness, this factor presents the lower value (β= 0,33) when compared with other dimensions. Customizing the service is the least important dimension according with customers’ perceptions. Luedi (1997) and Madu (2002) argued that the rivalry in the Web marketplace places online retailers in a situation where simply exposing product or service catalogs on the Web is not enough to consumer loyalty. However, we realise that online consumers continue to give more importance to save the non-monetary costs than having a special treatment or service.
Our study has also demonstrated that Satisfaction was proven to be a key indicator of e-WOM and Behavioral Intentions. As Hsu et al. (2010) advocated, when customers can conveniently and easily experience the benefits of the services, they are more likely to be satisfied, repeat the process and recommend the company to others. Thus, our investigation concluded that customers who have good experiences with a retailer are more likely to engage in positive word of mouth, reuse the service and strongly recommend people to buy products online from the company.