Pollination services mapping and economic valuation
from insect communities: a case study in the Azores
(Terceira Island)
Ana Picanço1, Artur Gil2, François Rigal1,3, Paulo A. V. Borges1
1 CE3C – Centre for Ecology, Evolution and Environmental Changes/Azorean Biodiversity Group and Univ. dos Açores, Faculty of Agriculture and Environment, Department of Environmental Sciences and Engineering, PT-9700-042, Angra do Heroísmo, Açores, Portugal 2 CE3C – Centre for Ecology, Evolution and Envi-ronmental Changes, Azorean Biodiversity Group, University of the Azores, Faculty of Sciences and Technology, Department of Biology, 9501-801, Ponta Delgada, Portugal 3 Environment and Microbiology Team, Univer-sité de Pau et des Pays de l’Adour, IPREM UMR CNRS 5254, BP 1155, 64013 Pau Cedex, France Corresponding author: Ana Picanço ([email protected])
Academic editor: Peter May | Received 19 December 2016 | Accepted 10 April 2017 | Published 5 May 2017 http://zoobank.org/72C7E56E-1532-48DF-A28E-6FCD569BADF5
Citation: Picanço A, Gil A, Rigal F, Borges PAV (2017) Pollination services mapping and economic valuation from insect communities: a case study in the Azores (Terceira Island). Nature Conservation 18: 1–25. https://doi.org/10.3897/ natureconservation.18.11523
Abstract
Insect pollinators provide vital ecosystem services through its maintenance of plant biological diversity and its role in food production. Indeed, adequate pollination services can increase the production and quality of fruit and vegetable crops. This service is currently challenged by land use intensification and expanding human population growth. Hence, this study aims: (1) to assess the pollination services in different land uses with different levels of disturbance through GIS mapping technique using insect pol-linators abundance and richness as indicators, and (2) estimate the economic value of pollination by insects in agricultural crops. Our study takes place in a small oceanic island, Terceira (Azores, Portugal). Our results showed, remarkably, that not only the pristine vegetation areas, but also the orchards and agricultural areas have relatively high values of pollination services, even though both land uses have op-posite disturbance levels. For the economic valuation, we analyzed 24 crops in the island and found that 18 depend on pollinators with one-third of these crops having 65% or 95% dependence on pollinators. The economic contribution of pollinators totals 36.2% of the total mean annual agricultural income of the dependent crops, highlighting the importance of insect pollinators in agricultural production and consequent economic gain productions.
http://natureconservation.pensoft.net
Copyright Ana Picanço et al. This is an open access article distributed under the terms of the Creative Commons Attribution License (CC BY 4.0), which permits unrestricted use, distribution, and reproduction in any medium, provided the original author and source are credited.
Keywords
Ecosystem service, GIS, pollination, insects, agriculture, economic value
Introduction
Research at the interface of ecology and economics to characterize, value, and man-age ecosystem services (henceforth ES) has supported a paradigm shift in how society thinks about biodiversity, ecosystems and human relationships to them (MEA 2005; TEEB 2010; Garbach et al. 2014). This awareness of the ES started with classical pa-pers of Daily (1997) and Constanza et al. (1997); and in 2005, the Millennium Eco-system Assessment (MEA) promoted and defined the concept of ES as “the benefits that humans recognize as obtained from ecosystems that support, directly or indirectly, their survival and quality of life”. MEA suggests to group ES into four categories: (1) provisioning services, such as food, water, timber, and fiber; (2) regulating services that affect climate, floods, disease, wastes, and water quality; (3) cultural services that provide recreational, aesthetic, and spiritual benefits; and (4) supporting services such as soil formation, photosynthesis, and nutrient cycling (MEA 2005).
The valuation and mapping of ES constitutes a continuous and very complex work for several national governments and organizations, and this process is only currently available for few countries (e.g. Portugal, Pereira et al. 2009; UK, Maresca et al. 2011; France, Watson et al. 2011). ES assessment aims usually to estimate of the marginal values of these services to inform decisions and to evaluate how trade-offs in ES provi-sion will affect human well-being. Therefore, researchers are interested in developing methods for quantifying the provision and value of ES so this information can be incorporated into mapping, planning and decision-making at different scales and in different public and private sectors (see e.g., Losey and Vaughan 2006; Allsopp et al. 2008; Gallai et al. 2009; Nelson et al. 2009; Tallis and Pollaski 2009; Villa et al. 2009; Maes et al. 2012; Nemec and Raudsepp-Hearne 2013; Nahuelhual et al. 2013; 2015).
Pollination together with seed dispersal is considered as one of the key ES, classi-fied by the Common International Classification of Ecosystem Services (CICES) cod-ing system (Haines-Young and Potschin 2013) as a “Regulation & Maintenance ES” with the code 2.3.1.1. Among other studies, Klein et al. (2007), Aizen et al. (2009), Gallai et al. (2009), Calderone (2012) and Giannini et al. (2015) show that pollination services contribute significantly to the agricultural production and subsequently as-sures 75% of food production worldwide (Klein et al. 2007) (as well as to other flower-ing plants) by ensurflower-ing plant reproduction, fruit set development and dispersion (e.g. Ollerton et al. 2011; Altieri et al., 2015). Notably, the pollination of some vegetable crops (e.g. cabbage and other brassicas, carrots, turnips, lettuce, chicory and onions) increases the quality of the seed production (Gallai and Vassière 2009). In addition, insect pollinators enhance fruit and seed quality (Garibaldi et al 2013; Bartomeus et al 2014; Garratt et al. 2014; Marini et al. 2015; Saeed et al. 2016) and reinforces pest management (Cross et al. 2015) which constitutes an indirect and difficult benefit to
measure, but extremely important for the agricultural market. Also, a recent study on pollination by wild insect pollinators has showed their capacity to increase the seed production in 41 agricultural systems globally, regardless of the abundance of honey bees (Garibaldi et al. 2013). Additionally, it was also documented that wild insect pollinators can buffer the impact of climate change on crop production (Rader et al. 2013), most likely due to their high biological diversity that can in turn stabilize ES against habitat disturbances (Cardinale et al. 2012).
Besides these findings, there is also a general consensus that native pollinators abun-dance and richness are declining throughout the world (Ghazoul 2005; Biesmeijer et al. 2006; Winfree et al. 2009). This global decline has sparked the formation of a global policy framework for pollinators, primarily through the International Pollinator Initiative within the Convention of Biological Diversity (CBD) and several other programs (e.g. Food and Agricultural Organization (FAO) Global Action on Pollination Services for Sus-tainable Agriculture; Bee Life European Beekeeping Coordination). All of these initiatives emphasize the need to assess and monitor the pollinators in different regions in order to better plan their conservation, restoration and to preserve the ES they supply for humans.
The Intergovernmental Platform on Biodiversity and Ecosystem Services (IPBES) from United Nations Environment Programme (UNEP; Zisenis 2015; Schmeller and Bridgewater 2016) was recently created as a Knowledge-Policy interface (Díaz et al. 2015; Schmeller and Bridgewater 2016). In the fourth plenary of IPBES (IPBES-4) the agenda’s item 5 (work programme of the Platform) included the development of works towards the approval of the thematic assessment on pollinators, pollination and food production (“Deliverable 3a” - see http://www.ipbes.net/workprogramme/ pollination). This “Deliverable 3a” highlighted substantial knowledge gaps in different regions on the status and trend of pollinators and pollination, making the global as-sessment of insect pollinators (henceforth IP) not possible due to lack of data, although regional and national assessments indicated that more than 40 % of insect pollinators are threatened locally (Schmeller and Bridgewater 2016).
These knowledge gaps unveil how the interactions between plants and insects are numerous and complex. So, the understanding of how plant-insect species’ interactions affect ecological functions and are affected by land management (Kremen et al. 2007) is central to maintain and enhance associated ES. As a vital and increasingly threatened ES, pollination (Klein et al. 2007; Potts et al. 2010) has become an often-cited example of how the ES are economically valuable (Hanley et al., 2015). Two additional recent ex-amples of studies about ES pollination in Europe (EU) that complement each other are from Leonhardt et al. (2013) and Schulp et al. (2014), both showing results that provide an overview of ES importance, variation and influence throughout European regions.
In this work, we assess the ES provision and values provided by insect pollinators in the Azores archipelagic region (Portugal) where few studies on ES assessment (e.g. Cruz et al. 2011; Mendonça et al. 2013; Vergílio et al 2016) or related to pollina-tion and seed dispersal services have been undertaken (e.g. Pereira 2008; Heleno et al. 2009; Olesen et al. 2002, 2012). We use a database on the spatial distribution of insect pollination in Terceira Island (Azores) recently collected (Picanço et al. 2017)
to provide the first insight of the bees and other IP contribution to the pollination services and for assessing pollination-related ES in a small oceanic island. With this purpose, we applied two types of methodological approaches: (1) mapping pollina-tion services with geographic informapollina-tion systems (GIS; e.g. Nemec and Raudsepp 2013) using bees and other IP abundance and richness numerical values as indicators; and (2) economic valuation - through the production function approach - by using crops production estimates and crops dependence ratio (Klein et al. 2007; Gallai and Vassière 2009; Hanley et al. 2015). Our goals were to determine: (I) the spatial varia-tions of the pollination services; (II) whether the variavaria-tions of the pollination services were influenced by the different land-uses and/or level of disturbance; (III) the number of crops for which production has a certain level of dependence on IP (or vulnerability ratio); and (IV) estimation of the island’s IP economic value.
Methods
Study area and sampling sites
Terceira Island, with an area of approximately 402 km2 (length=29 km and width
=17 km) is a small island of the central group of the Azores archipelago (Portugal), lo-cated in the North Atlantic Ocean (38°37'N, 38°48'N, 27°02'W, 27°23'W). Like the other islands of the archipelago, Terceira is of volcanic origin and the third oldest island after Santa Maria and São Miguel, with an age of about 3,52 million years (Forjaz et al. 2004). The island is formed by four main volcanic complexes namely Cinco Picos, Guilherme Moniz, Pico Alto and Serra de Santa Bárbara, the latter corresponding the highest point of the island (1023 meters).
Terceira climate is temperate oceanic, characterized by both high levels of relative atmospheric humidity and low temperature fluctuations throughout the year. Particu-larly, winter and autumn are marked by heavy and regular precipitations often associated with strong winds. The average annual precipitation exceed 3400 mm in “Serra de Santa Bárbara” summit, and reaches almost 1000 mm per year in all the island. The average annual temperature varies between 9°C in “Serra de Santa Bárbara”, to 17°C on the coast. Minimum temperature in the winter varies between 4°and 12°C while maximum temperature in the summer varies between 14°and 26°C (Azevedo et al 2004).
The insects (Suppl. material 1: Table S1) were observed from five relevant habitat types, corresponding to an increasing gradient of disturbance, namely natural forests (NatFor) mainly characterized by Juniperus-Ilex montane forests and Juniperus wood-lands, naturalized vegetation areas (NatVeg) composed by Pittosporum spp. and Rubus spp., exotic forests (ExoFor) with Criptomeria japonica and Eucalyptus sp., semi-natu-ral pastures (SemiPast) with Lotus sp., Holcus sp., Rumex sp. and intensively managed pastures (IntPast) with Lolium sp. and Trifolium spp.. These habitat types were previ-ously selected according to landscape disturbance index from Cardoso et al. (2013; see supporting information), with the aim to assess the impact of land-use change on
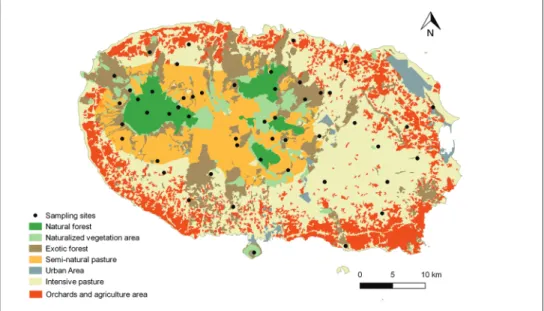
flower-visiting insect species community structure in Terceira Island (for further de-tails see Picanço et al. 2017). In each habitat type, 10 sites were selected. In each site, 10 meters’ linear transects with 1 meter width were set up (Pollard and Yates 1993), making a total of 50 transects located across the entire island (Fig. 1) (for further details on the sampling protocol see Picanço et al. 2017).Ecosystem service mapping
Digital Elevation Models (DEM) are a numerical representation of topography, made up of squared equal-sized grid cells (pixels) with an elevation value associated to each pixel. DEM constitute the most widely used data structure to store and analyze topographic information in GIS (Rishikeshan et al. 2014). The pollination service mapping was performed with the ArcGIS10© software, by applying the “Topo to Raster” interpolation technique, which was designed for the creation of hydrologically correct DEMs. This method uses an iterative finite difference interpolation technique. It is optimized to have the computational efficiency of local interpolation methods, such as inverse distance weighted (IDW) interpolation, without losing the surface con-tinuity of global interpolation methods, such as Kriging and Spline. It is essentially a discretized thin plate spline technique for which the roughness penalty has been modi-fied to allow the fitted DEM to follow abrupt changes in terrain. Furthermore, the quantity of input data can be up to an order of magnitude less than that normally re-quired to adequately describe a surface with digitized contours, further minimizing the expense of obtaining reliable DEMs (Wahba, 1990, Hutchinson 1988, 1993, 2011; ESRI 2016).In this work, DEM were generated using respectively as elevation data the bees and insect pollinators’ abundance and richness quantitative information collected from field surveys, of the 10 transects of each habitat type (or land use). We’ve chosen to separate the bees and total insect pollinators data, because many studies about pol-lination services are more related to bees than to the insect pollinators in general, and also, to analyze if there would be differences between the DEM of the possible pollina-tion services contribupollina-tion from these two groups of data. This latter also applies relat-ing to the abundance (i.e. number of individuals) and richness (i.e. number of species) information on both groups (Suppl. material 1: Table S1). In this way, by applying all the fieldwork data, we intend to be more accurate as possible while developing DEM that deliver information on pollination services.
To complement this spatial analysis, we applied the formerly mentioned index of landscape disturbance metric based on the attributes of the landscape matrix (Cardoso et al. 2013). This index, ranging from 0 to 100, corresponds to a local index of distur-bance by taking into account the level of disturdistur-bance in the surrounding areas. Values of the disturbance index (D) was obtained by ranking the different land uses attribut-ing a value of “local disturbance” (L) on a land use map of 100 × 100 m resolution built from aerial photography and fieldwork, and for each 100 × 100 m cell the D was calculated (see Cardoso et al. 2013 and Suppl. material 1: Fig. S1).
For each analysis, we overlaid the respective pollination services’ interpolation maps delivered by the fieldwork data on bees and other insect pollinators from Picanço et al. (2017) with the land use and the disturbance index D. We’ve created thresholds to ana-lyze disturbance index D influence on the amount and diversity of bees and other insect
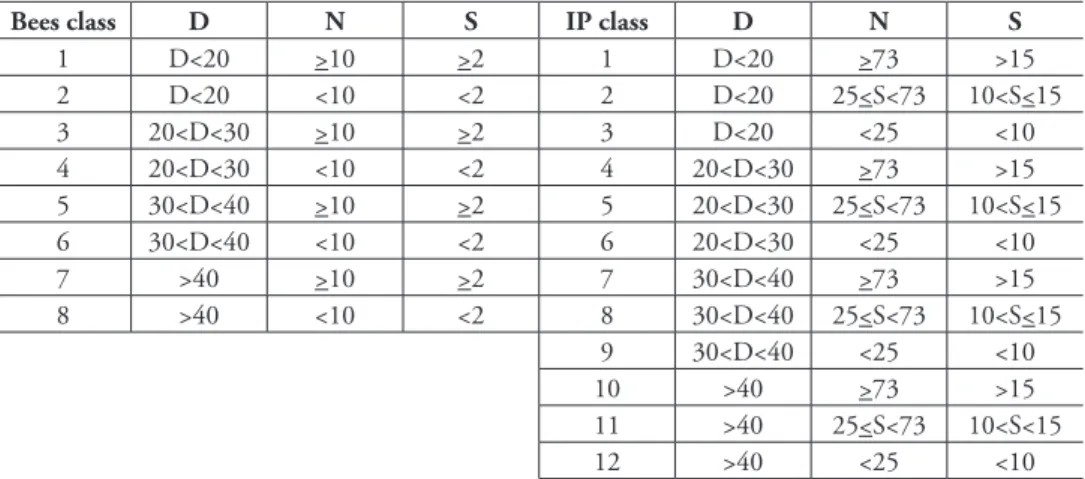
pollinators and mapped these categories in eight classes for bees’ abundance (N) and richness (S); and in 12 classes for insect pollinators’ abundance (N) and richness (S). The created thresholds values for the different classes are specified in Table 1. The numbers of classes established follow the minimum and maximum abundance and richness values (Suppl. material 1: Table S1) obtained by Picanço et al. (2017) for the different habitat types - natural forest, naturalized vegetation areas, exotic forest, semi-natural pasture and intensively managed pasture. The exceptions are urban, agriculture and orchard areas due to unavailable technical resources. Bees (Hymenoptera) a very important functional group, are constituted by the following most abundant species Apis mellifera, Bombus ruderatus and Lasioglossum spp., while the other wild insect pollinators groups are consti-tuted by Coleoptera, Diptera and Lepidoptera, being the most abundant species Anaspis proteus, Meligethes aeneus, Stomorhina lunata, Rhinia apicalis, Episyrphus balteatus, Erista-lis tenax, Hipparchia azorina azorina and Pieris brassicae (for further information related to the species list see Suppl. material 1: Table S1 in supporting information).
The disturbance level was organized in four classes, including a first one with very low disturbance level typical of high altitude native forests (D<20), two intermedi-ate classes and finally a class with high levels of disturbance (D>40). The number of individuals of bees was divided in two classes in a logarithm scale (less than ten and more than ten individuals). The number of species of bees was divided in two classes with one species and two or more species. For insect pollinator abundance and rich-ness three classes were prepared: for abundance, we created one for the rarest species, one for intermediate and one for the most abundant; for species richness we divided the classes arbitrarily in less than 10 species, 10 to 15 and more than 15 (see Table 1). These created classes were evaluated through a quantitative analysis of the area covered by each class in Terceira Island.Economic valuation
Terceira Island’s main economic activity is agriculture, with the production of dairy products and raising livestock. Many small farmers practice subsistence agriculture or produce in small quantities to cooperatives. The island consumer is relatively similar to the southern Europe consumers, when comparing the GDP per capita of Azores region and Portugal to other countries of Europe (Suppl. material 1: Tables S2, S3), with Azorean economy comprising a conventional interval of prices elasticities -1.2 and -0.8, as in Gallai and Vassière (2009).
FRUTER/Frutercoop is the “Association of Producers of Fruit, Vegetables and Flowers’ in Terceira Island”. Using their data from 2011 to 2015, we calculated the mean annual productions of 24 common fruits and vegetables in this island. Five-year means were used instead of the latest yearly production figures, in order to smooth out annual variations in crop output.
We estimated the value of pollination gain in agricultural crops and its respective vulnerability by using the crop production amount (Kasina et al. 2009), market and producer prices for each crop. This method was adapted to a regional rating scale, according to the methodology of FAO (Gallai and Vaissière 2009) previously developed by Gallai et al. (2009). The data on crops were derived from multiple sources: Klein et al. (2007; only for crops grown in Terceira Island), FAO (Gallai and Vaissière, 2009),
Table 1. Distribution of disturbance index (D) for bees’ and insect pollinators’ abundance (N) and
rich-ness (S) per classes.
Bees class D N S IP class D N S
1 D<20 >10 >2 1 D<20 >73 >15 2 D<20 <10 <2 2 D<20 25<S<73 10<S<15 3 20<D<30 >10 >2 3 D<20 <25 <10 4 20<D<30 <10 <2 4 20<D<30 >73 >15 5 30<D<40 >10 >2 5 20<D<30 25<S<73 10<S<15 6 30<D<40 <10 <2 6 20<D<30 <25 <10 7 >40 >10 >2 7 30<D<40 >73 >15 8 >40 <10 <2 8 30<D<40 25<S<73 10<S<15 9 30<D<40 <25 <10 10 >40 >73 >15 11 >40 25<S<73 10<S<15 12 >40 <25 <10
FRUTER/Frutercoop (2016), and Serviço de Desenvolvimento Agrário da Terceira (2016). We included all plants of economic importance in our dataset, such as those harvested for food, livestock, or for other uses.
The IP dependency for each crop was categorized according to Klein et al. (2007), and posteriorly adapted by Gallai and Vaissière (2009), into the following classes: essential, great, modest, little, increase seed production, increase breeding and no in-crease. We also corresponded the dependence ratio (DR) to these classes according to Gallai et al. (2009): essential, DR = 0.95 (meaning that the value of pollination-driven yield lies between 90 and 100%); great, DR = 0.65 (40–90% of yield is dependent on pollination); modest, DR = 0.25 (10–40% of yield is dependent on pollination) and little, DR = 0.05 (0–10% of yield is dependent on pollination). We multiplied this ratio by the economic value of the mean annual crop production to obtain the pollination services’ economic value (Gallai and Vaissière 2009). The production value was obtained through the market prices and producer prices provided by the regional authority – “Serviços de Desenvolvimento Agrário da Terceira” (2016). For the cur-rent assessment we did not consider currency values, regional or seasonal variations in the crop labour costs and food prices.
Results
Ecosystem service mapping
By analyzing together both the land use map of Terceira Island (Fig. 1) and the four pollination services’ interpolation maps (Fig. 2) we can observe that: (i) bees abundance (N) comprised by some abundant species like Bombus ruderatus and Lasioglossum morio (Suppl. material 1: Table S1) presented higher density values around the northwest,
Figure 1. Land use distribution map of Terceira Island with the selected sampling sites as black dots:
NatFor (natural forests), SemiPast (semi-natural pastures), NatVeg (naturalized vegetation areas), ExoFor (exotic forests), IntPast (intensively managed pastures), urban areas and agriculture areas. Land use carto-graphic sources: DROTRH (2008) and Gaspar (2007).
Figure 2. Pollination services’ interpolation maps: (upper left) bees abundance (N); (upper right) bees
east, south-eastern coast and also at north, near the centre of Terceira island, matching especially with the current areas occupied by orchards and agriculture; (ii) bees rich-ness (S) high density values also correspond mostly to orchards and agricultural areas, namely in the north, along the west to the southern coast and in-between the centre and the eastern side of Terceira island; (iii) insect pollinators (IP) abundance (N) with the most abundant species being Anaspis proteus, Stomorhina lunata, Eupeodes corollae, Sepsis neocynipsea and Pieris brassicae azorensis (Suppl. material 1: Table S1) presented higher density values around the north-western coast till near the center, and also in the eastern and central parts of the island, corresponding these higher density spots to the main Terceira island’s biodiversity hotspots (pristine vegetation forests): “Serra de Santa Bárbara” and “Pico Alto” (that are both classified as protected areas). In the south-eastern coast of the island some orchards and agricultural areas also presented high IP abundance; finally, (iv) insect pollinators (IP) richness (S) comprised by many hoverfly species (Diptera, Syrphidae) when compared to the other insect pollinators groups Coleoptera and Lepidoptera (Suppl. material 1: Table S1) followed a very simi-lar spatial pattern to that of IP abundance. Nevertheless, orchards and agricultural areas in the north-western coast also presented high density values of IP richness.
In order to strengthen the previous analysis, we assessed the influence of the dis-turbance index (D), as calculated by Cardoso et al. (2013), in the pollination services and also assessed the area covered by bees and IP classes within the island (Tables 2–5).
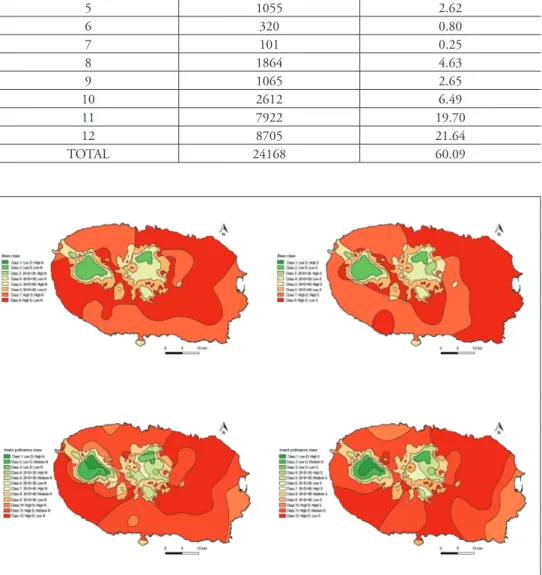
As a result of overlaying each previous pollination service output with the match-ing disturbance index D spatial data (see full description of classes in Table 1), we observed that “Class 1” spatial distribution (areas with disturbance index D lower than 20 and high values for both abundance (N) and richness (S) of bees and IP) corre-sponded in every output to the small areas of pristine vegetation (biodiversity hotspots) at high altitudes and consequent most difficult human access, namely “Serra de Santa Bárbara” and “Pico Alto” protected areas (Fig. 3), which corresponds to the smallest % of island area (between 0.06 – 0.56%) occupied (Tables 2–5).
According to the same Fig. 3 and to Table 1, classes 4 and 6 for bees’ abundance (N) and richness (S) (Table 2 and 3), as well as classes 5 and 8 for IP’s abundance (N) and richness (S) (Table 4 and 5), respectively, are the predominant spatial patterns around class 1’s areas.
Moreover, both bees-related maps (abundance - N and richness - S) in Fig. 3, Ta-bles 2 and 3 show that the whole island is predominantly covered by highly disturbed areas (disturbance index D higher than 40) that seriously affect these pollination ser-vices, resulting in low abundance (N) and richness (S) for bees (classes 7 and 8). In fact, for the bees’ abundance (N), class 8 covers the north to north-eastern coast, pass-ing through the centre until the western coast. Class 7 is predominant from east to the southwestern coast. Regarding the bees richness (S), the class 8 occupies the centre and the area from north to the south-eastern coast, as class 7 covers the areas from north-west to south and the territory between the centre and the eastern coast of the island. Both classes 7 and 8 mostly occur in orchards/agricultural areas, and in IntPast land use, respectively (see Fig.1 and Fig. 3).
Table 3. Spatial assessment of bees’ richness classes in Terceira Island.
Class Total area (ha) % of Terceira Island area
1 24 0.06 2 276 0.69 3 142 0.35 4 2071 5.15 5 1192 2.96 6 3674 9.13 7 13880 34.51 8 15787 39.25 TOTAL 37046 92.11
Table 2. Spatial assessment of bees’ abundance classes in Terceira Island.
Class Total area (ha) % of Terceira Island area
1 225 0.56 2 1325 3.29 3 103 0.26 4 2367 5.89 5 1006 2.50 6 3342 8.31 7 14342 35.66 8 17376 43.20 TOTAL 40086 99,67
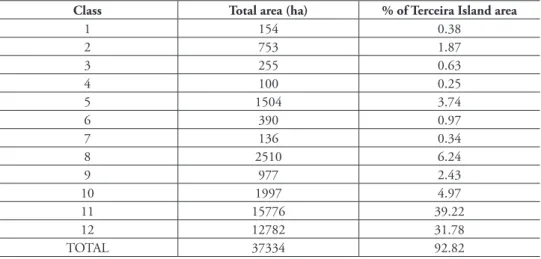
Table 4. Spatial assessment of insect pollinators’ abundance classes in Terceira Island area.
Class Total area (ha) % of Terceira Island area
1 154 0.38 2 753 1.87 3 255 0.63 4 100 0.25 5 1504 3.74 6 390 0.97 7 136 0.34 8 2510 6.24 9 977 2.43 10 1997 4.97 11 15776 39.22 12 12782 31.78 TOTAL 37334 92.82
Table 5. Spatial assessment of insect pollinators’ richness classes in Terceira Island.
Class Total area (ha) % of Terceira Island area
1 117 0.29 2 202 0.50 3 24 0.06 4 181 0.45 5 1055 2.62 6 320 0.80 7 101 0.25 8 1864 4.63 9 1065 2.65 10 2612 6.49 11 7922 19.70 12 8705 21.64 TOTAL 24168 60.09
Figure 3. Classification maps of pollination services according to the influence of disturbance index (D):
(upper left) bees abundance (N); (upper right) bees richness (S); (lower left) insect pollinators abundance (N); (lower right) insect pollinators richness (S).
In the case of IP-related maps (Fig.3, Tables 4 and 5), the spatial pattern of dis-turbance versus pollination services is quite similar to that of bees’ pollination services. Highly disturbed Class 11’s areas (see Table 1) are predominant in the whole island for both IP’s abundance (N) and richness (S), occupying around 39% and 20% respec-tively (Tables 4 and 5). In the case of IP abundance (N), this class covers relevant areas in the north-western, eastern, south-eastern and southern territories of Terceira Island. For IP richness (S), class 11 covers large areas in the west, south and east of Terceira Island (Fig. 3). Most disturbed areas with lower IP-related services (abundance and richness) performance mostly occur in orchards, agricultural areas and other land uses strongly affected by human activity (Fig. 1).
Economic valuation
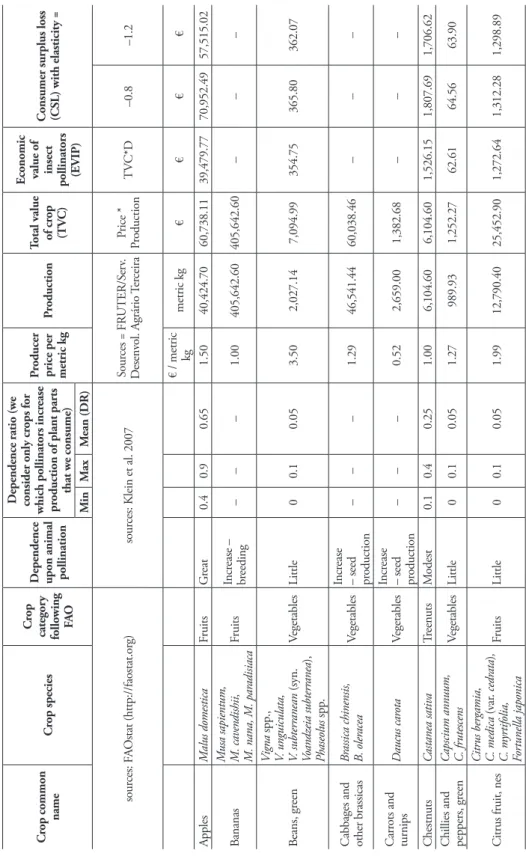
According to the data provided by Frutercoop for the period between 2011 and 2015, the total value of production for the 24 referred crops in Table 6 represented an amount of €874,925.51, from which only 29% of the production is from crops with known pollinator dependence ratio (see Tables 6 and 8).
In terms of welfare, an assessment of the social cost to Terceira Island consum-ers resulting from pollinator decline estimated that the consumer surplus (economic measure of consumers benefit) loss was from €156K to €231K, which reflects the impact on the price of the crop on the market, based upon average price elasticities of −1.2 to −0.8, respectively (Table 7). When considering these values, we must also take into account that the production from Frutercoop represent approximately 54% of the entire island’s production.
Among the 18 crops relatively dependent to IP, the greatest economic value gener-ated by the IP was origingener-ated by the class “little” or DR = 0.05, with 46.9% (€119,833), as well as the one originated by the class “great” or DR = 0.065, with 29.5% (€75,465) (Tables 6 and 8). In each class “little” and “great”, the most representative crop pro-ductions were respectively “tomatoes” and “apples” (Table 6).
On average, in recent years (2011-2015), IP contributed to pollination service in crop production with about €91,957 (total economic value of IP, EVIP), representing 10.5% crops ratio of vulnerability (VR) (Table 7), according to Frutercoop dataset. Extrapolating the IP contribution estimation from Frutercoop production data to the entire island, we can consider the IP value to be of approximately €170,291. This value represents about 36.2% of VR from the mean annual agricultural income (€469,867) resulting from the dependent crops.
Discussion and conclusions
Under the same thematic as “Deliverable 3a” from IPBES (Schmeller and Bridgewater 2016) – i.e., assessment of the contribution of insect pollinators to the pollination and
Tab
le 6.
Array of cr
ops used dir
ectly for human food follo
wing F AOST AT and listed b y common names of cr ops. C
rop common name
C rop species Cro p categor y follo wing FA O D ependence
upon animal pollination
D
ependence ratio (w
e
consider only cr
ops for
which pollinators incr
ease
pr
oduction of plant par
ts
that w
e consume)
Pr
oducer
price per metric kg
Pr oduction Total v alue of cr op (T V C)
Economic value of insect pollinators (E
VIP)
Consumer surplus loss (CSL) with elasticity =
Mi n Ma x M ean (DR) sour ces: F AO stat ( http://faostat.org ) sour
ces: Klein et al. 2007
Sour ces = FR UTER/S er v. D esenv ol. Agrário T er ceira Price * Pr oduction TV C*D –0.8 –1.2 € / metric kg metric kg € € € € Apples M alus domestica Fr uits G reat 0.4 0.9 0.65 1.50 40,424.70 60,738.11 39,479.77 70,952.49 57,515.02 Bananas M usa sapientum, M. cav endishii, M. nana, M. par adisiaca Fr uits Incr ease – br eeding – – – 1.00 405,642.60 405,642.60 – – – Beans, gr een Vigna spp ., V. unguiculata, V. subterr anean (syn. Voandz eia subterr anea ), Phaseolus spp . Vegetables Little 0 0.1 0.05 3.50 2,027.14 7,094.99 354.75 365.80 362.07
Cabbages and other brassicas
Br assica chinensis, B. oler acea Vegetables Incr ease – seed production – – – 1.29 46,541.44 60,038.46 – – – Carr ots and turnips D aucus car ota Vegetables Incr ease – seed production – – – 0.52 2,659.00 1,382.68 – – – Chestnuts Castanea sativ a Tr eenuts M odest 0.1 0.4 0.25 1.00 6,104.60 6,104.60 1,526.15 1,807.69 1,706.62
Chillies and peppers, gr
een Capscium annuum, C. fr utescens Vegetables Little 0 0.1 0.05 1.27 989.93 1,252.27 62.61 64.56 63.90 Citr us fr uit, nes Citr us bergamia, C. medica (v ar . cedr ata ), C. myr tifolia, For tunella japonica Fr uits Little 0 0.1 0.05 1.99 12,790.40 25,452.90 1,272.64 1,312.28 1,298.89
C rop common name
C rop species Cro p categor y follo wing FA O D ependence
upon animal pollination
D
ependence ratio (w
e
consider only cr
ops for
which pollinators incr
ease
pr
oduction of plant par
ts
that w
e consume)
Pr
oducer
price per metric kg
Pr oduction Total v alue of cr op (T V C)
Economic value of insect pollinators (E
VIP)
Consumer surplus loss (CSL) with elasticity =
Mi n Ma x M ean (DR) C ucumbers and gher kins Cucumis sativus Vegetables G reat 0.4 0.9 0.65 0.79 6,695.04 5,289.08 3,437.90 6,178.55 5,008.41 Figs Ficus carica Fr uits M odest 0.1 0.4 0.25 10.00 1,098.22 10,982.20 2,745.55 3,252.04 3,070.21
Lemons and limes
Citr us aur antifolia, C. limetta, C. limon Fr uits Little 0 0.1 0.05 2.79 5,669.94 15,819.13 790.96 815.59 807.27
Lettuce and chicor
y Lactuca sativ a, Cichorium intybus, C. endivia Vegetables Incr ease – seed production – – – 4.06 36,104.51 146,584.31 – – – O nions (inc. shallots), gr een Allium cepa, A. ascalonicum, A. fistulosum Vegetables Incr ease – seed production – – – 0.88 4,732.20 4,140.68 – – – O ranges Citr us aur antium, C. sinensis Fr uits Little 0 0.1 0.05 1.19 3,750.00 4,443.75 222.19 229.11 226.77 O ther melons (inc.cantaloupes) Cucumis melo Vegetables Essential 0.9 1 0.95 2.99 6,327.10 18,918.03 17,972.13 77,617.29 42,633.64
Peaches and nestarines
Pr unus persica, P ersica laevis Fr uits G reat 0.4 0.9 0.65 1.99 90.22 179.54 116.70 209.73 170.01 Pears Pyr us communis Fr uits G reat 0.4 0.9 0.65 1.50 463.10 694.65 451.52 811.47 657.79
Plums and sloes
Pr unus domestica, P . spinosa Fr uits G reat 0.4 0.9 0.65 1.99 4,303.30 8,563.57 5,566.32 10,003.71 8,109.14
Pumpkins, squash and gour
ds
Cucurbita maxima,
C. mixta, C. moschata, C. pepo
Vegetables Essential 0.9 1 0.95 3.80 1,329.14 5,050.73 4,798.20 20,722.25 11,382.32 Strawberries Fr agaria spp . Fr uits M odest 0.1 0.4 0.25 3.89 3,064.24 11,919.89 2,979.97 3,529.71 3,332.35 Sw eet potatoes Ipomoea batatas
Roots and Tubers
Incr ease – br eeding – – – 1.49 1,079.90 1,609.05 – – – Tomatoes Ly copersicon esculentum Vegetables Little 0 0.1 0.05 2.64 24,889.46 65,770.40 3,288.52 3,390.94 3,356.34 W atermelons Citr ullus lanatus Vegetables Essential 0.9 1 0.95 0.69 10,512.90 7,253.90 6,891.21 29,761.46 16,347.38 TO TAL OR MEAN 0.28 0.52 0.40 2.29 27,273.44 874,925.51 91,957.09 231,024.67 156,048.13
Table 8. Mean annual production values of crops with different pollinator dependency categories, for the
period from 2011 to 2015.
Crop dependency classPollinator Pollinators DR production (kg)Mean annual
Beans, green; chillies and peppers, green; citrus fruit;
lemons and limes; oranges; tomatoes Little 0.05 50,116.87
Chestnuts, figs; strawberries Modest 0.25 10,267.06
Apples; pears; peaches and nectarines; plums and sloes;
cucumbers and gherkins Great 0.65 51,976.36
Pumpkins; squash and gourds; watermelons and other
melons Essential 0.95 18,169.14
Bananas; cabbages and other brassicas; carrots and turnips;
lettuce and chicory; onions (inc. shallots); sweet potatoes Unknown – 496,759.65
Total 627,289.08
Table 7. Economic impact of insect pollination of the agricultural production used directly for human
food and listed by the main categories.
Crop category following FAOSTAT
Average value
per metric kg Total value of crop (TVC)
Economic value of insect pollinators (EVIP) Ratio of vulnerability (RV)
Consumer surplus loss (CSL) with elasticity equal to
ProductionPrice * TVC*DR EVIP/TVC -0.8 -1.2
€ / metric kg € € € € Fruits 1.14 544,436.34 53,625.63 9.8% 91,116.13 75,187.45 Roots and Tubers 1.49 1,609.05 0.00 0.0% 0.00 0.00 Treenuts 1.00 6,104.60 1,526.15 25.0% 1,807.69 1,706.62 Vegetables 2.26 322,775.52 36,805.31 11.4% 138,100.85 79,154.07 TOTAL 874,925.51 91,957.09 10.5% 231,024.67 156,048.13
food production - our findings highlight the great importance of insect pollinators on a small oceanic island economy. Our results are relevant since they are based both in field and economic data with the aim of providing quantitative information as in Leonhardt et al. (2013) and Schulp et al. (2014), but by using a completely different approach to evaluate insect pollinators distribution in comparison to Londorsf et al. (2009) and Polce et al. (2013), which have used other biological indicators and mod-eling techniques. Concerning the field‐based mapping of pollination-related ES, simi-lar spatial patterns were revealed for both bees and overall insect pollinators (IP): (i) high values of abundance (N) and/or species richness (S) are directly associated to the pristine native forest areas with lower disturbance (D), on one side with low percentage of island area covered (Tables 2–5); and (ii) on the other side these same high values of pollination services are also observed in orchards and agricultural areas with high level of disturbance (D) covering large island areas (Tables 2–5). These results show that Azorean native pollinators (e.g. Pieris brassicae azorensis, Anaspis proteus, Lasioglossum spp., Eupeodes corollae, Stomorhina lunata - see Suppl. material 1: Table S1) are
provid-ing key pollination services not only in native habitats for which they are originally adapted, but also in low altitude agro-ecosystems in which they expended their range. This finding call for the need of a whole island integrated management strategy for pol-linators in Terceira in order to decrease the 32.6% VR of crops production. However, intensive managed pastures, the most dominant land use in the island with highest disturbance index D (see classes 8 and 12 in Tables 2–5), showed low abundance (N) and/or richness (S) classes for both bees and IP (Fig. 3), evidencing therefore a low performance of pollination services, as observed in previous studies (e.g. Batary 2010; Sjödin 2007). Indeed, this land-use, subject to frequent and intense grazing events does not foster the occurrence of abundant pollinator populations.
Based on the results obtained for low altitude agricultural areas, the disturbance index D variable, in contrast to other studies (e.g. Boieiro et al. 2013; Cardoso et al. 2013, 2014; Florencio et al., 2013), do not fully and adequately explain the spatial abundance of native pollinators in this island. Unmeasured variables associated to cur-rent and past land uses that reflect specific agro-ecosystems management regimes in Terceira Island may have driven the current spatial heterogeneity of the pollinators’ abundance and diversity. The numerous resources available for pollinators at low alti-tude (e.g. private gardens, abandoned orchards) together to a low input of pesticides in abandoned orchards are possibly fostering an ideal situation for the spread of native pollinators across the landscape (see also Picanço et al. 2017).
This study also highlights the fact that about one-third of Terceira Island crops have an essential or great dependence on pollinators, therefore complementing the above information on high values of insect pollinator abundance and richness in low altitude agro-ecosystems. The economic contribution of pollinators totalizes 36.2% (€170K) of the mean total annual agricultural income of the dependent crops (€469K). This EVIP percentage represents also the VR of agricultural production. Moreover, the consumer surplus loss was estimated between €156K and €231K based upon average price elasticities of −1.2 to −0.8 respectively. This interval of prices on the consumer surplus loss represents the difference between what island consumer are willing or able to pay for the ES relatively to its market price, in case of pollination services loss. These values referred to Frutercoop production only represents 54% of the island’s total crop productions (Tables 6 and 7). However, the presented estimates are underestimated values, since not all agricultural production is officially declared (family production, production in backyards, urban gardens, etc.).
Our study also indicates the high socioeconomic relevance of pollination-related ES in a small oceanic islands’ context. Nevertheless, bio-economics based valuation studies have been inherently and generally unable to provide thorough and consistent results, due to frequent changes in currency values, labor costs and food prices. This type of approach has also failed to consider and propose realistic and cost-effective mitigation efforts that might reduce the impact of a pollination crisis. In general, the costs are still being strongly dependent on the local agro-ecological setting, namely the crops phenology, the local insect populations, and the existing ecological relationships between farmland and surrounding natural or semi-natural areas.
Some crops, despite their modest or little dependence, showed very high values of mean annual production and, therefore, even in these cases, the contribution of pol-linators is significant (Gallai and Vassière 2009; Tables 6 and 7). Moreover, there is no available information on pollinator dependence for some relevant crops, showing the urgent need to address this issue through basic research on reproductive biology and pollination ecology.
As a result, these pollinator-dependent crops are crucial for maintaining the ag-ricultural food balance of the increasing population-growth of Terceira Island’s con-sumers. Meanwhile, at the world scale, IP are becoming increasingly more vulnerable to (i) land-use intensification (Power et al. 2012); (ii) use of pesticides (Kevan 1999; Suchail et al. 2001; Dos Santos et al. 2016; Geslin et al. 2016); (iii) use of insecticides (Sánchez-Bayo et al. 2016; Straub et al. 2016); (iv) use of fertilizers (McLaughlin and Mineau 1995; Andersson et al. 2014); (v) cultivation of some genetically modified crops (Warwick et al. 2009); (vi) occurrence of biological invasions (Campbell et al. 2015); (vii) climate change (Gill et al. 2016; Ferreira et al 2016); and (viii) the interac-tions of these ecological stressors (Potts et al. 2010; Vanbergen 2013). Nevertheless, it seems that intensive pastures aside, IP populations in Terceira Island are abundant and diverse in several agro-ecosystems (Fig. 3), and performing adequate pollination services to crops.
With the expected need for an increased production of vegetables and fruit in Terceira Island in the coming years, integrated mitigation measures (e.g. biological pest control, wild flowering plants production areas, promotion of organic farming), as well as (cost-) effective, innovative and attractive (for farmers) agri-environmental schemes are required in order to adequately promote pollination services and to com-pensate for some eventual crops’ failing production (e.g. Wilson and Hart 2001; Power et al 2012; Andersson et al. 2014). It appears to be increasingly consensual that organic farming regimes benefit biodiversity, zoophilous wildflowers and IP abun-dance on a local scale (Gabriel and Tscharntke 2007). As such, if strategically and effectively promoted and applied, this management practice may have the potential to benefit crop pollination and to increase IP abundance across the whole island. This needs to be taken into account for the sustainable long-term management and con-servation of pollinator communities and insect-pollinated plants in Terceira Island (e.g. Power et al. 2012).
Agri-environmental schemes aiming to foster and to pay/compensate farmers for a more sustainable management of low-intensity pasture systems and to implement integrated farm management and organic agriculture practices should be especially encouraged in the north-western, eastern and south-eastern agro-ecosystem areas of Terceira Island.
Finally, this broad, straightforward and cost-effective methodological approach may be able to be applied in further small oceanic islands with the aim of improving the capacity of effectively assessing and monitoring pollination-related ecosystem ser-vices, in order to improve the existing decision support systems for land use planning/ management policies, especially those related to agriculture and nature conservation.
Acknowledgments
We would like to thank the reviewers Nicolai Gallai and Natacha Chacoff for their useful
comments on the manuscript.AP was supported by a Ph.D. grant from Direção
Regio-nal da Ciência e Tecnologia dos Açores (M3.1.2/F/031/2011). FR was supported by the Post-Doc Grant FCT – PTDC/BIA-BIC/119255/2010 and AG was supported by the Post-Doc Grant FCT – SFRH/BPD/100017/2014, funded by the National Budget of the Ministry of Education and Science of Portugal and by the European Social Fund. PB and AG were partly financed by the Project CSA-SEP-210140185-ESMERALDA. We would like also to acknowledge FRUTER/Frutercoop and Serviço de Desenvolvimento Agrário da Ilha Terceira for giving information related to crop production.
References
Andersson GK, Ekroos J, Stjernman M, Rundlöf M, Smith HG (2014) Effects of farming intensity, crop rotation and landscape heterogeneity on field bean pollination. Agriculture, Ecosystems & Environment 184: 145–148. https://doi.org/10.1016/j.agee.2013.12.002 Aizen MA, Garibaldi LA, Cunningham SA, Klein AM (2009) How much does agriculture
de-pend on pollinators? Lessons from long-term trends in crop production. Annals of Botany 103: 1579–1588. https://doi.org/10.1093/aob/mcp076
Altieri MA, Nicholls CI, Henao A, Lana MA (2015) Agroecology and the design of climate change-resilient farming systems. Agronomy for Sustainable Development 35: 869–890. https://doi.org/10.1007/s13593-015-0285-2
Allsopp MH, De Lange WJ, Veldtman R (2008) Valuing insect pollination services with cost of replacement. PLoS ONE 3: e3128. https://doi.org/10.1371/journal.pone.0003128 Azevedo B, Rodrigues MC, Fernandes JF (2004) O clima dos Açores. In: Forjaz VH et al. (Eds)
Atlas Básico dos Açores. Observatório Vulcanológico e Geotérmico dos Açores, Ponta Delgada, 25–48.
Bartomeus I, Potts SG, Steffan-Dewenter I, Vaissiere BE, Woyciechowski M, Krewenka, KM, Tscheulin T, Roberts SPM, Szentgyörgyi H, Westphal C, Bommarco R (2014) Contribu-tion of insect pollinators to crop yield and quality varies with agricultural intensificaContribu-tion. PeerJ 2: e328. https://doi.org/10.7717/peerj.328
Batary P, Baldi A, Sarospataki M, Kohler F, Verhulst J, Knop E, Herzog F, Kleijn D (2010) Effect of conservation management on bees and insect-pollinated grassland plant commu-nities in three European countries. Agriculture, Ecosystems & Environment 136: 35–39. https://doi.org/10.1016/j.agee.2009.11.004
Biesmeijer JC, Roberts SP, Reemer M, Ohlemüller R, Edwards M, Peeters T, Schaffers AP, Potts SG, Kleukers R, Thomas CD, Settele J, Kunin WE (2006) Parallel declines in pollina-tors and insect-pollinated plants in Britain and the Netherlands. Science 313: 351–354. https://doi.org/10.1126/science.1127863
Boieiro M, Carvalho JC, Cardoso P, Aguiar CA, Rego C, Faria e Silva I, Amorim IR, Pereira F, Azevedo EB, Borges PAV, Serrano AR (2013) Spatial factors play a major role as
determi-nants of endemic ground-beetle assemblages in Madeiran Laurisilva. PloS One 8: e64591. https://doi.org/10.1371/journal.pone.0064591
Calderone NW (2012) Insect pollinated crops, insect pollinators and US Agriculture, trend analysis of aggregate data for the period 1992–2009. PLoS One 7: e37235. https://doi. org/10.1371/journal.pone.0037235
Cardinale BJ, Duffy JE, Gonzalez A, Hooper DU, Perrings C, Venail P, Narwani A, Mace GM, Tilman D, Wardle D, Daily, GC, Loreau M, Grace JB, Larigauderie A, Srivastava DS, Kin-zig AP, Naeem S (2012) Biodiversity loss and its impact on humanity. Nature 486: 59–67. https://doi.org/10.1038/nature11148
Cardoso P, Rigal F, Fattorini S, Terzopoulou S, Borges PA (2013) Integrating landscape dis-turbance and indicator species in conservation studies. PloS one 8: e63294. https://doi. org/10.1371/journal.pone.0063294
Cardoso P, Rigal F, Carvalho JC, Fortelius M, Borges PA, Podani J, Schmera D (2014) Partition-ing taxon, phylogenetic and functional beta diversity into replacement and richness differ-ence components. Journal of Biogeography 41: 749–761. https://doi.org/10.1111/jbi.12239 Campbell C, Yang S, Albert R, Shea K (2015) Plant-pollinator community network response
to species invasion depends on both invader and community characteristics. Oikos 124: 406–413. https://doi.org/10.1111/oik.02039
Cross J, Fountain M, Markó V, Nagy C (2015) Arthropod ecosystem services in apple orchards and their economic benefits. Ecological Entomology 40: 82–96. https://doi.org/10.1111/ een.12234
Cruz A, Benedicto J, Gil A (2011) Socio-economic Benefits of Natura 2000 in Azores Islands: a Case Study approach on the ecosystem services provided by a Special Protected Area. Journal of Coastal Research 64: 1955–1959. [Proceedings of the 1st International Coastal
Symposium, Szczecin, Poland]
Daily GC (1997) Nature’s services, societal dependence on natural ecosystems. Island Press, Washington, DC.
Díaz S, Demissew S, Carabias J, Joly C, Lonsdale M, Ash N, Larigauderie A, Adhikari JR, Salva-tore A, Báldi A, Bartuska A, Baste IA, Bilgin A, Brondizio E, Chan KMA, Figueroa VE, Du-raiappah A, Fischer M, Hill R, Koetz T, Leadley P, Lyver P, Mace GM, Martin-Lopez B, Oku-mura M, Pacheco D, Pascual U, Pérez ES, Reyers B, Roth E, Saito O, Scholes RJ, Sharma N, Tallis H, Thaman R, Watson R, Yahara T, Hamid ZA, Akosim C, Al-Hafedh Y, Allahverdiyev R, Amankwah E, Asah ST, Asfaw Z, Bartus G, Brooks LA, Caillaux J, Dalle G, Darnaedi D, Driver A, Erpul G, Escobar-Eyzaguirre P, Failler P, Fouda AMM, Fu B, Gundimeda H, Hashimoto S, Homer F, Lavorel S, Lichtenstein G, Mala WA, Mandivenyi W, Matczak P, Mbizvo C, Mehrdadi M, Metzger JP, Mikissa JB, Moller H, Mooney HA, Mumby P, Na-gendra H, Nesshover C, Oteng-Yeboah AA, Pataki G, Roué M, Rubis J, Schultz M, Smith P, Sumaila R, Takeuchi K, Thomas S, Verma M, Yeo-Chang Y, Zlatanova D (2015) The IPBES Conceptual Framework – connecting nature and people. Current Opinion in Environmental Sustainability 14: 1–16. https://doi.org/10.1016/j.cosust.2014.11.002
Dos Santos CF, Acosta AL, Dorneles AL, Dos Santos PD, Blochtein B (2016) Queens become workers: pesticides alter caste differentiation in bees. Scientific Reports 6. https://doi. org/10.1038/srep31605
DROTRH (2008) Carta de ocupação do solo da Região Autónoma dos Açores. Secretaria Regional do Ambiente. Direcção Regional do Ordenamento do Território e dos Recursos Hídricos. Ponta Delgada.
ESRI (2016) How Topo to Raster works. ArcGIS Online Resource Centre. http://help.arcgis. com/EN/ARCGISDESKTOP/10.0/HELP/index.html#//009z00800007m000000.htm [Last access in November 2016]
ESRI, ArcGIS Desktop (2011) Release 10. Documentation Manual. Environmental Systems Research Institute, Redlands, CA.
Ferreira, MT, Cardoso P, Borges PAV, Gabriel R, Azevedo EB, Reis F, Araújo MB, Elias RB (2016) Effects of climate change on the distribution of indigenous species in oceanic islands (Azores). Climatic Change 138: 603–615. https://doi.org/10.1007/s10584-016-1754-6 Florencio M, Cardoso P, Lobo JM, Azevedo EB, Borges PA (2013) Arthropod assemblage
homog-enization in oceanic islands: the role of exotic and indigenous species under landscape dis-turbance. Diversity and Distributions 19: 1450–1460. https://doi.org/10.1111/ddi.12121 Forjaz VH, Tavares JM, Azevedo EMVB, Nunes JC (2004) Atlas básico dos Açores.
Observa-tório Vulcanológico e Geotérmico dos Açores. Ponta Delgada.
FRUTER/Frutercoop (2016) Relatório de dados das colheitas hortofrutícolas do período 2010-2015. Angra do Heroísmo, Terceira.
Gabriel D, Tscharntke T (2007) Insect pollinated plants benefit from organic farming. Agricul-ture, Ecosystems & Environment 118: 43–48. https://doi.org/10.1016/j.agee.2006.04.005 Gallai N, Vaissière BE (2009) Guidelines for the economic valuation of pollination services
at a national scale. Food and Agriculture Organization, Rome. https://doi.org/10.1016/j. ecolecon.2008.06.014
Gallai N, Salles JM, Settele J, Vaissière BE (2009) Economic valuation of the vulnerability of world agriculture confronted with pollinator decline. Ecological Economics 68: 810–821. Garbach K, Milder JC, Montenegro M, Karp DS, DeClerck FAJ (2014) Biodiversity and
ecosystem services in agroecosystems. Encyclopedia Agricultural Food Systems2: 21–40. https://doi.org/10.1016/B978-0-444-52512-3.00013-9
Garibaldi LA, Steffan-Dewenter I, Winfree R, Aizen MA, Bommarco R, Cunningham SA, Bartomeus I, Kremen C, Carvalheiro LG, Harder LD, Afik O, Benjamin F, Boreux V, Cariveau D, Chacoff NP, Dudenhöffer JH, Freitas BM, Ghazoul J, Greenleaf S, Hipólito J, Holzschuh A, Howlett B, Isaacs R, Javorek SK, Kennedy CM, Krewenka KM, Krishnan S, Mandelik Y, Mayfield MM, Motzke I, Munyuli T, Nault BA, Otieno M, Petersen J, Pisanty G, Potts SG, Rader R, Ricketts TH, Rundlöf M, Seymour CL, Schüepp C, Szentgyörgyi H, Taki H, Tscharntke T, Vergara CH, Viana BF, Wanger TC, Westphal C, Williams N, Klein AM (2013) Wild pollinators enhance fruit set of crops regardless of honey bee abun-dance. Science 339: 1608–1611. https://doi.org/10.1126/science.1230200
Garratt, MP, Breeze TD, Jenner N, Polce C, Biesmeijer JC, Potts SG (2014) Avoiding a bad ap-ple: insect pollination enhances fruit quality and economic value. Agriculture, Ecosystems & Environment 184: 34–40. https://doi.org/10.1016/j.agee.2013.10.032
Gaspar CS (2007) Arthropod diversity and conservation planning in native forests of the Azores archipelago. PhD Thesis, University of Sheffield, London.
Geslin B, Oddie M, Folschweiller M, Legras G, Seymour CL, Van Veen FF, Thébault E (2016) Spatiotemporal changes in flying insect abundance and their functional diversity as a func-tion of distance to natural habitats in a mass flowering crop. Agriculture, Ecosystems & Environment 229: 21–29. https://doi.org/10.1016/j.agee.2016.05.010
Ghazoul J (2005) Pollen and seed dispersal among dispersed plants. Biological Reviews 80: 413–443. https://doi.org/10.1017/S1464793105006731
Giannini TC, Cordeiro GD, Freitas BM, Saraiva, AM, Imperatriz-Fonseca VL (2015) The de-pendence of crops for pollinators and the economic value of pollination in Brazil. Journal of Economic Entomology 108: 849–857. https://doi.org/10.1093/jee/tov093
Gill RJ, Baldock KC, Brown MJ, Cresswell JE, Dicks LV, Fountain MT, Garratt MPD, Gough LA, Heard MS, Holland JM, Ollerton J, Stone GN, Tang CQ, Vanbergen AJ, Vogler AP, Woodward G, Arce AN, Boatman ND, Brand-Hardy R, Breeze TD, Green M, Hartfield CM, O’Connor RS, Osborne JL, Phillips J, Sutton PB, Potts SG (2016) Protecting an Ecosystem Service: Approaches to Understanding and Mitigating Threats to Wild Insect Pollinators. Advances in Ecological Research (Chapter Four) 54: 135–206. https://doi. org/10.1016/bs.aecr.2015.10.007
Haines-Young R, Potschin M (2013) Common International Classification of Ecosystem Ser-vices (CICES): Consultation on Version 4, August-December 2012. EEA Framework Contract No EEA/IEA/09/003.
Hanley N, Breeze TD, Ellis C, Goulson D (2015) Measuring the economic value of pollina-tion services: Principles, evidence and knowledge gaps. Ecosystem Services 14: 124–132. https://doi.org/10.1016/j.ecoser.2014.09.013
Heleno RH, Ceia RS, Ramos JA, Memmott J (2009) Effects of alien plants on insect abun-dance and biomass: a food‐web approach. Conservation Biology 23: 410–419. https://doi. org/10.1111/j.1523-1739.2008.01129.x
Hutchinson MF (1993) Development of a continent-wide DEM with applications to terrain and climate analysis. In: Goodchild MF et al. (Eds) Environmental Modeling with GIS. Oxford University Press, New York, 392–399.
Hutchinson MF (1988) Calculation of hydrologically sound digital elevation models. Paper presented at Third International Symposium on Spatial Data Handling at Sydney, Australia. Kasina JM, Mburu J, Kraemer M, Holm-Mueller K (2009) Economic benefit of crop pol-lination by bees: a case of Kakamega small-holder farming in western Kenya. Journal of Economic Entomology 102: 467–473. https://doi.org/10.1603/029.102.0201
Kevan PG (1999) Pollinators as bioindicators of the state of the environment: species, ac-tivity and diversity. Agriculture, Ecosystems & Environment 74: 373–393. https://doi. org/10.1016/S0167-8809(99)00044-4
Klein AM, Vaissiere BE, Cane JH, Steffan-Dewenter I, Cunningham SA, Kremen C, Tscharntke T (2007) Importance of pollinators in changing landscapes for world crops. Proceedings of Royal Society 274: 303–313. https://doi.org/10.1098/rspb.2006.3721
Kremen C, Williams NM, Aizen MA, Gemmill‐Herren B, LeBuhn G, Minckley R, Packer L, Potts SG, Roulston T, Steffan-Dewenter I, Vázquez DP, Adams L, Crone EE, Greenleaf SS, Keitt TH, Klein AM, Regetz J, Ricketts TH, Winfree R (2007) Pollination and other
ecosys-tem services produced by mobile organisms: a conceptual framework for the effects of land-use change. Ecology Letters 10: 299–314. https://doi.org/10.1111/j.1461-0248.2007.01018.x Leonhardt SD, Gallai N, Garibaldi LA, Kuhlmann M, Klein AM (2013) Economic gain,
sta-bility of pollination and bee diversity decrease from southern to northern Europe. Basic and Applied Ecology 14: 461–471. https://doi.org/10.1016/j.baae.2013.06.003
Lonsdorf E, Kremen C, Ricketts T, Winfree R, Williams N, Greenleaf S (2009) Modelling pollination services across agricultural landscapes. Annals of Botany103(9): 1589–1600. https://doi.org/10.1093/aob/mcp069
Losey JE and Vaughan M (2006) The economic value of ecological services provided by insects. Bioscience 56: 311–323. https://doi.org/10.1641/0006-3568(2006)56[311:TEVOES]2. 0.CO;2
Maes J, Egoha B, Willemena L, Liquetea C, Vihervaarab P, Schägnera JP, Grizzettic B, Drakoua EG, La Nottea A, Zuliana G, Bouraouia F, Paracchinia ML, Braatd L, Bidoglioa G, Bouraoui F (2012) Mapping ecosystem services for policy support and decision making in the Eu-ropean Union. Ecosystem Services 1: 31–39. https://doi.org/10.1016/j.ecoser.2012.06.004 Maresca B, Mordret X, Ughetto AL, Blancher P (2011) Évaluation des services rendus par les
écosystèmes en France. Les enseignements d’une application du Millennium Ecosystem Assessment au territoire français. Développement durable et territoires. Économie, géographie, politique, droit, sociologie 2.
Marini L, Tamburini G, Petrucco-Toffolo E, Lindström SA, Zanetti F, Mosca G, Bommar-co R (2015) Crop management modifies the benefits of insect pollination in oilseed rape. Agriculture, Ecosystems & Environment 207: 61–66. https://doi.org/10.1016/j. agee.2015.03.027
Mburu J, Gerard L, Gemmilland B, Collette L (2006) Tools for Conservation and Use of Pol-lination Services. Economic Valuation of PolPol-lination Services: Review of Methods. McLaughlin A, Mineau P (1995) The impact of agricultural practices on biodiversity.
Ag-riculture, Ecosystems & Environment 55: 201–212. https://doi.org/10.1016/0167-8809(95)00609-V
MEA [Millenium Ecosystem Assessment ME] (2005) Ecosystems and human well-being: wet-lands and water. World Resources Institute, Washington, DC.
Mendonça E (2013) Serviços dos ecossistemas na ilha Terceira: estudo preliminar com ênfase no sequestro de carbono e na biodiversidade. PhD Thesis, University of Azores, Azores. Nahuelhual L, Carmona A, Lozada P, Jaramillo A, Aguayo M (2013) Mapping recreation and
ecotourism as a cultural ecosystem service: an application at the local level in Southern Chile. Applied Geography 40: 71–82. https://doi.org/10.1016/j.apgeog.2012.12.004 Nahuelhual L, Laterra P, Villarino S, Mastrángelo M, Carmona A, Jaramillo A, Barral P, Burgos
N (2015) Mapping of ecosystem services: missing links between purposes and procedures. Ecosystem Services 13: 162–172. https://doi.org/10.1016/j.ecoser.2015.03.005
Nelson E, Mendoza G, Regetz J, Polasky S, Tallis H, Cameron D, Chan KM, Daily GC, Gold-stein J, Kareiva PM, Lonsdorf E, Naidoo R, Ricketts TH, Shaw MR, Lonsdorf E (2009) Modeling multiple ecosystem services, biodiversity conservation, commodity production, and tradeoffs at landscape scales. Frontiers in Ecology and the Environment 7: 4–11. htt-ps://doi.org/10.1890/080023
Nemec KT, Raudsepp-Hearne C (2013) The use of geographic information systems to map and assess ecosystem services. Biodiversity and Conservation 22: 1–15. https://doi. org/10.1007/s10531-012-0406-z
Nie N, Hull C, Bent D (2011) IBM statistical package for the social sciences (SPSS Version 20). Computer Software. SPSS, Chicago, IL.
Olesen JM, Eskildsen LI, Venkatasamy S (2002) Invasion of pollination networks on oceanic islands: importance of invader complexes and endemic super generalists. Diversity and Distributions 8: 181–192. https://doi.org/10.1046/j.1472-4642.2002.00148.x
Olesen JM, Alarcón M, Ehlers BK, Aldasoro JJ, Roquet C (2012) Pollination, biogeography and phylogeny of oceanic island bellflowers (Campanulaceae). Perspectives in Plant Ecolo-gy, Evolution and Systematics 14: 169–182. https://doi.org/10.1016/j.ppees.2012.01.003 Ollerton J, Winfree R, Tarrant S (2011) How many flowering plants are pollinated by animals?
Oikos 120: 321–326. https://doi.org/10.1111/j.1600-0706.2010.18644.x
Pereira MJ (2008) Reproductive biology of Vaccinium cylindraceum (Ericaceae), an endemic species of the Azores archipelago. Botany 86: 359–366. https://doi.org/10.1139/B07-136 Pereira HM, Domingos T, Vicente L, Proença V (2009) A Avaliação Sub-Global para Portu-gal. In: Pereira HM, Domingos T, Vicente L, Proença V (Eds) Ecossistemas e Bem-Estar Humano: Avaliação para Portugal do Millennium Ecosystem Assessment. Escolar Editora, Lisboa, 43–56. http://www.ecossistemas.org/ficheiros/livro/Capitulo_2.pdf
Picanço A, Rigal F, Matthews TJ, Cardoso P, Borges PAV (2017) Impact of land-use on flower-visiting insect communities in an oceanic islands. Insect Conservation and Diversity. https://doi.org/10.1111/icad.12216
Polce C, Termansen M, Aguirre-Gutiérrez J, Boatman ND, Budge GE, Crowe A, Budge GE, Garratt MP, Pietravalle S, Potts SG, Ramirez JA, Somerwill KE, Biesmeijer JC (2013) Spe-cies Distribution Models for Crop Pollination: A Modelling Framework Applied to Great Britain. PLoS ONE 8: e76308. https://doi.org/10.1371/journal.pone.0076308
Pollard E, Yates TJ (1993) Monitoring Butterflies for Ecology and Conservation. Chapman and Hall, London.
Potts SG, Biesmeijer JC, Kremen C, Neumann P, Schweiger O, Kunin WE (2010) Global pollinator declines: trends, impacts and drivers. Trends in Ecology and Evolution 25: 345– 353. https://doi.org/10.1016/j.tree.2010.01.007
Power EF, Kelly DL, Stout JC (2012) Organic farming and landscape structure: effects on insect-pollinated plant diversity in intensively managed grasslands. PLoS One 7: e38073. https://doi.org/10.1371/journal.pone.0038073
Rader R, Reilly J, Bartomeus I, Winfree R (2013) Native bees buffer the negative impact of climate warming on honey bee pollination of watermelon crops. Global Change Biology 19: 3103–3110. https://doi.org/10.1111/gcb.12264
Rishikeshan CA, Katiyar SK, Mahesh VV (2014) Detailed evaluation of DEM interpolation meth-ods in GIS using DGPS data. In Computational Intelligence and Communication Networks (CICN), International Conference on IEEE, 666–671. https://doi.org/10.1109/cicn.2014.148 Saeed S, Naqqash MN, Jaleel W, Saeed Q, Ghouri F (2016) Effect of the Blowflies (Diptera:
Calliphoridae) on the size and weight of Mango (Mangifera indica L.). PeerJ PrePrints 4: e1683v1.
Sánchez-Bayo F, Goulson D, Pennacchio F, Nazzi F, Goka K, Desneux N (2016) Are bee dis-eases linked to pesticides? – A brief review. Environment International 89: 7–11. https:// doi.org/10.1016/j.envint.2016.01.009
Schmeller DS, Bridgewater P (2016) The Intergovernmental Platform on Biodiversity and Ecosystem Services (IPBES): progress and next steps. Biodiversity and Conservation 25: 801–805. https://doi.org/10.1007/s10531-016-1095-9
Schulp CJE, Lautenbach S, Verburg PH (2014) Quantifying and mapping ecosystem services: de-mand and supply of pollination in the European Union. Ecological Indicators 36: 131–141. https://doi.org/10.1016/j.ecolind.2013.07.014
Serviço de Desenvolvimento Agrário da Terceira (2016) Dados dos produtores agrícolas relati-vamente às culturas hortículas e frutícolas de 2014 e 2015. Angra go Heroísmo, Terceira. Sjödin NE (2007) Pollinator behavioural responses to grazing intensity. Biodiversity and
Con-servation 16: 2103–2121. https://doi.org/10.1007/s10531-006-9103-0
Straub L, Villamar-Bouza L, Bruckner S, Chantawannakul P, Gauthier L, Khongphinitbunjong K, Retschnig G, Troxler A, Vidondo B, Neumann P, Williams GR (2016) Neonicotinoid insecticides can serve as inadvertent insect contraceptives. Proceedings of the Royal Society B-Biological Sciences 283(1835): 0506. https://doi.org/10.1098/rspb.2016.0506
Suchail S, Guez D, Belzunces LP (2001) Discrepancy between acute and chronic toxicity in-duced by imidacloprid and its metabolites in Apis mellifera. Environmental Toxicology and Chemistry 20: 2482–2486. https://doi.org/10.1002/etc.5620201113
Tallis H, Pollaski S (2009) Mapping and valuing ecosystem services as an approach for conser-vation and natural-resource management. Ann NY Acad Sci 1162: 265–83. https://doi. org/10.1111/j.1749-6632.2009.04152.x
TEEB (2010) What is TEEB? UNEP The Economics of Ecosystems and Biodiversity Office, Châtelaine. http://www.teebweb.org/about/ [Accessed 1 Sept 2016]
Tiedeken EJ, Egan PA, Stevenson PC, Wright GA, Brown MJF, Power EF, Farrell I, Matthews SM, Stout JC (2016) Nectar chemistry modulates the impact of an invasive plant on native pollinators. Functional Ecology 30: 885–893. https://doi.org/10.1111/1365-2435.12588 Vanbergen AJ (2013) Threats to an ecosystem service: pressures on pollinators. Frontiers in
Ecology and the Environment 11: 251–259. https://doi.org/10.1890/120126
Vergílio M, Fjøsne K, Nistora A, Calado H (2016) Carbon stocks and biodiversity conservation on a small island: Pico (the Azores, Portugal). Land Use Policy 58: 196–207. https://doi. org/10.1016/j.landusepol.2016.07.020
Villa F, Ceroni M, Bagstad K, Johnson G, Krivov S (2009) ARIES (Artificial Intelligence for Ecosystem Services): A new tool for ecosystem services assessment, planning, and valua-tion. 11th annual BIOECON conference on economic instruments to enhance the
conser-vation and sustainable use of biodiversity, conference proceedings. Venice (Italy).
Wahba G (1990) Spline models for Observational data – CBMS-NSF Regional Conference Series in Applied Mathematics. Soc. Ind. Appl. Mathematics, Philadelphia, 161 pp. https://doi. org/10.1137/1.9781611970128
Warwick SI, Beckie HJ, Hall LM (2009) Gene flow, invasiveness, and ecological impact of genetically modified crops. Annals of the New York Academy of Sciences 1168: 72–99. https://doi.org/10.1111/j.1749-6632.2009.04576.x
Watson R, Albon S, Aspinall R, Austen M, Bardgett B, Bateman I, Berry P, Bird W, Bradbury R, Brown C, Burgess J, Church A, Christie C, Crute I, Davies L, Edwards-Jones G, Em-mett B, Firbank L, Fitter A, Gibson A, Hails R, Haines-Young RL, Heathwaite A, Heath-waite L, Hopkins J, Jenkins M, Jones L, Mace G, Malcolm S, Maltby E, Maskell L, Norris K, Ormerod S, Osborne J, Pretty J, Quine C, Russell S, Simpson L, Smith P, Tierney M, Turner K, Van der Wal R, Vira B, Walpole M, Watkinson A, Weighell A, Winn J, Winter M, Bullock J (2011) UK National Ecosystem Assessment: understanding nature’s value to society. Synthesis of key findings.
Wilson GA, Hart K (2001) Farmer Participation in Agri‐Environmental Schemes: To-wards Conservation‐Oriented Thinking? Sociologia Ruralis 41: 254–274. https://doi. org/10.1111/1467-9523.00181
Winfree R (2013) Global change, biodiversity, and ecosystem services: What can we learn from studies of pollination?. Basic and Applied Ecology 14: 453–460. https://doi.org/10.1016/j. baae.2013.07.004
Winfree R, Aguilar R, Vázquez DP, LeBuhn G, Aizen MA (2009) A meta‐analysis of bees’ responses to anthropogenic disturbance. Ecology 90: 2068–2076. https://doi. org/10.1890/08-1245.1
Zisenis M (2015) The International Platform on Biodiversity and Ecosystem Services gets profile. Biodiversity and Conservation 24: 199–203. https://doi.org/10.1007/s10531-014-0797-0
Supplementary material 1 Supporting information
Authors: Ana Picanço, Artur Gil, François Rigal, Paulo A. V. Borges Data type: methods
Explanation note: Description of the landscape disturbance index methodological ap-proach according to Cardoso et al. (2013).
Copyright notice: This dataset is made available under the Open Database License (http://opendatacommons.org/licenses/odbl/1.0/). The Open Database License (ODbL) is a license agreement intended to allow users to freely share, modify, and use this Dataset while maintaining this same freedom for others, provided that the original source and author(s) are credited.