POPULATION
PROJECTIONS:
A
TOOL
FOR
THE
(RE)DEFINITION
OF
THE
PORTUGUESE
HIGHER
EDUCATION
SYSTEM
Rui Dias, Maria Filomena Mendes, M. Graça Magalhães, Paulo Infante
Summary
Population projections can be used as a tool to provide information on possible sce-narios of future population and, namely, to support decision-making processes in di-verse socio-economic areas, such as, higher education institutional network planning, both in public and private sectors. In a country like Portugal, nowadays affected by a severe economical and financial crisis, with a young population characterized by low levels of education and qualification is fundamental to use population projections as a basis for higher education planning.
The main goal of this paper is to evaluate the possible changes in the younger popula-tion size in the coming years as a tool to (re)think and (re)design geographically the higher education institutional network in Portugal. Our findings will provide a range of reliable forecasts to support a more rational political decision contributing to an efficient and effective planning in what concerns higher education requirements ad-justed to the evolution of future population.
Keywords: Population Projections, Higher Education Institutional Network, time
series analysis.
1. Introduction
Population projections can be used as a tool to provide information on possible scenarios of future dimension, age and sex composition of population, and there-fore to support decision-making processes in diverse socio-economic areas, such as higher education institutional network planning, namely, in a context of a young population still characterized by very low levels of education.
The main goal of this paper is to evaluate the possible changes in younger popula-tion size in the coming years, based on the results of populapopula-tion projecpopula-tions, by age and sex, using the cohort-component method. This main goal is part of an extended research project, with the aim of a (re)definition of the Network for Higher Educa-tion in Portugal. The projecEduca-tion of the populaEduca-tion in the near future that will be "at risk" of entering that grade level is crucial. We will focus our scope on young peo-ple aged between 18 and 30, considering sex and age distribution, in the time hori-zon of the next 25 years.
In this paper, we will test the application of different methodologies to predict fertility and mortality, the main components responsible for the evolution trend of young people, as potential candidates to higher education at the considered time interval.
Despite the importance of the migration component, once both levels of emi-gration and immiemi-gration are more significant at young adult ages, at which may af-fect the prediction of the number of young people under the usual age of accessing higher education, and simultaneously influence the number of births (however, in this case, the biggest effect will be noted only18 years later), we do not include the migration component in this study, namely due to its high volatility and the high level of difficulty to predict it in the long term.
2. Brief overview of Higher Education in Portugal
Over the past 40 years, the development of the Higher Education Network in Portugal has proved to be a major factor for the country development. One of the key questions regarding the future of higher education network is related to the fact that the number of young people in Portugal have declined dramatically in recent years. Does the entry of young adult population in this level of education will con-tinue to increase, as seen in the first 30 years of democracy, i.e., since the begin-ning of the 80’s in the past century? Or will simply follow the same downward trend observed in recent years?
The Higher Education System is divided into two subsystems: public and pri-vate; and organized according an “university subsystem” (that grants a more solid scientific preparation) or a “polytechnic subsystem” (that provides a more technical training and more profession-oriented).
A preliminary analysis of students enrolled in higher education in Portugal al-lows to highlight some issues. In the last 12 years, students enrolled in higher edu-cation are mostly women, despite the decrease of the differences between sexes in the recent past. The public system is the predominant one, whether at the level of university or polytechnic. This can be explained by two reasons: 1) the high cost of private education; and, 2) the high quality of public education. It is also noteworthy the increase in the number of students in the public sector compared with the de-crease in the private one, namely since 2008/2009. Such disparity can be explained by the greater difficulties faced by families to support educational costs, mostly due to the current economic crises.
In watt concerns to university or polytechnic subsystems, the university sub-system absorbs most of the students in Higher Education in Portugal, and the dif-ference between the two subsystems remains approximately the same throughout the past 12 years. About the selected scientific areas, Agriculture remains the less attractive area to higher education students. Social Sciences, Business and Law are the areas that attract more students. The major decrease on the number of enrolled students by scientific area was in the case of Education, while a marked increase was observed in the case of Health and Social Protection. Of all the areas analyzed,
these two show an obvious change in the number of enrolled students between 2000 and 2012, whereas in the remaining six areas1 the number remains constant.
After April 25th 1974 there has been a radical change in the attitude towards education in Portugal and changes in the level of education were overwhelming. In 1986/1987, the compulsory education was raised to nine years of schooling and in 2005/2006 to 12. In 2010/2011, took effect, the requirement of one year of pre-primary schooling covering all children 5 years of age. Prior to April 25th 1974 the number of students in higher education were less than 30 thousand, while in the ac-ademic year 2011/2012 this number was around 400,000 (DGEEC2). However, and despite the numerous efforts made since the democratic revolution in April 1974, Portugal still has poor educational indicators, particularly when compared with other European countries.
Although the Bologna Process, implemented in 2006/2007, has allowed anoth-er increase in the numbanoth-er of students enrolled in highanoth-er education, mainly due to restructuring the different courses with the consequent decrease in the number of years required to obtain a degree, therefore causing smaller financial stress of fami-lies, the rate of enrolment in Portugal remained very low, compared to the majority of the European Union.
In recent years the rate of enrolment in Portugal has risen steadily, reaching values around 20% for young people aged between 18 and 29, already quite close to the 22% (2013) of the EU average (27 countries). However, this proportion is still distant from countries such as Finland, which has an enrolment rate at the same age group of 26% (Eurostat).
So, a projection of the number of individuals enrolled in higher education in the coming years is critical for a redefinition of the higher education network.
Will the increase in enrolment in higher education in Portugal offset the sharp decline expected for the younger resident population? Or, conversely, the popula-tion decrease will cause a decrease in the number of young people able to apply to higher education? The number of places offered by the Portuguese higher educa-tion network in recent years is the most appropriate considering the evolueduca-tion of the demand?
3. Data and methods
3.1 Population Projection Methodology
Deterministic projections are frequently performed using different scenarios to deal with uncertainty. More recently, probabilistic projections of population have been developed with increasingly interest namely considering that they allow the estimation of a confidence interval associated with each outcome (Bongaarts & Bu-latao, 2000). The uncertainty in the results come not from the formal model but from the uncertainty of the future evolution of components, being frequently the use of different scenarios or variants as a way of dealing with uncertainty.
1 The six scientific areas are: “Agriculture”, “Arts and Humanities, Education”, “Engineering, Manufacturing
In-dustries and Construction”, “Health and Social Protection”, “Science, Mathematics and Computing”, “Social Sci-ences, Business and Law, Services”.
An alternative is to explicitly take into account the uncertainty of the fertility, mortality and migration trends, and derive the probability distributions for the re-sulting size and age structure of the population projected (O'Neill, Balk, Brickman, & Ezra, 2001).
Thus, the complementary application of the most useful aspects of different methodologies, combining the scenario approach with probabilistic forecasts seems to be the most productive attitude (Goldstein, 2007; Sanderson et al, 2004).
The population projections have been calculated using the cohort-component method, were the populations are successively update according to the assumptions about future levels of the components and the natural ageing, in each scenario, from 2011 to 2035 (2010 is the base year). The formulation of hypotheses for fu-ture developments of components (fertility, mortality and migration) is based on the observation, analysis and modelling of past trends of each of the components and expert opinion and do not incorporated any exogenous variables. The alterna-tive hypotheses are intended to illustrate a range of possible future results. The complexity of migration flows, especially regarding its volatility and the difficul-ties in addressing new forms of population mobility, supported the decision of in-clude only a null migration assumption on this exercise.
The combination of alternative assumptions about the future evolution of mor-tality and fertility allows designing scenarios and we have chose the following three combinations of hypotheses: (a) Optimistic (high fertility and low mortality); (b) Central (medium fertility and medium mortality); (c) Pessimistic (low fertility and high mortality).
3.2 Fertility
We have analyzed the evolution of fertility, based on historical fertility data from 1981 to 2009, available at the Human Fertility Database.
In the fertility component we first establish the assumptions of possible evolu-tion, in terms of expected developments in total fertility rate (TFR) and mean age at childbearing (MAC), based on the analysis of the recent trends in Portugal. Three assumptions are defined for the TFR: (f1) the maintenance of a very low fer-tility rate throughout the projection period, assuming a value of 1.3 children per woman, in 2035 – hypothesis designated by low fertility; (f2) the recovery of fer-tility levels in order to equal, in the end of the period, the value currently recorded nowadays in the European Union, reaching 1.6, by 2035 – hypothesis called high fertility; and, (f3) an intermediate scenario that envisages a less significant increase in fertility, reaching a value of 1.45 children per woman by 2035 – the central fer-tility hypothesis. The mean age at childbearing will remain around 30 years on av-erage, decreasing slightly in the most optimistic scenario and prolonging the delay in the worst case.
For the estimation of the fertility rates by age, we have applied the model pro-posed by Schmertmann (2003 and 2005). Following this author, we model specific fertility rates by age proceeding thereafter to a linear interpolation between the pro-jected values and the estimates for the base year (2010). The model characterize the profile of the specific fertility rates by age fx, in terms of three axes (ages) that
syn-thesize certain features observed in fertility behaviour. These three areas corre-spond in particular to the younger age at which record births ( ), the age at which
the specific fertility rates reaches the maximum value (P), and the younger age after which fertility decreases 50 % of its maximum value (H). An additional parameter (R) is also used to obtain the level of fertility.
In formal terms, the exchange between the ages and an upper age limit are modelled by splines. ( ) ( ) f x R x (1) 4 2 0 , ( ) 0, , k k k x t x x x (2)
The distribution of fertility rates by age, over the next 25 years, according to
the results for the scenario 2, may be represented as shown in Figure 1.
Figure 1 – Age specific fertility rates, Portugal, 2010-2035
Age specific fertility rates tend to increase slightly between 24 and 35 years of age, particularly between 28 and 32 years-old, but we do not anticipate a significant recovery of births postponed to ages above 37 years.
However, the gradual decline in fertility observed in Portugal in recent decades conditioned inexorably the size of the generations that, either currently or in the coming decades, will reach the age to start a family and have children. Thus, even under a scenario of recovery of fertility without constraints (eventually caused by foreseeable emigration flows), the number of births in the future is likely to be lower for the simple fact that we have, year after year, fewer women at childbearing ages.
The estimation of the births in this projection exercise clearly shows that the consequences of fertility decline registered in our recent past will be reflected inevitably in the future; it is not possible to reverse its effects in the timeline of the coming decades.
3.3. Mortality
We have analyzed and modelled the evolution of mortality, based on historical mortality data from 1981 to 2009, separately for both sexes, using data from the Human Mortality Database.
To project mortality we have used the most widely model in probabilistic fore-casting of mortality, the Lee-Carter model (Raftery et al. 2013). It is an extrapola-tive model that projects into the future the trends of the historical data, according to the age patterns of mortality. As with all models, there are advantages and disad-vantages associated with the method. However, from the initial article (1992) the Lee-Carter model has been the subject of study and application by different inves-tigators, in different countries, namely Lee & Nault (Canada, 1993), Lee & Rofman (Chile, 1994), Wilmoth (Japan, 1996), Figoli (Brazil, 1998), Coelho (Portugal, 2001), Booth, Smith & Maindonald (Australia, 2002), Tuljapurkar, Li & Boe (G7, 2000).
The main advantage highlighted by several authors is how the model combines a demographic model and a parsimonious time series model, thus obtaining inter-vals for probabilistic projections. The possibility to incorporate into the model rela-tively long historical data series, also the fact that allow mortality rates progres-sively decrease exponentially over time, not being necessary to set an upper arbi-trary limit with respect to the life expectancy, are clearly considered advantages.
With regard to the disadvantages must be noted that being a model extrapola-tive it shares all the problems of similar models. The past structure and trends used in the model may not occur in the future, there may be profound changes at the structural, demographic or social levels that the model will not be able to consider, such as, possible advances in medicine, profound changes in the socio-economic context, lifestyle transformations or the appearance of new diseases that radically alter the past trend.
The Lee-Carter methodology is a bilinear model in the variables x (age) and t (calendar year). The model is defined as:
t x t x x t x
a
b
k
m
, ,ln
(3)Where mx,t is the observed central death rate at age x in year t; ax is a set age-specific constants describing the general pattern of mortality by age, i.e. describes the average age-specific pattern of mortality; kt is a time-trend index of general mortality level, i.e., describes temporal trends in the level of mortality; bx is a set of age-specific constants describing the relative speed of change at each age, is a pat-tern of deviations from the age of profile as the kt varies; x,t is the residue at age x and year t, the random error with zero mean and variance 2.
The model allows us to obtain the values projected till 2035. Three assump-tions are defined for the mortality component: (m1) defined by the central values of the model – central mortality; (m2) identified by the upper limit of the confidence interval of 90% calculated for mortality rates at each age – high mortality; and, (m3) delineated by the lower limit of the confidence interval of 90% calculated for mortality rates at each age – low mortality. The central values of the mortality rates for the Portuguese population are represented in Figures 2 and 3.
The trend shows a reduction in the rates at all ages, in particular as regards the younger ages, which mean that a greater number of young people will survive till
the older ages. Note that the expected gains in terms of reduced mortality in males will be substantial, maintaining however some comparatively higher values, for ex-ample, in the ages between 15 and 24 years old, associated with a history of high mortality mainly due to road traffic accidents. In the case of females, the decline in mortality rates will also increase, although it is noteworthy that the starting levels are much lower compared to those recorded by males, at all ages.
Figure 2 – Mortality rates, male population, aged from 0 to 35, Portugal, 2010-2035
Figure 3 – Mortality rates, female population, aged from 0 to 35, Portugal, 2010-2035
3.4 Enrolment Rates Scenarios
One of the goals of this study is to estimate the behaviour of students enrol-ment in higher education over the coming years. In order to do this forecast we used the values of the population initially projected building up several scenarios for forecasting enrolment rates, based on: (i) a linear evolution of the enrolment rates registered in the past 12 years; (ii) a logarithmic evolution; (iii) an average growth rate recorded in the same period of time, the last 12 years; and (iv) the as-sumption of an identical evolution to the enrolment rates observed in EU27.
4. Results
4.1 Population projections
In Portugal, the higher education institutions have as prime candidates young individuals aged between 18 and 24, being the age of 18 the one with the largest number of applicants. Therefore, we considered this target population on our study. However, given that we still consider a margin of recruitment between ages 18 and 23, as well as in ages above 23 (due to the potential number of students attracted by after working courses), we analyzed not only individuals with the modal age 18, but also the people in the age groups between 18 and 24 and between 18 and 30.
With time the number of young people tends to decrease at all ages. However, depending on the initial population for each age or on the evolution of the corre-sponding probability of death, the variation has a greater or lesser extent; the varia-tion in the number of births over past time may also be the cause of changes (see Table 1).
Table 1 – Total population – central scenario, 18 to 30 years old, Portugal, 2010-2035
Age/Year 2010 2015 2020 2025 2030 2035 18 117131 107655 111397 105017 99470 89480 19 118450 108517 109278 108858 101131 91503 20 118573 106958 112470 108416 98847 93560 21 120226 110466 106628 111446 103989 95597 22 121072 113096 105960 113018 101852 97552 23 125624 116872 107462 111234 104892 99373 24 129238 118176 108312 109108 108720 101025 25 138346 118288 106746 112287 108270 98737 26 143429 119929 110240 106447 111289 103868 27 150230 120762 112855 105772 112851 101727 28 153051 125285 116608 107258 111057 104751 29 157705 128866 117888 108088 108917 108559 30 157967 137918 117975 106505 112069 108091
Considering the results of the three scenarios, the difference between the pro-jected population values is almost nonexistent until 2028, due to the reduced effect of differences in mortality on population structure in young ages, in particular be-tween 18 and 30 years old. After 2028 and until the end of the projection period, the differences increase among the different scenarios, mostly due to the impact of changes in fertility. Projected values of the population aged 18 years reflect, main-ly, the past fertility trend in Portugal. Notice the values slightly higher than ex-pected for the calendar years 2018 to 2021 as a result of the increased fertility oc-curred in 2000, as well as relatively high fertility rates until 2003.
The general declining trend of individuals aged 18 becomes more evident from 2028 onwards, when the evolution of future fertility is crucial in calculating the size of the projected population. In fact, the population aged 18 in the years
preced-ing 2028 results simply from the expected survival of births already occurred by the year 2010.
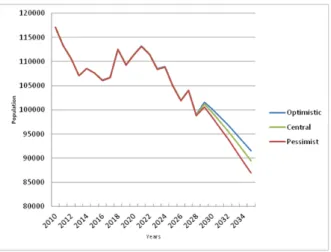
Between 2010 and 2035, it is likely that the size of the population aged 18 will decline around 23.6%, considering the so called central scenario, 21.9% in the op-timistic scenario and 25.8% in the pessimist scenario (Figure 4).
Figure 4 – Population 18 year old, central, optimistic and pessimistic scenarios
In what concerns the 18-24 age group, the downward trend remains (Figure 5). However, we can expect a slight increase in the population of this age group tween 2020 and 2026, as an effect of a slight increase in fertility in Portugal be-tween 1996 and 2002. In any of the scenarios the population of this age group de-clines from about 20.4% to 22.8%, for the optimistic or pessimistic scenario and 21.4% on the central scenario.
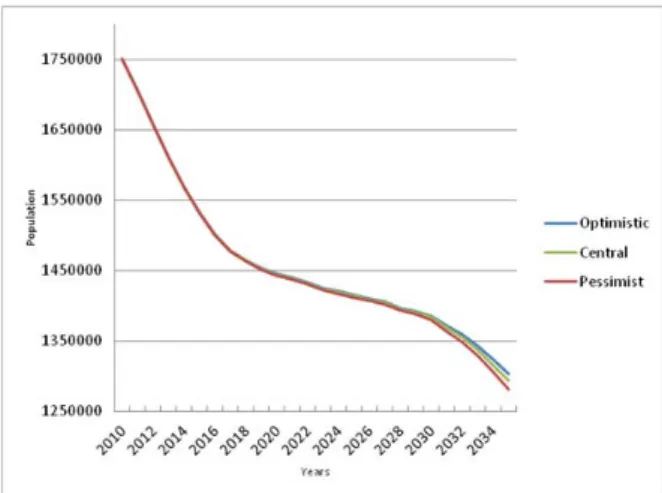
For the wider group, composed of young people aged 18 to 30 years, the de-cline is also quite visible (Figure 6), with a reduction of more than 25% whatever the scenario (-26.1%, central scenario; -25.5%, optimistic scenario; -26.9%, pessi-mistic scenario).
Figure 6 – Population 18-30 age groups, central, optimistic and pessimistic scenarios
4.2 Enrolment students
In overall, following a linear trend of the enrolment rates, those enrolled in higher education in Portugal may increase to about 460 thousands by 2035; project-ing an increase of more than 13 thousands students at the age of 18 years old until 2035 (i.e., an increase of about 40%).
According to a logarithmic evolution of enrolment there’s a complete reverse of what was projected in the previous approach for the number of enrolled students in the higher education network. In this case, the increase of enrolment rates will be not large enough to counterbalance the decline in the projected population. Global-ly it would be noted a decrease around 10% of enrolled students till 2035, which represents approximately 34.000 students.
Enrolment rates will increase dramatically under the average growth rate sce-nario. The individuals in the 18 year old group will reach an enrolment rate of around 60% at the end of the period. According to this scenario, the total of en-rolled students increased about 25%, attaining above 510.000 students.
In the scenario using the average growth rate in Europe, we selected several European countries. Despite the profound differences among them, we assume the European Union (27) growth rates. In this case, the group of 18 years old, will in-crease of about 1500 students in the period in analysis, offsetting the estimated de-cline in the young resident population. However, it is the age group of 18 to 29 years old which may register the largest increase in the number of students, in-creasing about 20%.
5. Conclusions
The first conclusion to be drawn of the different results is that the number of young people in Portugal will decrease significantly in the next 25 years. Thus, the young population, base of student’s recruitment will be reduced proportionately and the demand of higher education in Portugal will be strongly influenced by this trend.
On the one hand, the demand for higher education in Portugal tends to crease significantly in the years between 2010 and 2035, based on an expected de-cline of young population between 20-25% of the residents at the beginning of the current decade. But, on the other, considering the recent European trends, the en-rolment rates in Portugal have the possibility to grew more over the next years.
Even considering impact factors with an opposite effect, such as: (1) possible changes in social policies and incentives to attract students for higher education specific courses; (2) a broadening of the recruitment base, despite the reduction in the size of the youth population, due to the extension of compulsory education to 12 years and a possible rise on the secondary graduation rates that may cause an increase in the proportion of applicants to higher education, (3) a greater propensity of young people for chose universities and polytechnics in order to acquire a higher education; we can conclude that the demand for higher education in Portugal tend to decrease significantly in the years between 2010 and 2035, based on an expected loss of young population, between 1/5 and more than a quarter of the population existing at the beginning of the current decade.
Further, we also believe that with a future change to (again) positive net mi-gration would not be possible to reverse this trend of decreasing young population. Moreover, there will be other factors that may act to decrease the absolute number of potential candidates, such as: (1) during periods of economic crisis the families decisions may be constrained and forced to restrict the access, in the case of the most economically disadvantaged candidates; (2) highly concentrated supply of courses (and institutions) may discourage applications from young people be-longing to the lower income classes who need to move from one region to another; (3) the emigration currently registered in Portugal may become responsible for an even greater young ages depopulation.
In general, considering all factors, it appears that young people who most like-ly would have to applike-ly to higher education in Portugal tend to decrease considera-bly in the coming years.
In fact, 3 out of 4 scenarios, forecast an increase on the number of enrolled stu-dents, even with a dramatic aging in the base of the age structure.
Based on our results the supply of Higher Education should be re-evaluated and re-organized to better suit the demand in Portugal.
We believe that the conclusions which may be drawn on the basis of this exer-cise show that demographic projections are a fundamental tool for the process of resetting the network of higher education in Portugal, particularly when major changes are foreseen either in the size of the base of recruitment, either in entry strategies, and also the reorganization of the training supply.
REFERENCES
Bongaarts, J., & Bulatao, R. A. (Eds.). 2000. Beyond Six Billion: Forecasting the World’s Population. The National Academies Press.
Booth, H., Maindonald, J. and Smith, L. (2002). “Applying Lee-Carter under con-ditions of variable mortality decline”. Population Studies, 56 (3): 325–336. Coelho, E. (2001). “Método de Lee-Carter para previsão da mortalidade”. Revista
de Estudos Demográficos, nº 37 - Instituto Nacional de Estatística, Departamento de Estatísticas Sociais.
Cleland, J. (2002). “Education and future fertility trends, with special reference to mid- transitional countries”. Completing the Fertility Transition. Part 2. Back-ground Papers. New York: United Nations, Population Division, Department of Economic and Social Affairs: 187-202.
Fígoli, M. (1998). “Modelando e projectando a mortalidade no Brasil”. Revista Brasileira de Estudos de População, Vol. 1, nº 1.
Goldstein, J. R. (2007). Simpler Probabilistic Population Forecasts: Making Sce-narios Work. International Statistical Review, 72(1), 93–106. doi:10.1111/j.1751-5823.2004.tb00226.x
Lee, R. and Carter, L. (1992). “Modeling and Forecasting U.S. Mortality”. Journal of the American Statistical Association, Vol.87, n.º 419, 659-675.
Lee, R. and Nault, F. (1993). “Modeling and forecasting provincial mortality in Canada”. Paper presented at the World Congress of the International Union for the Scientific Study of Population, Montreal.
Lee, R. and Miller, T. (2000). Evaluating the Performance of Lee-Carter Mortality Forcasts, University of California, Berkeley [Online], Disponível: http//www.demog.berkeley.edu.
Lutz, W., Saariluoma, P., Sanderson, W.C., and Scherbov, S. (2000). New devel-opments in the methodology of expert- and argument-based probabilistic popula-tion projecpopula-tions. IIASA Interim Report IR-00-020. Available at http://www.iiasa.ac.at/cgi-bin/pubsrch?
Lee, R. and Rofman, R. (1994). “Modelacion y Proyeccion de la Mortalidad en Chile”, NOTAS 22, nº 59, 182-213. Also available in English from the authors, titled “Modeling and Forecasting Mortality in Chile”.
O’Neill, B., Balk, D., Brickman, M. and Ezra, M. (2001). “A Guide to Global Pop-ulation Projections”. Demographic Research, 4: 203-288.
Raftery, A., Chunn, J., Gerland, P. and Sevcíková, H. (2013). “Bayesian Probabil-istic Projections of Life Expectancy for All Countries”. Demography, 50: 777-801.
Schmertmann C. (2003): "A system of model fertility schedules with graphically intuitive parameters". Demographic Research, 9:81-110.
Schmertmann C. (2005): "Quadratic spline fits by nonlinear least squares". Demo-graphic Research, 12:105-106.
Tuljapurkar, S., Li, N. and Boe, C. (2000). “A universal pattern of mortality de-cline in the G7 countries”. Nature, 405: 789-792.
Wilmoth, J.R. (1996). “Mortality projections for Japan: A comparison of four methods”. Caselli, G. and Lopez, A.D. (eds), Health and Mortality among Elder-ly Populations, Oxford, Clarendon Press, 266-287.