Table 1. Statistics of the Questionnaire Respondents.
Statistics Overall Oporto Barreiro Peso da Régua Moura
Sample size (N) 701 180 179 171 171
Age (Continuous variable)
Mean (sample; population) 54; 50 57; 51 54; 51 53; 49 52; 50
Maximum (sample) 96 87
Gender (Nominal variable: 1 – Female, 0 – Male) Percentage of males (sample;
population) 38.8; 46.2 29.4; 44.5 48.6; 46.1 37.4; 46.4 39.8; 47.7 Educational level (Ordinal variable: 1 –ISCED 0 and 1, 2 – ISCED 2 to 6
Mean (sample; population) 3.34; 3.50 3.37; 3.88 3.55; 3.56 3.37; 3.45 3.07; 3.23 Household (Ordinal variable: 1 – one person to 5 – >4)
Mean (sample; population) 2.26; 2.50 2.13; 2.29 2.08; 2.30 2.49; 2.67 2.33; 2.53 Household income (Ordinal variable: 1 – <500, 2 – 500–1000, 3 – 1000–1500, 4 – 1500–2000, 5 –
2000; Euros per month)
Mean (sample; population*) 1.93; 2.32 1.78; 2.82 2.25; 2.40 1.80; 2.11 1.80; 1.96
Maximum (sample) 5 4
Number of employed family members (Continuous variable)
Mean (sample; population) 1.0; 0.9 0.8; 0.9 0.9; 0.9 1.3; 0.9 0.9; 0.9
Maximum (sample) 4 3 4 3 3
Minimum (sample) 0
Homeownership (Nominal variable: 0 – renting, 1 – owner) Percentage of homeowners
(sample; population) 59.1; 65.4 29.4; 50.7 69.8; 70.4 60.8; 64.4 77.2; 76.3 Era of construction (Ordinal variable: 1 – after the 1970s, 2 – before the 1970s)
Percentage of houses built before the 1970s (sample;
population) 47.6; 56.3 42.2; 73.2 54.2; 63.2 36.3; 44.4 41.5; 44.3 Type of building (Nominal variable: 0 – apartment, 1 – house)
Percentage of apartments
(sample) 64 68 82 64 40
Years of residence (Ordinal variable: 1 – <10 years, 2 – 10–20 years, 3 – >20 years)
Mean (sample) 2.44 2.42 2.61 2.28 2.43
Perception of population change (Ordinal variable: 1 – diminishing, 2 – stable, 3 – growing)
Mean (sample) 1.41 1.38 1.58 1.44 1.22
Residential satisfaction (Ordinal variable: 1 – very dissatisfied to 5 – very satisfied)
Mean (sample) 4.05 4.34 3.54 4.24 4.10
Minimum (sample) 1 2 1 3 1
Intention of leaving the city within a year (Nominal variable: 0 – no, 1 – yes) Percentage intending to leave
(sample) 6 3 16 6 10
Willingness to participate in urban regeneration programs (Nominal variable: 0 – no, 1 – yes) Percentage willing to participate
(sample) 43.2 47.2 53.1 46.2 25.7
Notes. Maximum and minimum values are reported only where values differ from the extreme points. Data regarding the population were calculated based on data retrieved from the 2011 Census (INE) and considered only those citizens aged 18 years or older as the survey was applied only to this age group. * Data refer to the municipality for the cases of Peso da Régua, Barreiro, and Moura, and were retrieved
from the Regional Annual Statistical Database (INE). The city and the municipality of Oporto are geographically coincident.
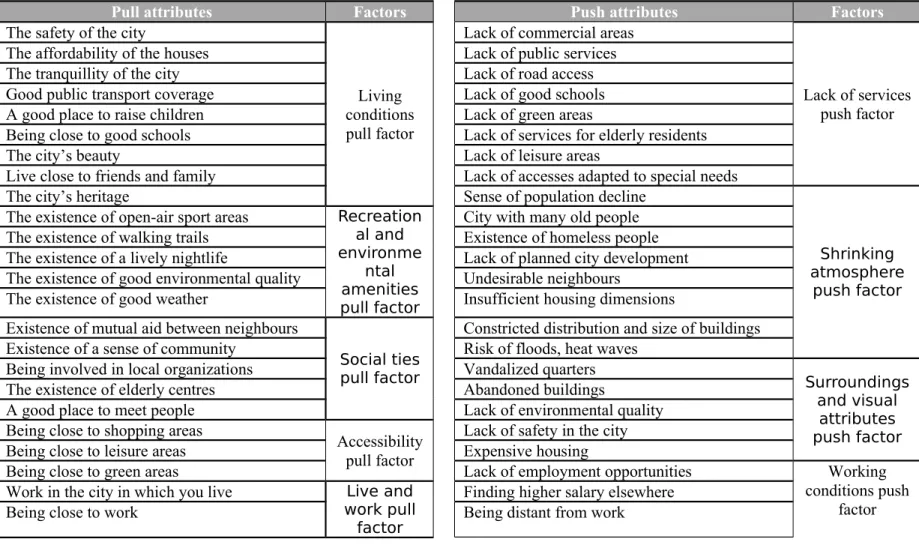
Table 2. Pull and Push Factors Derived Using Factor Analysis (From Guimarães et al. 2016).
Pull attributes Factors Push attributes Factors
The safety of the city
Living conditions pull factor
Lack of commercial areas
Lack of services push factor The affordability of the houses Lack of public services
The tranquillity of the city Lack of road access
Good public transport coverage Lack of good schools
A good place to raise children Lack of green areas
Being close to good schools Lack of services for elderly residents
The city’s beauty Lack of leisure areas
Live close to friends and family Lack of accesses adapted to special needs
The city’s heritage Sense of population decline
Shrinking atmosphere
push factor The existence of open-air sport areas Recreation
al and environme
ntal amenities pull factor
City with many old people The existence of walking trails Existence of homeless people The existence of a lively nightlife Lack of planned city development The existence of good environmental quality Undesirable neighbours
The existence of good weather Insufficient housing dimensions Existence of mutual aid between neighbours
Social ties pull factor
Constricted distribution and size of buildings Existence of a sense of community Risk of floods, heat waves
Being involved in local organizations Vandalized quarters
Surroundings and visual attributes push factor
The existence of elderly centres Abandoned buildings
A good place to meet people Lack of environmental quality
Being close to shopping areas
Accessibility pull factor
Lack of safety in the city
Being close to leisure areas Expensive housing
Being close to green areas Lack of employment opportunities Working
conditions push factor Work in the city in which you live Live and
work pull factor
Finding higher salary elsewhere
Table 3. Ordinal Logistic Model of Residential Satisfaction, Excluding the City of Residence as
an Explanatory Variable.
Variable
Coef.
Std.
Error
P-Value
Average
Marginal
Effect
Age
0.010 0.006
0.064
0.002
Education
−0.688 0.180
0.000
−0.132
Years of residence
−0.191 0.113
0.091
−0.037
Living conditions pull factor
0.457 0.079
0.000
0.087
Recreational and environmental amenities pull factor
0.189 0.085
0.025
0.036
Social ties pull factor
0.270 0.078
0.001
0.052
Shrinking atmosphere push factor
−0.287 0.077
0.000
−0.055
Surroundings and visual attributes push factor
−0.181 0.080
0.024
−0.035
Working conditions push factor
−0.343 0.082
0.000
−0.066
Threshold(s): c1
−1.640 0.384
c2
0.610 0.379
Notes. The independent variable is residential satisfaction level: 1 – ‘very dissatisfied’, ‘moderately dissatisfied’, or ‘neither satisfied nor dissatisfied’; 2 – ‘moderately satisfied’; 3 – ‘very satisfied’. Likelihood Ratio Chi-Square (9) = 123.3, p-value = 0.00.
Table 4. Ordinal Logistic Model of Residential Satisfaction, Including the City of Residence as
an Explanatory Variable.
Variable
Coef.
Std.
Error
P-Value
Average
Marginal
Effect
City = ‘Moura’
−0.030
0.242
0.900
−0.007
City = ‘Barreiro’
−1.777
0.222
0.000
−0.299
City = ‘Peso da Régua’
−0.337
0.217
0.120
−0.072
Age
0.011
0.005
0.032
0.002
Education
−0.593
0.180
0.001
−0.111
Accessibility pull factor
0.142
0.079
0.072
0.027
Shrinking atmosphere push factor
−0.372
0.090
0.000
−0.070
Working conditions push factor
−0.250
0.082
0.002
−0.047
Threshold(s): c1
−1.694
0.384
c2
0.658
0.378
Notes. The independent variable is residential satisfaction level: 1 – ‘very dissatisfied’, ‘moderately dissatisfied’, and ‘neither satisfied nor dissatisfied’; 2 – ‘moderately satisfied’; 3 – ‘very satisfied’. The baseline category for the city variable is Oporto. Likelihood Ratio Chi-Square (9) = 157.1, p-value = 0.00.
Table 5. Logit Model Regarding the Intention to Leave the City Of Residence in the Next Year,
Including the City Of Residence as an Explanatory Variable.
Variable
Coef.
Std.
Error
P-Value
Average
Marginal
Effect
Residential satisfaction = ‘moderately satisfied’
−0.967
0.403
0.016
−0.055
Residential satisfaction = ‘very satisfied’
−1.258
0.547
0.021
−0.066
City = ‘Moura’
0.214
0.639
0.737
0.010
City = ‘Barreiro’
0.024
0.625
0.969
0.001
City = ‘Peso da Régua’
0.552
0.624
0.376
0.027
Age
−0.060
0.012
0.000
−0.003
Willing to participate in urban regeneration
programs
0.752
0.406
0.064
0.035
Number of employed in the family
−0.657
0.246
0.008
−0.031
Live and work pull factor
−0.544
0.196
0.006
−0.026
Lack of services push factor
0.601
0.238
0.011
0.028
Shrinking atmosphere push factor
0.727
0.239
0.002
0.034
Threshold(s): c1
−0.529
0.901
0.557
Notes. The independent variable is the intention to leave the city within one year (1 for yes; 0 for no). The baseline category for the city variable is Oporto. The baseline category for the residential satisfaction variable is the merged category of ‘very dissatisfied’, ‘moderately dissatisfied’, and ‘neither satisfied nor dissatisfied’. Likelihood Ratio Chi-Square (11) = 80.2, p-value = 0.00.