i
TASTER RESPONSES TO ACIDITY IN WHITE WINES
CECILIANI FRANCESCO
Dissertation to obtain the Master’s Degree in
VITICULTURE AND ENOLOGY – DOUBLE DEGREE
Advisor: MANUEL José de Carvalho Pimenta MALFEITO FERREIRA
Advisor: MARIANA da Silva Gomes MOTA
President - Jorge Manuel Rodrigues Ricardo da Silva (Phd), Full Professor, at Instituto Superior de Agronomia, Universidade de Lisboa.
Members - Manuel José de Carvalho Pimenta Malfeito Ferreira (Phd), Assistant Professor, with aggregation at Instituto Superior de Agronomia, Universidade de Lisboa, supervisor; - Sofia Cristina Gomes Catarino (Phd), Invited Assistant Professor at Instituto Superior de Agronomia, Universidade de Lisboa.
iii
ACKNOWLEDGMENTS
Here I want to express my most sincere thanks and gratitude to all the people that help me in this road till the end of it.
First of all the Professor Malfeito Ferreira that gave me another point of view on wines and life, how to deal with in a team and gave so many different new experiences.
The Professor Battistutta Franco for his help and assistance. To the Professor Mariana Mota for her fundamental presence and participation.
The Professor Jorge Ricardo da Silva, Catarino Sofia and Carlos Lopes for their disposability and all the pleasure talking.
To Mister Antonio, D. Lena and D. Manuela for their help and patience.
Many thanks to all the people that, with patience and constancy, come to the trials and have made a fundamental contribution to this work.
To all my closest friends in Lisbon that help me during an entire year and not only: Lorenzo, Simone, Elisabetta, Deniz, Janin, Lorenza, Tobias, Hugo and Maria.
And a special thanks goes to my family: Cristiana, Giovanni and Elisa. Without them all this couldn’t been possible. They gave me the tools and the strength.
Thanks to my uncle Claudio that always spurred me. To Roberto for his complicity and encouragements. At the end but not of importance to my grandfather Giulio. He always gave me more than he expected and I absorb more than I could ever imagine.
iv
ABSTRACT
The aim of this study was to evaluate the responses of a panel of tasters trained to acidity in white wines. The training of tastes and sensations of the mouth was performed in relation to the acidity, sweetness, bitterness and astringency. Next, the tasters were segmented according to vinotype, sensitivity to PROP (6-n-propylthiouracil) and saliva flow. This panel was used to determine the detection and recognition thresholds of tartaric, malic and lactic acids in white wine with 4.2 g / L of total acidity.
The detection and recognition thresholds were 1.05 g/L and 1.32 g/L for tartaric acid, 0.85 g/L and 1.06 g/L for malic acid and 1.12 g/L and 1.30 g/L for lactic acid, respectively. These acids were added to an Arinto wine at concentrations 1.5 times higher than the recognition threshold, obtaining responses regarding the flavor effect considering intensity, persistence, salinity and appreciation. There were no differences (p<0.05) in relation to the first 3 parameters, while the appreciation was higher in relation to lactic and malic acids. The statistical treatment of the responses according to the segmentation revealed relationships (p<0.05) between saliva flow and sensitivity to PROP, and between saliva flow and the tartaric acid recognition threshold. The acidity appreciation was higher in men than in women.
The results obtained can be used by the wine industry in the sense of adapting the white wines to the preference of the consumers, taking into account the recent trend towards the consumption of cold climate wines.
Keywords: Wine tasting, organic acids, Sourness, Sensory Preferences, Sensory Threshold,
v
RESUMO
O objectivo deste estudo foi a avaliar as respostas de um painel de provadores treinado à acidez em vinhos brancos. O treino dos gostos e sensações de boca foi executado em relação à acidez, doçura, amargor e adstringência. Em seguida procedeu-se à segmentação dos provadores de acordo com o vinotype, sensibilidade ao PROP (6-n-propylthiouracil) e fluxo de saliva. Este painel foi usado para determinar os limiares de detecção e reconhecimento dos ácidos tartárico, málico e láctico em vinho branco com 4,2 g/L de acidez fixa.
Os limiares de detecção e reconhecimento obtidos foram de 1,05 g/L e 1,32 g/L para o ácido tartárico, 0,85 g/L e 1,06 g/L para o ácido málico e de 1,12 g/L e 1,30 g/L para o ácido láctico, respectivamente. Estes ácidos foram adicionados a um vinho de Arinto, em concentrações 1,5 vezes superiores ao limiar de reconhecimento, obtendo-se respostas em relação ao efeito no sabor considerando a intensidade, persistência, salinidade e apreciação. Não se encontraram diferenças (p< 0,05) em relação aos 3 primeiros parâmetros, enquanto a apreciação foi mais elevada em relação aos ácidos láctico e málico. O tratamento estatístico das respostas de acordo com a segmentação revelou relações (p<0,05) entre o fluxo de saliva e a sensibilidade ao PROP, e entre o fluxo de saliva e o limiar de reconhecimento do ácido tartárico. A apreciação da acidez foi mais elevada em homens do que em mulheres.
Os resultados obtidos podem ser utilizados pela indústria dos vinhos no sentindo de adaptar os vinhos brancos à preferência pelos consumidores, tendo em conta a recente tendência para o consumo de vinhos clima de frio.
Palavras-chave: Degustação de vinho, ácidos orgânicos, Sourness, Preferências
vi
Resumo alargado
O objectivo deste estudo foi avaliar a resposta de um painel de provadores treinado à acidez em vinhos brancos. Os provadores foram escolhidos entre os estudantes e funcionários do ISA, tendo-se seleccionado 26 indivíduos. O treino foi feito em relação aos gostos e às sensações de boca como acidez, doçura, amargor e adstringência. Os provadores foram caracterizados no que respeita ao sexo, vinotype, resposta ao PROP (6-n-propylthiouracil) e fluxo de saliva. O vinotype foi estabelecido através de resposta a um questionário online (www.myvinotype.com). A resposta ao PROP foi obtida após prova de um composto amargo (propiltiuracil). O fluxo de saliva foi determinado após prova de uma solução de ácido cítrico e expectoração durante um minuto.
O painel foi usado para determinar os limiares de detecção e de reconhecimento dos ácidos tartárico, málico e láctico adicionados a um vinho com 4,2 g/l de acidez fixa, seguindo um procedimento de teste triangular em copos transparente INAO. Os resultados obtidos foram de 1,05 g/L e 1,32 g/L para o ácido tartárico, 0,85 g/L e 1,06 g/L para o ácido málico, 1,12 g/L e 1,3 g/L para o ácido láctico, respectivamente para os limiares de detecção e reconhecimento. Estes ácidos foram adicionados em concentrações 1,5 vezes superiores ao limiar de reconhecimento a um vinho base de Arinto, tendo os provadores avaliado o gosto em relação à sua intensidade, persistência, salinidade e apreciação. A comparação entre os ácidos (ácido tartárico = 1,95 g/L; ácido málico = 1,5 g/L; ácido láctico = 1,95 g/L) mostrou não haver diferenças em relação à intensidade, persistência e salinidade. Em relação à apreciação, os ácidos láctico e málico foram os mais apreciados.
A comparação entre as acidezes de diferentes vinhos foi feita usando 2 vinhos de regiões de clima muito diferente. Um provinha do Alentejo (região quente) e outro da Alemanha (região fria) da casta Riesling. Um terceiro vinho foi obtido pela adição de 1,5 g/l de cada um dos ácidos málico e láctico ao vinho alentejano de forma a compará-lo com o vinho da região fria. Os resultados foram obtidos pela medição da intensidade numa escala de estimativa de magnitudes.
Por fim, tentou-se perceber se havia relações entre os diferentes segmentos dos provadores e as respostas à acidez. Através do tratamento estatístico por ANOVA foi possível encontrar relações entre o fluxo de saliva e a sensibilidade ao PROP e o fluxo de saliva e o limiar de reconhecimento do ácido tartárico. Em conjunto, os homens mostraram uma maior apreciação pela acidez do que as mulheres.
vii Os resultados obtidos mostraram que não foi possível encontrar relações claras entre a acidez, considerada como factor isolado, e a apreciação dos vinhos. O vinho é uma matriz complexa no qual a interacção entre todos os componentes cria uma gama alargada de possíveis combinações. Esta diversidade justifica a continuação dos estudos tentando esclarecer o que determina a apreciação de vinhos com diferentes níveis de acidez fixa.
viii
TABLE OF CONTENTS
1. Introduction ... 1
1.1. The concept of wine quality and appreciation ... 1
1.1.1. The influence of wine competitions on wine appreciation ... 2
1.1.2. The influence of consumer appreciation on wine appreciation ... 3
1.1.3. Sensation measurement ... 5
1.2. Wine acidity ... 6
1.2.1. Evolution of organic acids in the grapes ... 7
1.2.2. Chemistry of organic acids ... 8
1.2.3. pH ... 12
1.2.4. Methods to determine the acidity ... 13
1.2.5. Acidity modulation in wines ... 14
1.3. The acid taste ... 15
1.4. Objectives of the study ... 18
2. Materials and methods ... 19
2.1. Taster selection ... 19
2.2. Taster phenotyping ... 21
2.3. Vinotype ... 22
2.4. Saliva production ... 22
2.5. Determination of sensory thresholds ... 22
2.6. Acids and acidity appreciation ... 24
2.7. Wine analysis ... 24
2.8. Statistical analysis ... 25
3. Results and discussions ... 26
3.1. Taster characterization ... 26 3.1.1. Taster phenotype ... 26 3.1.2. Vinotype ... 27 3.1.3. Saliva production ... 27 3.1.4. Taster characterization ... 27 3.2. Sensory threshold ... 28
3.2.1. Tartaric acids thresholds ... 29
3.2.2. Malic acids thresholds ... 30
3.2.3. Lactic acids thresholds ... 31
3.2.4. Comparison among the thresholds of the organic acids ... 33
3.3. Sensory responses to supra-threshold acid concentrations ... 33
ix
3.5. Sensory responses according to taster segmentation ... 36
3.6. Discussions ... 39
4. Conclusions and future perspectives ... 41
BIBLIOGRAPHY ... 42
x
LIST OF FIGURES
Figure 1.1. Sensory profiles of Wines awarded of Gold and Great Gold medals in Mundus Vini challenge (Spring tasting 2015, red and white wines) ... 3 Figure 1.2. Steven’s Power Law (Goldstein, 2009) ...………... 6 Figure 1.3. Evolution of the Grape Development. Illustration by Jordan Koutroumanidis (Keller, 2010) ... 7 Figure 1.4. Structural formula of the main acids in the wines. Images from: Lianyungang Sunchem Co. Ltd ... 10 Figure 1.5. pH levels of common drinks (image from: Wine Folly: The Essential Guide to Wine) ... 12 Figure 1.6. pH levels of wine (image from: Wine Folly: The Essential Guide to Wine) ... 13 Figure 1.7. Relationship between sour taste intensity and hydrogen ion concentration (Neta, 2007) ... 16 Figure 1.8. Effect of the acids on mouthfeel sensations: Intensity and Persistence. Source: Laffort. Tools for acidification in Musts and Wines ... 17 Figure 2.1. ME line (Left border corresponding to the weakest sensation. Middle point corresponding to a medium sensation. Right border corresponding to the strongest sensation. Length 102mm. Middle point at 51mm) ... 22 Figure 3.1. Mean bitterness intensity for PROP solutions as a function of PROP concentration, shown separately for non-tasters, tasters, and super-tasters. Error bars indicate standard error ... 26 Figure 3.2. Production of saliva (g/min) for each taster. Results are the mean of 2 determinations and error bars indicate standard error (SE) ... 27 Figure 3.3. Geometric trend of Detection Threshold of Tartaric Acid. Number of tasters (♦) able to detect the respective added sample at each concentration. Dotted line (n = 12) represents minimum agreeing judgements necessary to establish preference using α=0.05 for triangular comparison tests (total number of tasters N=21) ... 30 Figure 3.4. Geometric trend of Detection Threshold of Malic Acid. Number of tasters (♦) able to detect the respective added sample at each concentration. Dotted line (n = 11) represents minimum agreeing judgements necessary to establish preference using α=0.05 for triangular comparison tests (total number of tasters N=19) ... 31 Figure 3.5. Geometric trend of Detection Threshold of Lactic Acid. Number of tasters (♦) able to detect the respective added sample at each concentration. Dotted line (n = 10) represents minimum agreeing judgements necessary to establish preference using α=0.05 for triangular comparison tests (total number of tasters N=18) ... 32
xi Figure 3.6. Compared logarithmic trends of the three acids. Grey line = Tartaric acid; (♦) number of tasters. Black line = Malic acid; (■) number of tasters. Dashed line = lactic acid; (▲) number of tasters ... 33 Figure 3.7. Acid Trial Result in mean (Tartaric acid=Arinto plus 1.95g/L of tartaric acid; Malic acid=Arinto plus 1.5g/L of malic acid; Lactic acid=Arinto plus 1.95g/L of lactic acid) ... 34 Figure 3.8. Wine trial results (C.P.=Castelo Pias; C.P.+Acids=Castelo Pias plus 1.5g/L malic acids and 1.5 g/L lactic acid; Ries=Riesling) ... 35
xii
LIST OF TABLES
Table 1.1. Dissociation constants (pKa) and hydrophobicities (log P) for organic acids
(adapted from Neta, 2007) ... 9
Table 1.2. Molecular weight (MW), Protons per Molecule, Equivalent Weight and Multiplying Factor for the main acids in wine. Adapted from Margalit (2012) ... 10
Table 2.1. Samples used in the first trial: first and second group ... 19
Table 2.2. Samples used in the second trial: first and second group ... 20
Table 2.3. Samples used in the third trial ... 21
Table 2.4. Analysis of the wines used in the trials – For concentrations and wines full name see the list below the table ... 25
Table 3.1. Bitterness ratings of PROP solutions (mM) using the Magnitude Estimation scale ... 26
Table 3.2. Number of tasters according to their Vinotype ... 27
Table 3.3. Demographic and physiological characterization of the tasting panel ... 28
Table 3.4. Best estimated threshold (BET) calculation for the Detection and Recognition thresholds of tartaric acid (g/L). Correct choice indicated by 1 and incorrect by 0; highlighted grey cells indicate recognition of acid taste ... 29
Table 3.5. Best estimated threshold (BET) calculation for the Detection and Recognition thresholds of malic acid (g/L). Correct choice indicated by 1 and incorrect by 0; highlighted grey cells indicate recognition of acid taste ... 30-31 Table 3.6. Best estimated threshold (BET) calculation for the Detection and Recognition thresholds of lactic acid (g/L). Correct choice indicated by 1 and incorrect by 0; highlighted grey cells indicate recognition of acid taste ... 32
Table 3.7. Detection and Recognition Thresholds (g/L) for Tartaric, Malic and Lactic Acid in white wine with 4.2 g/L of total acidity expressed as tartaric acid ... 33
Table 3.8. Acid Trial Result in mean (Tartaric acid=Arinto plus 1.95g/L of tartaric acid; Malic acid=Arinto plus 1.5g/L of malic acid; Lactic acid=Arinto plus 1.95g/L of lactic acid) ... 34
Table 3.9. Expected total acidity after acids addition calculated using the multiplying factor ... 35
Table 3.10. Wine Trial Results (C.P.=Castelo Pias; C.P.+Acids=Castelo Pias plus 1.5g/L malic acid and 1.5 g/L lactic acid) ... 35
Table 3.11. Statistical analysis for sensory responses and taster segmentation. N.S.=not significant (P>0.05). S.S.=Statistically significant (P<0.05) ... 36
Table 3.12. Tukey test for relation between Saliva 3.5 (border line between low and high salivators is 3.5) and Prop (0.32mM) show mean value and corresponding class ... 37
xiii Table 3.13. Tukey test for relation between Gender and Acids Appreciation show mean value and corresponding class ... 37 Table 3.14. Tukey test for relation between Saliva 2.5 and 3 (border line between low and high salivators is 2.5 and 3) and BET Recognition Threshold Tartaric Acid show mean value and corresponding class ... 38
xiv
LIST OF ANNEXES
ANNEX 1. Acids Trial Results ... 47
ANNEX 2. Wines Trial Results ... 47
ANNEX 3. Statistical analysis of acids ... 48
ANNEX 4. Statistical analysis of wines ... 48
ANNEX 5. Relation between Saliva 3.5 and PROP 0.32mM ... 48
ANNEX 6. Gender with acids appreciation ... 48
ANNEX 7. Relation between saliva 2,5 and BET tartaric acid ... 48
ANNEX 8. Relation between saliva 3,0 and BET tartaric acid ... 49
ANNEX 9. Sheet for the thresholds determination ... 49
ANNEX 10. Sheet for the acids comparison ... 50
xv
LIST OF ABBREVIATION
pKa – Logarithmic acid dissociation constant
kd - Dissociation constant
TA – Total acidity VA – Volatile acidity
[AH] – Un-dissociated acid concentration MLF – Malolactic fermentation
MW – Molecular weight
meq/L – Milliequivalents per liter
HPLC – High performance liquid chromatography PROP – 6-n-propylthiouracil
HF – High-flow rate LF – Low-flow rate
ME – Magnitude estimation Tart. – Tartaric acid
Malic. – Malic acid Lact. – Lactic acid Appr. – Appreciation Pers. – Persistence Sali. – Salinity Inten. – Intensity C.P. – Castelo de Pias Ries. – Riesling SD – Standard Deviation SE – Standard Error
1
1.
INTRODUCTION
The first evidence of wine production has been found between 6000 and 8000 B.C. in Georgia, Iran, Greece and Armenia. At the beginning it was considered and used as spontaneous fruit and just after the transition from nomadism to sedentarism, it began a cultivated plant (Trevisan, 2011). The wine as we know it nowadays, its spread and develop, begun with Egiptians and then with the Greeck and Romans. With them, the Catholicism it has become the most important religion in Europe and in half of the known world, and it helped the vines to be saved and disseminated in large areas. By that time, the wine assumed a several roles in society and acquired importance in the daily life as central figure in religious practices, potential medicinal properties (Trevisan, 2011) and its exhilarating effect.
1.1. THE CONCEPT OF WINE QUALITY AND APPRECIATION
Within the field of food science, the concept of perceived quality has attracted interest for decades (Saenz-Navajas et al., 2012). The overall aim of many grape and wine research studies is to improve wine ‘quality’: providing ways of understanding, altering and controlling compounds that affect wine sensory properties through viticulture and winemaking to make consistently better wines. To produce wines free of deficiencies and with sensory characteristics that appeal to consumers is of fundamental importance. The application of rigorous sensory evaluation to assist in this goal has become of increasing significance, especially in a global marketplace (Francis and Williamson, 2015).
The concept of quality can be difficult to define and in literature can be found so many different definitions. In particular, wine, if compared with other beverages, has a wide range of aromas determined by a several variables such as grape varieties, raw material, winemaking methods, viticultural practices, geographical origins or vintage (Maitre et al., 2010). Quality is hard to define because of the lack of general agreement. In fact persons differ in the wine quality perception because its holistic feature that has roots in the results of individually conceptions and previous experiences, and include all different levels of quality in one judgment (Hopfer and Heymann, 2014).
The quality of the wine comprises a number of dimensions, both intrinsic to wine tasting and extrinsic to it. For that, quality is the result of overall perception of the wine properties (Pilar et al., 2012). The extrinsic factors include the grape growing, the winemaking and the basic definition of the wine quality as the lack of technical mistakes and its drinkability. The intrinsic factors are indeed defined as drinking experiences which in turn include factors as pleasure, aroma, mouthfeel, appearance or factors either important for the involvement of interest as
2 origin, variety, typicality and potential (Hopfer and Heymann, 2014). Both the factors influence each other and, at the end, they produce a common judgment. Intervening on one of them is possible to modify the final result. This is true even if they don’t have the same weight where the intrinsic tasting experience has a quite more influence on the general assessment.
What the consumers are looking for is “enjoy” the wine and especially, parallel with the improving of the drinking experience, move their consumption towards to quality wines. Mainly the consumers with a low degree of wine knowledge, rely and trust the experts of the sector. The experts are known acting more analytically and based, hopefully, on previous studies and experienced. So the consumers trust the professionals and they look at them as guidance. It’s here that the importance of the wine competitions entry in the equation. The awards offer to the markets the possibility of having sure choices in findings “enjoyable” wines. Such as all the products, the wine is subjected to high variability in liking and perceived quality, even between experts. Therefore in competitions the awards are a matter of preferences (Hopfer and Heymann, 2014).
1.1.1. The Influence of Wine Competitions on Wine Appreciation
In the world scene of today, where the offer of wines on the market is huge, the purpose of the wine competitions is to give parameters and advices in the open range of possibilities that consumers can face every day and for every occasion. They can be either be useful to guide the consumer and even to move the market in certain directions. On the other hand, these wines competitions tend to standardize a style or a tendency with the consequence to reward wines and exclude others not only on the base of quality, but mainly on a specific footprint. The tendency of the last years of wine competition, is to attribute the medals to balanced favor profile with marginal notes of vegetal-green, chemical, earthy or sulfur characters, aromas of fruit and oak, hot/full mouthfeel (generally related to the alcohol content), low bitterness and high sweetness (Hopfer and Heymann., 2014). During the last years, the awards had moved the markets towards wines with the features mentioned above. By using the enological techniques and enological products, it’s easier for the wineries to shape the wine as the trend is pushing. But this “style” is now producing a standardization, favoring “easy” international commercial wines in opposition to the “difficult” European classic wines (Loureiro et al., 2016).
Generally, the wine competitions publish in their websites only the results and the awards without indicating the grades gave to every single parameter. The exception is the Mundus Vini that publishes them in their site (www.meininger.de/en/mundus-vini). Here we report an example of the average distribution of the main features of the wines awarded Gran Gold and Gold of the year 2015 (Figure 1.1). The main considered features in this competition
3 concern an overall evaluation (Harmonius, Complex, Potential, Body), a mouthfeel evaluation (Acidity, Sweetness, Bitterness, Astringency) and an olfactory test (Cherry, Jammy, Dried Fruit, Smoky, Oak; Barnyard, Berries, etc.)
Giving more importance to flavors and sweetness, the acidity is not well considered, even if is one of the most important components of the wine. The altering of the palatability, can be now achieved through the addiction of a wide range of enological products. This trend is conflicting with the tendency to use always more healthy and biological food. In the closest future, we may foresee that wine manipulation will be even more important because new markets are opening.
Figure 1.1. Sensory profiles of Wines awarded of Gold and Great Gold medals in Mundus Vini challenge (Spring tasting 2015, red and white wines).
1.1.2. The Influence of Consumer Segmentation on Wine Appreciation
The wine can give sensations that are correlated with the primordial reactions and some compounds, instead of others, communicate different messages to our brain. In fact the sense of taste controls one of the most important decisions animals make: whether to eat or reject a foreign substance (Mennella et al., 2011). Already from the birth, the humans try naturally to find sweets foods because linked to energy. At the same time, salty food correspond to minerals, savory to proteins and bitter and sour respectively to toxins and unripe fruits. The sweet elements in a wine are the result of residual sugars or alcohol and polysaccharides in dry wines. Acidity instead is the result, mainly, of the two dominate grape acids, tartaric and malic. Both astringency and bitterness are the result of phenolic compounds derived from the grape, oak barrels or both.
4 On our tongues there exist a number of taste buds, each containing a variety of taste receptors. These detect five different modalities, although there is some discussion about whether there might be more. They are sweet, sour, bitter, salty and umami (the sourness of amino acids). As well as these, there are receptors for heat and touch. In wine the taste and tactile components are perceived according to the capacity of our tongue and mouth to feel the different sensations and the contact with substances (Chandrashekar et al., 2006). These sensations are felt differently by persons and recent developments sensory science relies on the evaluations of responses according to consumer segmentation. Classical taster segments include gender, age or knowledge but other factors are now under focus as described below.
Taster phenotype
The sensitivity to the bitter taste of 6-n-propylthiouracil (PROP) is a heritable trait (Drewnowski, 1997). The subjects can be divided in three groups depending on the PROP detection threshold and the mean ratio of intensity. The classification is divided in 3 groups: super-tasters, tasters, non-tasters. Participants were classified as non-tasters, tasters or super-tasters based on the bitterness rating they assigned to the 0.32 mM PROP solution using the magnitude estimation (ME) line (non-taster: ≤15.5; taster: >15.5 and <51; super-taster: ≥ 51) (Pickering et al., 2004). The distinction is made on recent anatomical studies that takes in account the amount of fungiform papillae, taste buds, their number and density. The sensitivity to PROP is associated with increased acuity for other bitter compounds, and for sweet taste. The response to the PROP may predict the hedonic pleasure to sweet taste. It has been shown that PROP non-tasters were always sweet likers, and sweet dislikers were almost always tasters or super-tasters (Bartoshuk et al., 1994).
Vinotype
The previous studies on taste phenotype were the base for the development of the so-called Vinotype which is an online test based on a series of questions that helps to determine the sensory sensitivities and tolerances to wine (www.myvinotype.com). The result is a combination of personal preferences about wine. It gives an understanding of your own sensory sensitivities. This test is has the purpose of helping the subject in the choice of the right wine in stores or in restaurants. Four different vinotypes types can be attributed:
i) SWEET – At the top of the scale in terms of sensitivity and usually very picky about wines. Trend to prefer sweet wines and in general to sweet foods or drinks.
ii) HYPERSENSITIVE – Subjects are very sensitive. Range that contain the ones more conservatives, affectionate to the well-known wines, and the more adventurous that love to discover and try new wines but with clear parameters.
5 iii) SENSITIVE – The classification that include the major part of the subjects with a medium sensitivity spectrum. That also means, able to enjoy a larger segment of wine styles. People flexible, adaptable, adventurous and able to find the right wine.
iv) TOLERANT – The subject crave for intensity and lots of flavor and can't quite understand how other people drink weak wines.
Saliva production
Saliva can affect perception of taste trough titration, dilution and precipitation of stimuli. The stimulation by oral manipulation or ingestion of stimuli causes the salivary low rate to increase (Fischer et al., 1994). Saliva is the first physiological secretion induced by ingestion of foods or beverages. Its reaction play an extensive role in the oral cavity and in taste perception. Every individual react differently to the stimuli and as well the production of the saliva vary in flow and degree of response to oral stimuli (Fischer et al., 1994). Saliva is the responsible for supply the background environment response to perception and assess of taste stimuli. Depending on the rate, can be defined two types of subjects: with high-flow rate (HF) and low-flow rate (LF). This is a major differentiation which however can’t explain all the relative responses to the different stimuli. Acids seems sourer to the subjects that have lower saliva flow rate and with lower salivary pH (Fischer et al., 1994).
The Saliva test, by using the SPI (Saliva Precipitation Index), measure the reactivity of salivary proteins towards wine polyphenols (Rinaldi et al., 2012). This interaction causes complex formation and their precipitation with consequently reduction of the lubricating properties. This lead to sensations of dryness, hardness and constriction in the mouth.
The saliva production can be estimated by the weight of saliva elicited in response to 10 ml of 4 g/l of citric solution expectorated after 10s. Saliva is then collected, spitting for one minute in a weighed container (Ishikawa and Noble, 1995). Their results showed that in astringency perception, there are differences between the subjects depending on the salivary flow. In our case the interest falls to the white wines where people with low parotid flow rates, perceive astringency with a higher maximum intensity, longer latency and total duration (Smith et al., 1996).
1.1.3. Sensation Measurement
Stevens (Figure 1.2), in the 1950’s, described the technique to measure individual’s judgement of stimuli that vary widely in intensity (Schifferstein, 2012). The magnitude estimation is a psychophysical scaling International Standard technique where tasters can assign numerical values to the estimated intensity of a feature and the evaluation of sensory attributes (ISO 11056:1999).The only must that has to be follow by the assessors is that the value assigned should be conform to a ratio principle.
6 Figure 1.2. Steven’s Power Law (Goldstein, 2009).
This scale can be used for attributes such as intensity, pleasantness or acceptability. The magnitude estimation is useful when the time available and number of assessors are limited. It is a flexible scale and the tasters can apply it to a wide range of samples and attributes. It allows the assessors to have an infinite number of categories and avoid the “end-effect”. This can happen when the assessors are obliged to classify samples perceived as being different into the same category (https://www.iso.org/obp/ui/#iso:std:iso:11056:ed-1:v1:en). The length of the line it was of 102 mm. The subjects are free to choose, throughout the length of the line, the distance from the left border that more suits or represent the intensity of the sensation.
The magnitude estimation it has also some side effects. It is not the most efficient for determining small differences between stimuli or for conducting assessments in the vicinity of a detection threshold. This methodology obtains magnitude estimations and their statistical interpretation, being widely applied in food and wine studies (Green et al., 1996).
1.2. WINE ACIDITY
Wines are composed by 80%–90% water, 0.1%–20% sugar, with pH determined by a balance between 0.3%–1% acids (tartaric, malic, citric, lactic) and mildly alkaline alcohol (8%–20% ethanol, glycerol), organic compounds (0.3%–1% flavor compounds, such as anthocyanins, tannins, and flavonoids), and mineral cations (0.1%–0.3% potassium, sodium, calcium, and magnesium) (Jackson, 1994). All these main components contribute to create the broad flavors and mouthfeel feelings. In this section we will focus on the description of wine acidity and its influence on taste given that it is the aim of our studies.
7
1.2.1. Evolution of Organic Acids in the Grapes
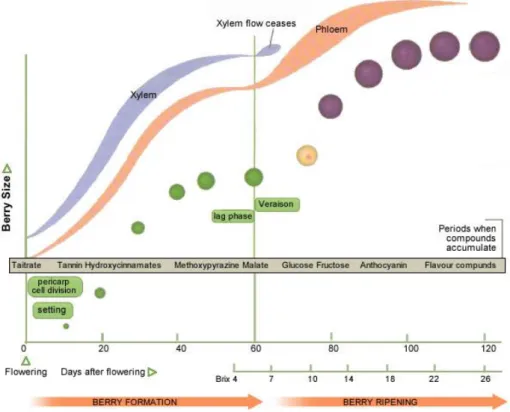
The acidity in the grapes, it is the result of all of the complex physiological and biochemical phenomena that happens during the maturity of the raw material related to the environmental conditions. The concept of the acidity in wine has to be clarified by separating it and explaining the two different kinds. The acidity attributed to the organic acids, perception positively correlated to the perceived sourness, and the one of the pH, instead negatively correlated. The acidity of the organic acids, it is subject to an evolution during the growing season (Figure 1.3).
Figure 1.3. Evolution of the Grape Development (Keller, 2010).
During the berry development, three stages occur. In stage I, starting with the fruit set, happens the enhancement of the grapes caused by the cellular division. In the stage II, called the Lag Phase, there is a stop in the berry growing because the cells division stops as well and it begins the enlargements of the same ones. With the Stage III starts the veraison where the berries metabolize the acids, change color and accumulate sugar. The presence of the acids in the grapes, is a way to defend the seeds from the consumption of vertebrate animals or birds. As well, the tannins have the same function. In the Lag Phase the amount of the acids become to decrease, the sugar content increase and so the attractiveness of the grapes it starts to increase (Keller, 2010). In the maturation phase the most important acid is the malic where it fill a dominant role in the ripening even if the tartaric acid is the most present one.
8 Despite they’re both being synthesized during the first phase, they follow a different patter during ripening. In fact the tartaric content of grapes varies very little when instead the malic acid follow the decrease in total acidity. The rate between this two acids at the end of the ripening, is important because it influence the final pH of the wine and the final titratable acidity. But, where the tartaric acid is more stable and do not follow significant modifications, the malic is very sensible to the vintage’s conditions (Jackson, 1994).
Influence of the climate on wine acidity
The changing of the climate is having a heavy impact on the ecosystem directly through shifting climatic controls and indirect on lands used for the viticulture (Hannah, 2013). Viticulture is a good test case to measuring this impact as is sensitive to climate and concentrate in a defined range (Hannah, 2013). The climate has enormous effect on vine phenology, grapes and wines composition, the vinification, the chemistry and the microbiology conditions of the wines. The rising temperature have already had a significant effect on the grape and wine industry (Mira-de-Orduña, 2010). The temperature especially has a considerable effect on the total acidity. This because while the main grape’s acid, tartaric acid, is stable to the temperature, the malic acid is instead very sensible and, depending on temperature and maturity level, it can be strongly influenced. Indirectly the temperature affect the potassium accumulation. It has been suggested that potassium enters berry cells in exchange for protons and affect the pH of the grapes (Mira-De-Orduña, 2010). Over the last few decades, global climate change and variations to viticulture and oenology practices have determined a trend towards an increase in alcohol content and a reduction in total acidity of wines (Gobbi et al., 2012). As global climate change and variations in viticulture and oenology practices have resulted in a trend towards the reduction of the total acidity of wines (Gobbi et al., 2012). The possibility of biological acidification and ethanol education might have an important role in satisfying the growing consumer demand in the wine market (Fleet, 2008).
We already mentioned that a really hot season improve the possibility of an higher pH and lower total acidity. It leads to a lowering of the quality of varietal aromas in favor of the ones of post-fermentation. But the different acids seems to have different taste and persistence. It generally confirmed that in cold climates the pH have lower levels and the TA have higher levels than wines from warm regions.
1.2.2. Chemistry of Organic Acids
The organic acids are one of the most important components of the entire character and taste of wine (Zeravik et al., 2015) and “make major contributions to the composition, stability and organoleptic qualities of wines, especially white wines” (Ribereau-Gayon, 2006).
9 The property shared by all acids is the dissociation of protons when dissolved in water and it’s called ionic dissociation (Neta, 2007). Can be represented as:
Where [A-] and [H+] are the equilibrium concentrations (molar) in the solution of the anionic form of the acid and its proton respectively. Can be then defined the Kd or
dissociation-constant: Kd=[A-] [H+] / [AH].
The acidity depends on the dissociation constant, or pKa, that is the logarithmic relationship
between the Kd and the pH (Margalit, 2012) and it permits to calculate the dissociated to
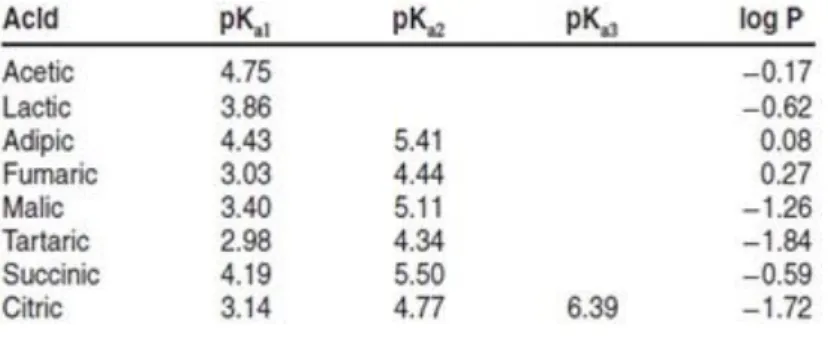
un-dissociated acid ratio at a given pH. This value indicates the quantity of protons that the acid release to the solution. Lower it is, more protons are ceded to the solution and stronger is the acid. For the organic acid we considered tartaric has a pKa around 3, which means it is pretty
strong. Malic is around 3.4 and lactic is 3.8 so they can be considered weak acids (Table 1.1).
Table 1.1. Dissociation constants (pKa) and hydrophobicities (log P) for organic acids (adapted from Neta, 2007).
The acids, and as well the bases, can be distinguish in hard and soft. They both dissociate in water but the strong ones are being completely dissociated meaning that they give all the protons to the solution. The hydrogen ions (H+) are formed when a dissolved acid partially separates (dissociates) in to hydrogen ions and related anions (A-). The strong ones do it more than soft ones, which are instead ionized in minimal part, and some protons remain in un-dissociated form. The acids are able to release one or more protons where the one or more dissociation-constants take place in different place.
That means that different acids at the same concentration, contribute with difference intensity to release protons to solution. Hence lower is the pKa, greater is the acidity contribution to the
10 The Multiplying Factor (Table 1.2) is a formula based on tartaric acid and is the equivalent weight of the other acids divided by that of tartaric acid (EW = 75). Is used to convert the acid concentration (in g/L) into his equivalent weight as tartaric acid, multiplying its concentration for the appropriate converting factor (Margalit, 2014).
Table 1.2. Molecular weight (MW), Protons per Molecule, Equivalent Weight and Multiplying Factor for the main acids in wine. Adapted from Margalit (2012).
ACID MW Protons per Molecule Equivalent Weight Multiplying Factor Tartaric 150 2 75 1.00 Malic 134 2 67 0.89 Lactic 90 1 90 1.20 Succinic 118 2 59 0.79 Fumaric 116 2 58 0.77 Citric 192 3 64 0.85 Acetic 60 1 60 0.80
The acids can be either preexisting from the grapes or as byproducts of the fermentation (Figure 1.4). The ones already present in the grapes are “natural” and have the freshest, purest acid tastes.
Figure 1.4. Structural formula of the main acids in the wines. Images from: Lianyungang Sunchem Co. Ltd.
Tartaric Acid
Is the most representative one in musts and wines and in the must, it has a concentration usually 3 times higher than wine. At the end of the vegetative growth phase it has a value around 15 g/L. In nature is not so widespread in every fruit except for grapes where is the predominant one. The one contained in the grapes it has form L (+) (Usseglio-Tomasset, 1995). Compared with the other acids is the most voluminous acid, (MW: 150.08684 g/mol) and strongly control the pH of wines.
During the fermentation precipitates as potassium bitartrate. This is happening by the increasing of alcohol level that insolubilize the acid. Depending on the area (north / south), the year (hot / cold), and the type of soil, generally it varies between 3 and 6 g/L; lower in the south and higher in the north.
11 It is an acid with 2 possibility of dissociation (diacid): pK1: 3.04; pK2 :4.37. Is the strongest
one in the grapes and is the most important one for the problems that can cause to the wine due to the insolubility of the low solubility of its salts (Usseglio-Tomasset, 1995).
Malic Acid
Is already present in the grapes L (-) and more widespread in nature than tartaric, both in fruits and vegetables. The malic decrease during the ripening of the fruits, but with different speed according to the climate; faster in warmer and slower in cold ones. It’s considered having a “green taste” and sharp. During the fermentation there is the opportunity to decrease it, by using the malolactic fermentation (MLF) where the malic acid is converted to the smoother lactic acid; the reduction proportion can reach a factor one to five. MW: 134.0874 g/mol.
Even malic acid is a diacid with two pKa: pK1 : 3.46 pK2 : 5.13.
Citric Acid
It is naturally present in the grapes, even if not in higher quantity such as other fruits. It gives a taste of freshness and it helps to prevent ferric hazes. During the fermentation and MLF, the amount decrease reducing considerably. MW: 192.124 g/mol.
The acids that can be produced by the fermentation have milder, more complex tastes. The major fermentation acids are lactic, succinic and acetic.
Lactic acid
Already present in the grapes but in minimum quantity. Mainly found in the wines, as product of the lactic bacteria. It has two different property: it can reduce the harshness of the malic acid, but it can make easier the infection by certain lactic bacteria. The result could be smells of milk or butter. That’s why some winemakers try to dissuade from doing the MLF and others try give a particular notes to their wines. MW: 90.08 g/mol.
Acetic Acid
The most important volatile acid present in the wine and is a byproduct of the alcoholic fermentation, the malolactic fermentation, the acetic and lactic bacteria. Its odor is of vinegar and a natural component of the wines even if small quantities but could be as well produced by certain bacteria. That’s the main difference with the tartaric and the malic because those, being not volatile, can’t evaporate and, by consequence, they are not able to interact with the receptors in the nose. Even the detection of the Volatile Acidity (VA), needs a different
12 process to be quantified. A small amount of acetic acid is considered normal as byproduct of microbial metabolism. MW: 60.05 g/mol.
Succinic Acid
It is formed during the fermentation by yeast and it is present only in trace. It contribute to total acidity and its taste is a mixture of acid, salty and bitterness. MW: 118.09 g/mol.
Citramalic, dimethylglyceric, galacturonic, glucuronic, gluconic, ketoglutaric, mucic, oxalic, and pyruvic acids are also found in grape and many other wines in trace amounts and contribute to total acidity. In particular, gluconic acid can be used as indicator of Botrytis Cinerea and it has an important role in the organoleptic properties of wines. It either can be considered a decrease in the quality of grapes (Grey Rot), or high quality in dessert wines (Zeravik et al., 2015).
1.2.3. pH
The pH instead, is a measurement of the number of ions H+ (protons) and “expresses the acid strength of the wine” (Puckette and Hammack, 2015) and it goes usually from 2.8 and 4.0 (Figure 1.5). Is defined as the negative logarithm of the hydrogen ion concentration in gram-atoms per liter.
Figure 1.5. pH levels of common drinks (image from: Wine Folly: The Essential Guide to Wine).
Being an expression of logarithmic scale lower is the value, higher is the intensity. As logarithmic scale, a change in one point, correspond to a solution 10 times more or less intense. The scale is from 0 to 14, where all the values under 7 are acids and higher are basics. This parameter can change depending on the maturation rate of the grapes, on the environmental conditions and soil type.
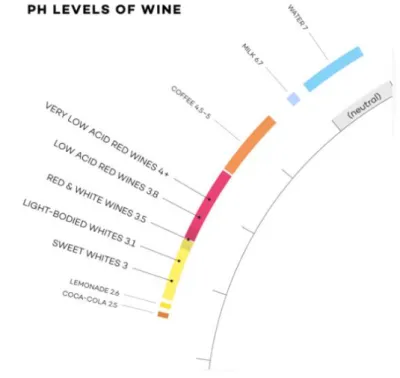
13 The pH reflect the actual proton concentration in solution, which is not necessarily the total acid concentration. Both the musts and the wines are known as acidbasics buffer solution that are able to restore possible modification of pH. Usually the pH for white wines are included between 3 and 3.3. While instead for the reds the average is little bit higher, 3.3 to 3.6 (Figure 1.6). A low level of pH is generally more indicated for any kind of wine because it helps to reduce the risks of oxidation and microbial spoilage. Even the TA is important in this role inasmuch it able to change the pH.
Figure 1.6. pH levels of wine (image from: Wine Folly: The Essential Guide to Wine).
1.2.4. Methods to Determine the Acidity
The acidity can be measured by different methods with different purpose: total acidity TA and potential of hydrogen (pH). The total acidity of the wine is the sum of its titratable acidities when it is titrated to pH 7 against a standard alkaline solution. Carbon dioxide is not included in the total acidity. With titratable acidity is defined the capability of the acids in the wines to neutralize an alkaline substance. But usually the amount of acidity is expressed in titratable acidity that consider the sum of all the organic acids. Even if TA and pH are not the same thing, they are related. A solution containing a relative higher quantity of weaker acids, such as malic, will generally have a lower pH. The methods to detect both the parameters are defined by the “Compendium of International Methods of Analysis – OIV” COMPENDIUM OF
INTERNATIONAL METHODS OF ANALYSIS – OIV
14 Total Acidity
Definition: The total acidity of the wine is the sum of its titratable acidities when it is titrated to pH 7 against a standard alkaline solution. Carbon dioxide is not included in the total acidity. Method: Potentiometric titration or titration with bromothymol blue as indicator and comparison with an end-point color standard.
Volatile Acidity
Definition: The volatile acidity is derived from the acids of the acetic series present in wine in the free state and combined as salts.
Principle: Carbon dioxide is first removed from the wine. Volatile acids are separated from the wine by steam distillation and titrated using standard sodium hydroxide. The acidity of free and combined sulfur dioxide distilled under these conditions should be subtracted from the acidity of the distillate. The acidity of any sorbic acid, which may have been added to the wine, must also be subtracted.
Fixed Acidity
The fixed acidity is calculated from the difference between total acidity and volatile acidity.
Organic Acids:
Wine organic acids may be separated and simultaneously determined by high performance liquid chromatography (HPLC) or by anion exchange chromatography, followed by spectrophotometric detection.
pH
Principle: The difference in potential between two electrodes immersed in the liquid under test is measured. One of these two electrodes has a potential that is a function of the pH of the liquid, while the other has a fixed and known potential and constitutes the reference electrode. The instrument used is the pH meter.
1.2.5. Acidity Modulation in Wines
The OIV define the limits and the ways to acidify musts and wines (www.oiv.int/en/):
MUSTS and WINES
Definition: increase of the titratable acidity and the actual acidity (decrease of the pH).
Objectives:
15 b) To promote good biological characteristics and good keep in quality of the wine.
Prescriptions:
The objectives can be reached:
a) By blending with musts of elevated acidity;
b) With the help of strong cation exchangers in the free form. c) By the use of chemical procedures
d) By microbiological acidification e) By electromembrane treatment
CHEMICAL ACIDIFICATION
Definition: Increasing the titration acidity and the actual acidity (decreasing pH) by adding organic acids.
Objectives:
a) Produce balanced wines from the gustatory point of view; b) Favor a good biological evolution and good maturation of wine; c) Remedy insufficient natural acidity caused by:
- climatic conditions in the viticulture region, or
- oenological practices which lead to a decrease in natural acidity
Prescriptions:
a) Lactic acids, L(-) or DL malic acid and L(+) tartaric acid are the only acids that can be used;
b) The addition of acids should not be done to conceal fraud; c) The addition of mineral acids is forbidden;
d) Chemical acidification and chemical de-acidification are mutually exclusive; e) The acids used must conform to the International Oenological Codex standards
f) Acids can be only be added to musts under condition that the initial acidity content is not raised by more than 54 meq/l (i.e. 4 g/l expressed in tartaric acid). When must and wine are acidified, the net cumulative increase must not exceed 54 meq/l (or 4 g/l expressed in tartaric acid).
1.3. THE ACID TASTE
The acid taste, in both must and wine, is an important feature of flavor (Pilar et al., 2012). The acidity can be either descripted as sourness when sensed. In fact organic acids and pH are the responsible for the sourness and capable of modifying sourness sensation in wines.
16 The acids are one of the main components of the wine, that gives a fresh taste and help the wine to be aged and preserved. For example the tartaric acid is more present in warmer region while than colder region where malic is predominant (Zeravik et al., 2015). The acidity is usually lower in the white wines from 3.0 to 3.3 pH and higher in red wines 3.3 to 3.6 pH. They have different characteristics and the effect on the palatability is quite different (Jackson, 1994). Depending on the concentration they produce a pleasant and refreshing sensation or unpleasant acidity (Pilar et al., 2012).
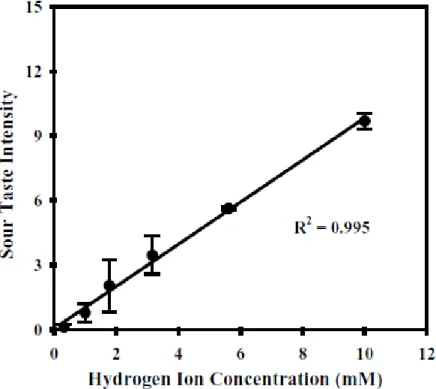
During the last century, so many efforts and studies are been done, to understand the chemical base for sour taste and it has been recognized that hydrogen ions dissociated in aqueous solutions, are perceived to be sour (Neta, 2007) (Figure 1.7). However this is not enough for explain the sour taste. Sourness has been shown to vary independently with pH, total acid concentration and specific anion (Sowalsky and Noble, 1998). The sourness intensity of the acids in fact, even not modifying the concentration, increased with decreasing pH, while at different pH level, sourness increased with increasing acid concentration (expressed as normality).
Figure 1.7. Relationship between sour taste intensity and hydrogen ion concentration (Neta, 2007).
Johanningsmeier et al. (2005) proposed that the main factor explaining the sour taste intensity of organic acids, is the molar concentration of acid molecules that have one or more protonated carboxyl groups. Neta (2007) instead states that the sour taste of organic acids is directly related to the number of molecules with at least 1 protonated carboxyl group plus the hydrogen ions in solution.
17 Furthermore protonated organic acid species and hydrogen ions were found to have approximately equal sour taste responses on a molar basis. The acidity, except for the volatile, is possible to perceived it, only by the taste. Speaking about which acidity confer the taste, the literature agrees that what is more important is not the pH, but instead the titratable acidity (Neta, 2007). The problem is that pH and TA are correlated so it’s difficult to separate them.
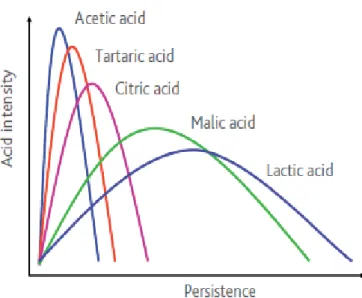
In general the acidity confers freshness, crispy and tart taste. Even if all the main acids in the wines confer the sour taste, they are characterized by different persistence, intensity, aggressivity and saltiness. They even contribute in different path to the fullness of the mouthfeel. The Figure 1.8, adapted from Laffort Tools for Acidification in Musts and Wines, express this concept very well showing the persistence at the abscissa and the intensity at the ordered.
Figure 1.8. Effect of the acids on mouthfeel sensations: Intensity and Persistence. Source: Laffort. Tools for acidification in Musts and Wines.
Interaction of acidity with other compounds
The acidity perception can be influenced by other constituent of the wine such as bitterness, sweetness, and astringency may coexist (Neta, 2007). The presence of ethanol, it has a suppressing effect on sourness. Organic acids (tartaric, lactic, malic, citric and acetic acids) and some inorganic acids can elicit astringent sensations in addition to a sour taste. Non‐ phenolic organic (e.g. lactic, citric, tartaric, malic, quinic and acetic acids) and some inorganic acids (e.g. hydrochloric and phosphoric acids) can elicit astringent sensations in addition to a sour taste (Bajec and Pickering, 2008).
Sourness and astringency both decrease with the increases of the pH indicating a dependency between those properties (Laaksonen, 2011). In fact the perceived sourness of
18 various organic acids decreased along with increasing pH (Lugaz et al., 2005). The omission of organic acids from a red wine model solution also resulted in a decrease in puckering astringency, but an increase in velvety astringency (Laaksonen, 2011). Sourness and sweetness as well are related. Lowest the quantity of sweet compounds and slightly will increase the acidity.
The pH is able to affect astringency while instead the variation of tartaric acid concentration, at constant pH is not able to effect it. As well the astringency attributed to some acids it was noticed to be related to the pH because neutralizing it with NaOH, the astringency was decreased (Fontoin et al., 2008).
1.4. OBJECTIVES OF THE STUDY
As explained before, acidity is one of the most relevant features involved in wine quality and appreciation. Therefore, it is of most importance to evaluate the sensory responses to changes in the acidity of wines, anticipating the next commercial trend of cool climate wines. Although research has already been published in the theme, an approach considering the different taster segments and the different acids is missing.
Therefore, the objectives of this study were:
i) To identify the Detection and Recognition Thresholds for tartaric, malic and lactic acids. ii) To understand the different levels of appreciation for the different acids.
iii) To assess possible relations between the characterization of the tasters and their responses to wine acidity.
19
2.
MATERIALS AND METHODS
2.1. TASTER SELECTION
The tasting panel was mainly selected among the students of the Master of Viticulture and Oenology of the Instituto Superior de Agronomia (2015/2016). First and second year students were the main targets for the work. The selection has been conducted in order to find the subjects with the best knowledge and sensitivity about the main descriptors of the mouthfeel: acidity, sweetness, bitterness and astringency with the purpose to have a group of people trustable in the results and trained to perceive differences.
The guideline was to find out subjects that consume usually wine at least one for week and able to distinguish the samples submitted. They were prepared, highlighting the main mouthfeel perception. The work started contacting students, males and females, from the ISA without any age limit, smokers and non-smokers.
First Test
To the first call 56 persons came for the selection. The first trial consisted in 9 samples served in 2 groups (Table 2.1).
Table 2.1. Samples used in the first trial: first and second group.
1st Group 2nd Group 1) Sugar (10 g/L) 2) Tartaric acid (1 g/L) 3) Chinine Sulphate (0.0108 g/L) 4) Alluminium Sulphate (0.8 g/L) 5) Ethanol (40%) 6) Lactic Acid (1 g/L) 7) Malic Acid (1 g/L) 8) Aluminium Sulphate (0.8 g/L) 9) Tannins (1 g/L)
1° Group – The compounds were added to distilled water for give the following sensation in
order with the table: 1) sweetness, 2) acidity, 3) bitterness, 4) astringency, 5) alcoholic/hot mouthfeel.
2° Group – Served after the first with the purpose of give an idea of the difference between
two kind of acidity and two of astringency.
All the solutions where prepare in distilled water, served in white glasses, at room temperature. It was asked to the subjects to describe the sensation felt and write it down.
20 Second Test
To the second call 56 persons came for the selection. The second trial consisted in 9 samples served in 2 groups (Table 2.2).
Table 2.2. Samples used in the second trial: first and second group.
1° Group 2° Group
1) Tartaric Acid (1 g/L) + Sacarose (10 g/L) 2) Tartaric Acid (1 g/L) + Aluminium Sulfat (0.8 g/L)
3) Tartaric Acid (1 g/L) + Sacarose (10 g/L) + Ethanol (5%)
4) Tartaric Acid (1 g/L) + Sacarose (10 g/L) + Ethanol (5%) + Tannins (1 g/L)
(Quertanin Plus)
5) Control (number 4) + Mannoproteins (0.3 g/L)
6) Control (number 4) + Arabic gum(2 g/L) 7) Control (number 4) + CMC
(carboximetilcelulosa) (0.2 g/L)
After one week another trial was done. Mixed sensations to evaluate the capacity to identify them, even if not in single presence.
1° Group – In the first group the following sensation were meant to be presented: 1) acidity
and sweetness, 2) acidity and astringency, 3) acidity, sweetness and warmness, 4) acidity, sweetness, warmness and astringency.
2° Group – The second group was served using the number 4) as control and as base
solution. The purpose was to give an idea of how different can appear a solution treated with different stabilizers.
All the solutions where prepare in distilled water, served in white glasses, at room temperature. It was asked to the subjects to describe the sensation felt and write it down.
Third Test
For the last selection test, it has been used the wines from ISA’s winery: white wine (Arinto); red wine (Syrah, Cabernet Sauvignon, Touriga National, Trincadera) (Table 2.3). After have tried the same compounds with distilled water, they were used in white and red wines for compare how the interaction between the used compounds and the ones of the wines, react and give different perception of the same. It has been use the triangular test using white glasses, at room temperature. It was asked to the subjects to describe the sensation felled and write it down.
21 Table 2.3. Samples used in the third trial.
Final Evaluation
The criteria used to evaluate the tasters, has been previously decided and defined. The subjects who answer wrong to two or more feeling recognition, were allowed to try again the day after but allowing no mistakes. Recognizing them all, were able to pass to the next selection test. At the end of all three panel selections, the ones that met these criteria were finally selected and trained at the same time.
Starting from a group of 56 people, we end up selecting 26 of them. Age included between 22 and 46 years old (Average = 25.3; SD = 5.14), 9 females and 17 males, 4 smokers, 6 middle smokers and 16 non-smokers. No one vegetarian and no one with known serious food allergy. In major part were students of the Master in Viticulture and Oenology but even from the bachelor degree and some of the departments of viticulture. All of the subjects were part of the ISA’s university, both as students or workers.
2.2. TASTER PHENOTYPING
The PROP (6-n-Propylthiouracil) used in this test was supplied by Sigma. Subjects were asked to evaluate the personal response to the three solutions in order from the low to high concentration: from 0.032 mM to 0.32 mM and then 3.2 mM. 20 ml of each solution was served in standard white glasses at room temperature. The procedure defined to keep the solution in the mouth for a few second, spit it and fill a Magnitude Estimation (ME) line (ISO 11056:1999). Wait for a minute, wash the mouth with water and keep going with the following samples.
The ME line (Figure 2.1) was 102 mm long and the right anchor term was ‘strongest imaginable sensation”. To evaluate the answers, the length in cm, was calculated from the left edge, to the point marked by the taster in the line.
For comparing trials of acids and wines, the average values were calculated.
1° Group
1) White Wine + Sucrose (30 g/L) 2) White Wine + Tartaric Acid (1 g/L) 3) Red Wine + Chinine Sulphate (0.1 g/L)
22 Figure 2.1. ME line (Left border corresponding to the weakest sensation. Middle point corresponding to a medium
sensation. Right border corresponding to the strongest sensation. Length 102mm. Middle point at 51mm).
The acids used to add to the wines have different brands. The tartaric acid (L+) was supply by the Panreac AppliChem. The malic acid (DL-) from the Aldrich. The lactic acid (DL-) from Sigma and the citric acid from Merck Millipore.
2.3. VINOTYPE
The subjects were given an online test in order to characterize their relation with the wines and to evaluate their sensitivities and tolerance. 4 different groups were established: sweet, hypersensitive, sensitive and tolerant (www.myvinotype.com).
2.4. SALIVA PRODUCTION
The characterization of the saliva index was applied by administering to the taster 20 ml of a water solution with 4 g/L of citric acid. Subjects were asked to keep in the mouth the whole solution for ten seconds, spit it out, wait another ten seconds and then spit for 60 seconds in a bowl. The final value reported in this work is the average between the two measurements. All the values were used for the comparing in different combinations: using them as normal values and then using a different limit border to create different groups of low-flow rate (LF) and high-flow rate (HF) production saliva tasters. Those borders were use at the levels 2.5, 3 and 3.5 grams (Fischer et al., 1994).
2.5. DETERMINATION OF SENSORY THRESHOLDS
The sensory threshold is “the point at which increasing stimuli trigger the start of an afferent nerve impulse. Absolute threshold is the lowest point at which response to a stimulus can be perceived” (Mosby's Medical Dictionary, 2009). This triangular test is the method for sensory analysis, specified by the International Standards ISO 4120 to detect the differences between samples of two products by triangular comparison. The differences can be all the attributes or just one attribute of the samples.
It can be either used in the selection or training of assessors or either for monitoring the same. Is a very convenient method used in case of low number of assessors available and
23 there is no risk of sensory fatigue. The principle is based on the simultaneous presentation of a set of three test samples, two of which are identical, for identification of the odd samples. The conditions of the room and the qualifications of the assessors have to respond to the respective ISO 6658.
In case of this test, which it use a significant level of 5%, the number of the assessors can’t be lower than 7. The test supervisor can’t be part of the test. The samples were served at room temperature.
The subjects were preliminary informed about the test, the working system, the purpose, on which sensory and mouthfeel concentrate with object of avoid any bias in their replies. Casual codes were given in INAO white glass conformed to the ISO. Random distribution of the glasses avoided any possible interpretation of the assessor.
The principle of “forced choice” was applied to choose the sample different from the others products, in order to obtain statistical validity of analysis. The principle of “no difference replies” was not used when it was asked to recognize which the different one was.
BET THRESHOLD
Classically, in sensory research, the best estimate threshold (BET) is used for studying perception value. The Best Estimate Threshold (BET) concentrations for the individual panelists were calculated as the geometric means of the highest undetected concentration and the lowest detectable concentration. The group best estimated threshold was calculated as the geometric mean of the individual thresholds (Panovská et al., 2009).
It can happen that, as the panelist became more accustomed to the flavor of the substance and the mechanism of the test, the thresholds could decrease. If this decline is more than 20% we have to repeat the test until the values stabilize (Meilgaard et al., 1999).
This method is applied to find out two different thresholds: the Detection and the Recognitions Threshold. The Detection Threshold identifies at which concentration the subject is able to distinguish a sample from the other. The Recognition Threshold identifies at which concentration the subject is able to identify which kind of difference. In the case of the triangular test just one sample is different from the other two. The BET is applied to the answers of every single subjects and then calculated with the final average of the panel. The final result it will be a mean concentration and it will express the value as threshold of distinction. At the same way it is applied for the Recognition Threshold giving a different value concentration. In both cases the BET is the tool through which is possible to calculate and relate the physical intensity of the stimulus to the corresponding sensation and converting to a value (Meilgaard et al., 1999).