EUROPEAN ORGANIZATION FOR NUCLEAR RESEARCH (CERN)
CERN-EP/2016-132 2016/12/20
CMS-SUS-15-011
Search for new physics in final states with two
opposite-sign, same-flavor leptons, jets, and missing
transverse momentum in pp collisions at
√
s
=
13 TeV
The CMS Collaboration
∗Abstract
A search is presented for physics beyond the standard model in final states with two opposite-sign, same-flavor leptons, jets, and missing transverse momentum. The data sample corresponds to an integrated luminosity of 2.3 fb−1 of proton-proton colli-sions at√s = 13 TeV collected with the CMS detector at the LHC in 2015. The anal-ysis uses the invariant mass of the lepton pair, searching for a kinematic edge or a resonant-like excess compatible with the Z boson mass. Both search modes use sev-eral event categories in order to increase the sensitivity to new physics. These cate-gories are based on the rapidity of the leptons, the multiplicity of jets and b jets, the scalar sum of jet transverse momenta, and missing transverse momentum. The ob-servations in all signal regions are consistent with the expectations from the standard model, and the results are interpreted in the context of simplified models of super-symmetry.
Published in the Journal of High Energy Physics as doi:10.1007/JHEP12(2016)013.
c
2016 CERN for the benefit of the CMS Collaboration. CC-BY-3.0 license ∗See Appendix A for the list of collaboration members
1
1
Introduction
Supersymmetry (SUSY) [1–8] is one of the most appealing extensions of the standard model (SM), assuming a new fundamental symmetry that assigns a new fermion (boson) to every SM boson (fermion). SUSY resolves the hierarchy problem of the SM by stabilizing the Higgs boson mass via additional quantum loop corrections from the top super-partner (top squark), which compensate the correction due to the top quark. If R-parity [9] is conserved the lightest state predicted by the theory is stable and potentially massive, providing a candidate for Dark Matter. Many SUSY models also lead to the unification of the electroweak and strong forces at high energies.
This paper presents a search for signatures of SUSY in events with two opposite-sign, same-flavor leptons (electrons or muons), jets, and missing transverse momentum. A dataset of pp collisions collected with the CMS detector at the CERN LHC at a center-of-mass energy
√
s = 13 TeV in 2015 was used, corresponding to an integrated luminosity of 2.3 fb−1. The dilepton topology is expected to occur in SUSY models where a neutralino decays to either an on-shell Z boson or a virtual Z/γ boson which in turn decays to leptons and the lightest SUSY particle (LSP), or into a lepton and its supersymmetric partner (slepton), the latter decaying into another lepton and the LSP. Decays involving an on-shell Z boson are expected to produce an excess of events compatible with the Z boson mass, while decays involving off-shell Z bosons or sleptons are expected to produce a characteristic edge shape in the invariant mass distribution of the dilepton system [10].
The CMS Collaboration published a version of this analysis using a √s = 8 TeV dataset, ob-serving a 2.6 σ local significance excess compatible with an edge shape located at a dilepton invariant mass of 78.7±1.4 GeV [11]. The ATLAS collaboration reported the absence of any excess in a similar signal region, but observed a 3.0 σ excess in dilepton events compatible with the Z boson mass [12]. Both of these excesses warrant scrutiny using the 13 TeV dataset and are analyzed here with minor changes with respect to the 8 TeV searches.
2
The CMS detector
The central feature of the CMS apparatus is a superconducting solenoid, 13 m in length and 6 m in diameter, that provides an axial magnetic field of 3.8 T. The bore of the solenoid is outfitted with various particle detection systems. Charged-particle trajectories are measured by silicon pixel and strip trackers, covering 0 < φ < 2π in azimuth and |η| < 2.5, where the
pseudo-rapidity η is defined as η = −log[tan(θ/2)], with θ being the polar angle of the trajectory of
the particle with respect to the beam direction. A crystal electromagnetic calorimeter (ECAL), and a brass and scintillator hadron calorimeter surround the tracking volume. The calorimetry provides high resolution energy and direction measurements of electrons and hadronic jets. A preshower detector consisting of two planes of silicon sensors interleaved with lead is located in front of the ECAL at|η| >1.479. Muons are measured in gas-ionization detectors embedded
in the steel flux-return yoke outside the solenoid. The detector is nearly hermetic, allowing for energy balance measurements in the plane transverse to the beam direction. A two-tier trigger system selects the most interesting pp collision events for use in physics analysis. A more de-tailed description of the CMS detector, its coordinate system, and the main kinematic variables used in the analysis can be found elsewhere [13].
3
Datasets, triggers, and object selection
Events are collected with a set of isolated dilepton triggers that require a transverse momentum pT > 17 GeV for the leading lepton and pT > 12(8)GeV for the subleading electron (muon),
and|η| < 2.5(2.4)for electrons (muons). In order to retain high signal efficiency, in particular
for Lorentz-boosted dilepton systems, non-isolated dilepton triggers with pT >33(27)GeV for
the first electron (muon) and pT >33(8)GeV for the second electron (muon) are also used. The
trigger efficiencies are measured in data using events selected by a suite of jet triggers.
Events are selected by requiring two opposite-charge, same flavor leptons (e±e∓or µ±µ∓) with
pT > 20 GeV and pseudorapidity |η| < 2.4. The distance between the leptons is requested
to be at least
√
∆φ2+∆η2 = ∆R > 0.3 to avoid reconstruction efficiency differences between
electrons and muons in events with very collinear leptons. This requirement is relaxed to∆R>
0.1 when the mass of the dilepton system is consistent with a Z boson to preserve acceptance for Z bosons with large transverse momentum. To ensure symmetry in acceptance between electrons and muons, all events with one of these two leptons in the barrel-endcap transition region of the ECAL, 1.4 < |η| < 1.6, are rejected. A control sample of different flavor leptons
(eµ or µe) is defined using the same lepton selection criteria. All the parameters above have been chosen in order to maximize the lepton selection efficiency while keeping the electron and muon efficiencies similar.
Electrons, reconstructed by associating tracks with ECAL clusters, are identified using a mul-tivariate approach based on information on the cluster shape in the ECAL, track quality, and the matching between the track and the ECAL cluster [14]. Additionally, electrons from pho-ton conversions are rejected. Muons are reconstructed from tracks found in the muon system associated with tracks in the tracker. They are identified based on the quality of the track fit and the number of associated hits in the tracking detectors. For both lepton flavors, the impact parameter with respect to the reconstructed vertex with the largest p2Tsum of associated tracks (primary vertex) is required to be within 0.5 mm in the transverse plane and below 1 mm along the beam direction. The lepton isolation, defined as the scalar pTsum of all particle candidates,
excluding the lepton itself, in a cone around the lepton, divided by the lepton pT, is required to
be smaller than 0.1 (0.2) for electrons (muons). A cone-size, varying with lepton pT, is chosen
to be∆R= 0.2 for pT < 50 GeV,∆R = 10 GeV/pT for 50 < pT < 200 GeV, and∆R= 0.05 for
pT >200 GeV.
A particle flow (PF) technique [15, 16] is used to reconstruct particle candidates in the event. Jets are clustered from these candidates, excluding charged hadrons not associated to the primary vertex, using the anti-kTclustering algorithm [17] implemented in the FASTJETpackage [18, 19]
with a distance parameter of 0.4. Each jet is required to have pT > 35 GeV where the pT is
corrected for non-uniform detector response and multiple collision (pileup) effects [20, 21], and
|η| <2.4. A jet is removed from the event if it lies within∆R<0.4 of any of the selected leptons.
The scalar sum of all jet transverse momenta is referred to as HT. The magnitude of the negative
vector pT sum of all the PF candidates is referred to as EmissT . Corrections to the jet energy are
propagated to the EmissT using the procedure developed for 7 TeV data [20]. Identification of jets originating from b-quarks is performed with the combined secondary vertex algorithm, using a working point in which the typical efficiency for b quarks is around 65% and the mistagging rate for light-flavor jets is around 1.5% [22].
While the main SM backgrounds are estimated using data control samples, simulated events are used to estimate uncertainties and minor SM background components. Next-to-leading order (NLO) and next-to-NLO cross sections [23–28] are used to normalize the simulated back-ground samples, while NLO plus next-to-leading-logarithm (NLL) calculations [29] are used
3
for the signal samples. Simulated samples of Drell–Yan (DY) production associated with jets (DY+jets), γ+jets, V+V, and ttV (V = W, Z) events are generated with the MADGRAPH [email protected] event generator [23], whilePOWHEGv1 [30] is used for tt and single top quark
production. The matrix element calculations performed with these generators are interfaced
withPYTHIA8 [31] for the simulation of parton showering and hadronization. The NNPDF3.0
parton distribution functions (PDF) [32] are used for all samples. The detector response is sim-ulated with a GEANT4 model [33] of the CMS detector. The simulation of new physics signals is performed using the MADGRAPH5 AMC@NLO program at LO precision with up to 2 addi-tional partons in the matrix elements calculations. Events are then interfaced withPYTHIA8 for fragmentation and hadronization, and simulated using the CMS fast simulation package [34]. Multiple pp interactions are superimposed on the hard collision and the simulated samples are reweighted to reflect the beam conditions. Normalization scale factors are applied to the simulated samples to account for differences between simulation and data in the trigger and reconstruction efficiencies.
4
Signal models
This search targets different modes of neutralino decays into final states with two opposite-sign, same-flavor leptons, jets, and ETmiss originating from the LSPs. In order to study these processes, two simplified models have been considered for the two search modes: one produc-ing a resonant lepton signature through an on-shell Z boson for the “on-Z” search, and another producing an edge-like distribution in the invariant mass of the leptons, for the “edge” search. The first of these simplified models represents gauge mediated supersymmetry breaking SUSY models [35] and is referred to as the GMSB scenario. The model assumes the production of a pair of gluinos (eg) that decay into a pair of quarks (u, d, s, c, or b) and the lightest neutralino
e
χ01. This neutralino decays into an on-shell Z boson and a massless gravitino ( eG) as seen in
Fig. 1 (left). At least one of the Z bosons decays into a pair of leptons producing the signature targeted by the on-Z search.
The signal model for the edge search, referred to as slepton-edge, assumes the production of a pair of bottom squarks, which decay to the next-to-lightest neutralinoχe
0
2and a b-quark. Two
decay modes of theχe
0
2are considered each with 50% probability. In the first one, theχe
0
2decays
to a Z boson and the lightest neutralinoχe
0
1, which is stable. The Z boson can be on or off-shell,
depending on the mass difference between the neutralinos, and decays according to its SM branching fractions. The second one features subsequent two-body decays with an intermedi-ate slepton e`: χe
0
2 →e`` → ``χe0
1. The masses of the sleptons (ee,µe) are assumed degenerate and equal to the average of theχe
0 2 andχe
0
1. The masses of the eb andχe
0
2are free parameters, while
m
e
χ01is fixed at 100 GeV. This scheme allows the position of the signal edge to vary along the
in-variant mass distribution according to the mass difference between theχe
0 2andχe 0 1. The mass of theχe 0
1has been chosen in such a way that the difference to theχe
0
2mass is above 50 GeV, setting
the minimum possible edge position at 50 GeV. An example for one of the possible decays is shown in Fig. 1 (right).
5
Signal regions
Signal regions for the on-Z and edge searches follow two principles: first, they are designed to provide sensitivity to a range of new physics models, including the simplified models defined above, and second, they are designed to investigate excesses in the 8 TeV datasets reported by
P1 P2 e g e g e χ0 1 e χ0 1 q q e G Z Z e G q q P1 P2 eb ¯ eb e χ0 2 e χ0 2 Z(∗) el b f f e χ0 1 e χ0 1 ℓ− ℓ+ b
Figure 1: Diagrams for gluino and eb pair production and decays realized in the simplified models. The GMSB model targeted by the on-Z search is shown on the left. On the right, the slepton-edge model features characteristic edges in the m`` spectrum given by the mass
difference of theχe
0 2andχe
0 1.
the ATLAS and CMS Collaborations [11, 12]. The selections described below are applied in addition to the dilepton selection described in Section 3.
5.1 On-Z signal regions
The on-Z search is divided into a total of three signal region (SR) categories with dilepton invariant mass (m``) in the range 81< m`` <101 GeV. The first two, referred to as “SRA” (2–3
jets and HT>400 GeV) and “SRB” (≥4 jets), focus on events with low and high jet multiplicity.
These categories are further divided according to the number of b-tagged jets and ETmiss. One additional signal region, namely “ATLAS SR”, is defined corresponding to the region showing a 3.0 σ excess in the 8 TeV dataset of the ATLAS Collaboration [12]. The selection details are specified in Section 7.
5.2 Edge search signal regions
The signal regions in the edge search remain largely unchanged with respect to the search performed with the 8 TeV dataset [11]. The requirements on the jet multiplicity and Emiss
T are
similar to the previous analysis, namely EmissT > 100(150)GeV if at least three (two) jets are present. The relative centrality expected in the decays of heavy particles, combined with the performance of the detector in the barrel region compared to the endcaps, motivates a division of the event sample depending on the|η|of the leptons. The signal region is defined as central
if both leptons lie within|η| <1.4 and as forward if at least one of the leptons is located outside
of this|η|range. Furthermore, two exclusive bins are defined in the number of b-tagged jets,
one without and one with at least one such jet.
The improvements in the CMS reconstruction algorithms for the 13 TeV data taking lead to a few differences between the 8 and 13 TeV signal regions. The lepton identification algorithms have been updated for the 13 TeV data taking, with the most relevant improvement being the use of a new electron identification algorithm based on a multivariate discriminator [14]. The jet momentum threshold has been lowered from 40 GeV to 35 GeV given the improved pile-up rejection achieved at√s = 13 TeV, and the maximum|η|has been reduced from to 3.0 to 2.4,
to match the tracker acceptance. The isolation definition has also been modified to include a variable cone size. The rejection of non-prompt leptons has been improved as a consequence of all these changes. Finally, additional non-isolated double-lepton triggers have been added to recover efficiency for very boosted dilepton systems, although the increase in efficiency for the edge signal regions has been found to be small (<4%).
5
split among the four exclusive (0 or>=1 b-tagged jet, central or forward) and two inclusive (central or forward) categories. The five mass regions include the three that were present in the 8 TeV analysis (the low-mass region: 20<m``<70 GeV, the on-Z region: 81<m``<101 GeV,
and the high-mass region: m`` > 120 GeV), as well as the two regions immediately adjacent to
the Z peak (70 < m`` < 81 GeV and 101< m`` <120 GeV). The mass spectrum in the current
analysis thus covers all m``values above 20 GeV.
In order to directly compare the result obtained at 13 TeV with those obtained at 8 TeV, results for the signal regions are also given inclusively in the number of b-tagged jets, Nb-jets ≥ 0. A
summary of all signal regions is given along with the experimental results in Section 7.
6
Standard model background predictions
The backgrounds from SM processes are divided into two types. Those that produce opposite-flavor (OF) pairs (e±µ∓) as often as same-flavor (SF) pairs (µ±µ∓, e±e∓) are referred to as
flavor-symmetric (FS) backgrounds. Among them, the dominant contribution arises from top quark-antitop quark production; sub-leading contributions from WW, Z/γ∗(→ττ), tW
single-top quark production, and leptons from hadron decays are also present. The other category of backgrounds includes flavor-correlated lepton production and only contributes with SF lep-tons. The dominant contributions arise from DY production in association with jets, where the Emiss
T arises from mismeasurement of the jet energies. Smaller contributions come from WZ
and ZZ production, as well as rare processes such as ttZ. These backgrounds are referred to as “Other SM” in this paper.
6.1 Flavor-symmetric backgrounds
The contribution of flavor-symmetric processes in the SF channels is estimated from the OF control sample. While there is a production symmetry between the two channels at particle level, it can be distorted by the different trigger, reconstruction, and identification efficiencies for electrons and muons. The background estimate is therefore obtained from the observed OF yield by applying a multiplicative correction factor, RSF/OF. This factor is determined by two
independent methods, a direct measurement in a control region enriched in FS backgrounds, and from the measurement of lepton efficiencies, factorized into the effects of reconstruction, identification, and trigger.
The direct measurement is performed in the region with Njets =2 and 100 <ETmiss <150 GeV,
excluding the mass range 70 < m`` < 110 GeV to reduce background contributions from
res-onant Z-boson production. Here, RSF/OF is evaluated using the observed yield of SF and OF events, 4RSF/OF= NSF/NOF. The applicability of this value in the signal region is confirmed by
comparing it with the RSF/OFvalue obtained in the signal region for tt simulated events. The
difference between both values is found to be smaller than its statistical uncertainty (3%). The latter value is assigned as the systematic uncertainty in the measurement.
For the factorized approach, the ratio of muon to electron reconstruction and identification efficiencies, rµ/e, is measured in a DY-enriched region with Njets ≥ 2 and EmissT < 50 GeV and
requiring 60 < m`` < 120 GeV, resulting in a large sample of e±e∓ and µ±µ∓ events with
similar kinematics to the signal region in terms of jet multiplicity. Assuming the factorization of lepton efficiencies in an event, the efficiency ratio is measured as rµ/e =
√
Nµ+µ−/Ne+e−. A systematic uncertainty of 10% (20%) is assigned to rµ/ein the central (forward) lepton rapidity
selection based on studies of its dependency on the lepton kinematics, the amount of ETmiss, and the jet multiplicity. The trigger efficiencies for the three different flavor combinations are used
to define the factor RT =
√
eTµ±µ∓eTe±e∓/eeT±µ∓, which takes into account the difference between SF and OF channels at the trigger level. The final correction is RSF/OF=(1/2)(rµ/e+r
−1
µ/e)RT.
Here, rµ/eis summed with its inverse, leading to a large reduction of the associated uncertainty.
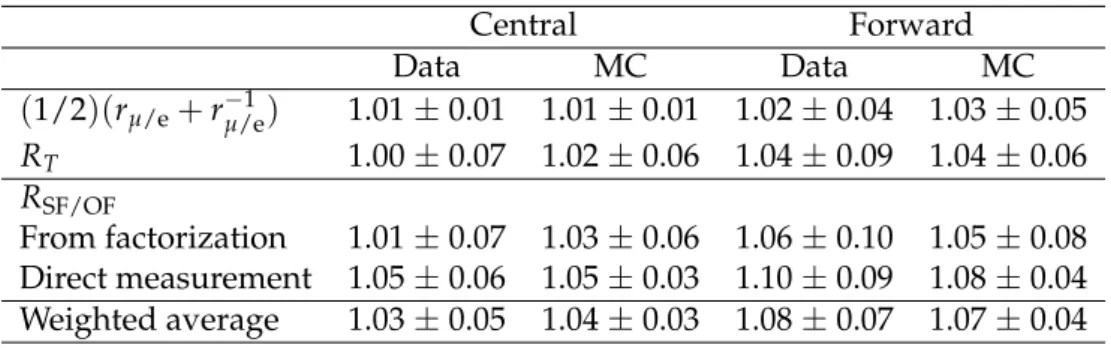
The results of the direct measurement and the factorization method are shown in Table 1. Since the results are in agreement and are obtained on independent data samples, they are combined using the weighted average. The resulting correction is RSF/OF = 1.03±0.05 (1.08±0.07) for
the central (forward) lepton rapidity selection.
Table 1: Summary of RSF/OFvalues obtained in data and simulation using the direct and
fac-torized methods, and the final combination.
Central Forward Data MC Data MC (1/2)(rµ/e+r−1µ/e) 1.01±0.01 1.01±0.01 1.02±0.04 1.03±0.05 RT 1.00±0.07 1.02±0.06 1.04±0.09 1.04±0.06 RSF/OF From factorization 1.01±0.07 1.03±0.06 1.06±0.10 1.05±0.08 Direct measurement 1.05±0.06 1.05±0.03 1.10±0.09 1.08±0.04 Weighted average 1.03±0.05 1.04±0.03 1.08±0.07 1.07±0.04 6.2 Drell–Yan-like backgrounds The Emiss
T from the DY background is estimated from EmissT templates obtained from a data
con-trol region. The main premise of this estimate based on data is that Emiss
T in Z+jets events
orig-inates from the limited detector resolution when measuring the objects making up the hadronic system that recoils against the Z boson. We estimate the shape of the EmissT distribution from a control sample of γ+jets events where the jet system recoils against a photon instead of a Z boson. Signal regions requiring at least one b-tagged jet can lead to a small amount of addi-tional EmissT due to the neutrinos in semileptonic b quark decays. To account for this effect, the ETmisstemplates are extracted from a control sample of γ+jets events with at least one b-tagged jet.
The γ+jets events in data are selected with a suite of single-photon triggers with pTthresholds
varying from 22 to 165 GeV. The triggers with thresholds below 165 GeV are prescaled such that only a fraction of accepted events are recorded, and the events are weighted by the trigger prescales to match the integrated luminosity collected with the signal dilepton triggers. In order to account for kinematic differences between the hadronic systems in the γ+jets and the Z+jets sample, the γ+jets sample is reweighted such that the boson pT distribution matches
that of the Z+jets sample. This reweighting is performed for each signal region, where the same requirements are applied to the Z+jets and the γ+jets samples. The resulting Emiss
T
distribution is then normalized to the observed data yield in the region ETmiss < 50 GeV where Z+jets is the dominant background.
The control sample used to estimate this background does not need to have a high purity of photons, since the EmissT is assumed to originate from jet mismeasurement. However, it is re-quired that the photon-like object be well measured so as to not contribute to the EmissT mis-measurement. The stability of the photon selection is tested by repeating this background measurement after tightening the photon ID requirements, and it is found that the results are consistent with the measurement done using the looser selection. In order to ensure the photon-like object is sufficiently well-measured and that the EmissT in the γ+jets sample comes primarily from the mismeasurement of the jet system, the following conditions are required:
6.2 Drell–Yan-like backgrounds 7
∆φ(EmissT , γ) >0.4, a veto on events where the photon can be connected to a pattern of hits in the pixel detector, and the photon to be matched to a jet within a cone of∆R=0.4. The require-ment ∆φ(ETmiss, γ) > 0.4 protects against under-measurement of the photon energy, which is much more likely for calorimeter-based quantities than over-measurement. Finally, the elec-tromagnetic fraction of the matched jet (fraction of jet energy deposited in the elecelec-tromagnetic calorimeter with respect to the total energy deposited in both, the electromagnetic and hadronic calorimeter) is required to be>0.7.
The dominant uncertainties in the ETmisstemplate prediction come from the limited size of the samples used. The uncertainty in the prediction takes into account the statistical uncertainty of the γ+jets sample in the signal ETmiss regions, which ranges from 10–50%. The statistical uncertainty of the normalization for Emiss
T < 50 GeV is included and ranges from 4–10%, as
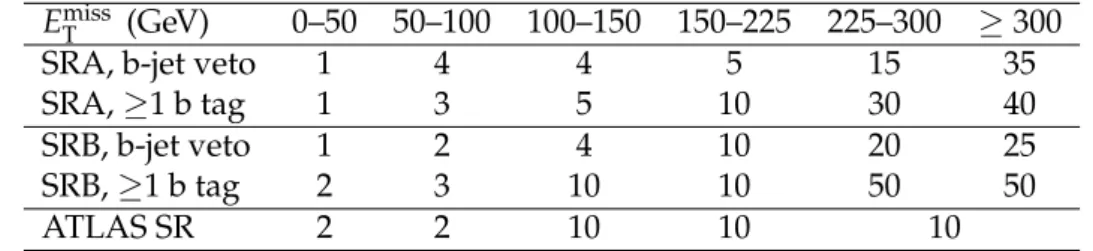
shown in Table 2. A closure test of the method is performed in simulation, using γ+jets to predict the yield of Z+jets. An uncertainty is assigned from the results of this test as either the largest discrepancy between the γ+jets prediction and the Z+jets yield for each EmissT region, or the MC statistical uncertainty, whichever is larger. The values are listed in Table 3 and vary between 4 and 50%, depending on the ETmissregion. Finally, the impact of photon purity on the estimate is studied in data by repeating the prediction with a tighter photon selection. Since the difference from the nominal prediction was smaller than the statistical uncertainty in all regions, no additional uncertainty was assigned.
Table 2: Statistical uncertainties in the normalization of the EmissT template prediction in the ETmiss <50 GeV range, for each signal region. These are taken as a systematic uncertainty in the background prediction. The definitions of SRA, SRB, and ATLAS SR are found in Section 5.1 and Table 4.
Signal region SRA SRB ATLAS SR
b tagging b-jet veto ≥1 b tag b-jet veto ≥1 b tag — Uncertainty 4 % 10 % 3 % 6 % 3 % Table 3: Systematic uncertainties in percentage for the Emiss
T template method from the MC
closure test, shown for all the on-Z signal regions. The definitions of SRA, SRB, and ATLAS SR are found in Section 5.1 and Table 4.
EmissT (GeV) 0–50 50–100 100–150 150–225 225–300 ≥300 SRA, b-jet veto 1 4 4 5 15 35 SRA,≥1 b tag 1 3 5 10 30 40 SRB, b-jet veto 1 2 4 10 20 25 SRB,≥1 b tag 2 3 10 10 50 50
ATLAS SR 2 2 10 10 10
6.2.1 Other standard model processes with a Z boson
The method using EmissT templates only predicts instrumental ETmiss from jet mismeasurement and thus does not include the genuine EmissT from neutrinos expected in processes like W(`ν)Z(``),
Z(``)Z(νν), or rarer processes such as ttZ. These processes contribute a small fraction of the
overall background and are determined with MC simulation. The MC prediction is compared to data in 3- and 4-lepton control regions. Agreement is observed, and a conservative uncer-tainty of 50% is assigned based on the limited statistics of these regions at higher jet multiplici-ties.
6.2.2 Drell–Yan background in the edge search
A procedure was designed to propagate the estimations obtained using the EmissT templates for the on-Z regions to the off-Z mass regions. For this reason, a ratio rout/in is measured in the
DY-dominated control region where rµ/e is also obtained. The numerator of this ratio is the
number of SF events outside of the Z boson mass window, while the denominator is the SF yield within this window. Opposite-flavor yields in both the numerator and denominator are subtracted from the respective same-flavor yields in order to correct for FS contributions in the region where rout/in is measured. The final ratio is unity for the mass region between 81 and 101 GeV, and varies between 2% and 7% for the other mass ranges, with values decreasing as a function of the invariant mass. The final contribution to the edge-like signal regions is then the on-Z prediction multiplied by this ratio for each of the signal regions. An uncertainty of 25% is assigned to rout/into cover its dependencies on EmissT and the jet multiplicity.
7
Results
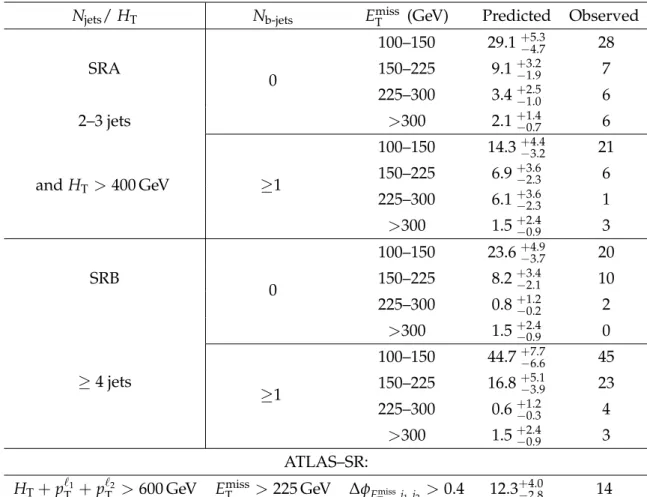
The observed number of events in the different signal regions is compared with the background estimates obtained with the methods explained above for the on-Z and the edge searches. The results for the 16 exclusive signal regions of the on-Z search and the additional ATLAS signal region are presented in Table 4. A graphical representation of these results can be seen in Fig. 2 (upper), where the background prediction has been divided into its three components: FS, DY, and other processes with a Z boson, in order to illustrate their relative contributions in the different signal regions.
The edge-like search features two distinct m``spectra according to the centrality of the leptons,
each of which is divided into five bins. This leads to a total of 10 mutually exclusive signal regions that are further divided according to the presence or absence of any b-tagged jet in the event. To be consistent with the 8 TeV search, the information without any selection on the number of b-tagged jets is also provided. Table 5 summarizes the SM predictions and the observations in all these signal regions. A graphical representation of these results is shown in Fig. 2 (lower), including the relative contributions of the different backgrounds.
The agreement between the observation and the prediction is found to be better than 1 σ in most of the regions. The largest deviation found corresponds to a local significance of 1.8 σ. This result is compatible with the null hypothesis provided the large number of signal regions. Figure 3 (upper) shows the ETmiss distribution for the on-Z ATLAS signal region, while Fig. 3 (lower), shows the m`` distribution for the edge region without any selection on the number
of b-tagged jets and with central leptons, as in the region where CMS reported the excess at
√
s =8 TeV. The comparison between the observation and prediction in these two regions of interest does not indicate the presence of any excess with respect to the SM expectation. The 3.0 σ discrepancy between observation and prediction in the first bin of the m`` distribution
in Fig. 3 (lower), has been studied in detail in several control regions with similar kinematic properties, and also by modifying the trigger, identification and isolation parameters of the leptons. Since no sign of any systematic effect has been found, we conclude this to be consistent with a statistical fluctuation.
8
Interpretation
The results of the analysis are interpreted in terms of simplified models. In order to quantify the sensitivity of the on-Z and edge searches, two simulated samples with a scan of mass points
8.1 Systematic uncertainty in the signal yield 9
Table 4: Observed and predicted yields for the on-Z search. The signal regions SRA and SRB are binned as a function of the b jet multiplicity and the missing transverse momentum. In the ATLAS SR, the transverse momenta of the two highest pT leptons are included when
calculating HT, and an additional requirement is imposed on the angle between the EmissT and
the two leading jets∆φEmiss
T ,j1,j2 >0.4.
Njets/ HT Nb-jets EmissT (GeV) Predicted Observed
0 100–150 29.1+5.3−4.7 28 SRA 150–225 9.1+3.2−1.9 7 225–300 3.4+2.5−1.0 6 2–3 jets >300 2.1+1.4−0.7 6 and HT >400 GeV ≥1 100–150 14.3+4.4−3.2 21 150–225 6.9+3.6−2.3 6 225–300 6.1+−2.33.6 1 >300 1.5+2.4−0.9 3 0 100–150 23.6+−3.74.9 20 SRB 150–225 8.2+3.4−2.1 10 225–300 0.8+1.2−0.2 2 ≥4 jets >300 1.5+2.4−0.9 0 ≥1 100–150 44.7+7.7−6.6 45 150–225 16.8+5.1−3.9 23 225–300 0.6+1.2−0.3 4 >300 1.5+2.4−0.9 3 ATLAS–SR: HT+pT`1+pT`2 >600 GeV EmissT >225 GeV ∆φEmiss
T ,j1,j2 >0.4 12.3 +4.0
−2.8 14
of the GMSB and slepton-edge models have been produced. Upper limits on the cross section multiplied by the branching ratio have been calculated at a 95% confidence level (CL) using the CLScriterion and an asymptotic formulation [36–39], taking into account the statistical and
systematic uncertainties in the signal yields and the background predictions.
8.1 Systematic uncertainty in the signal yield
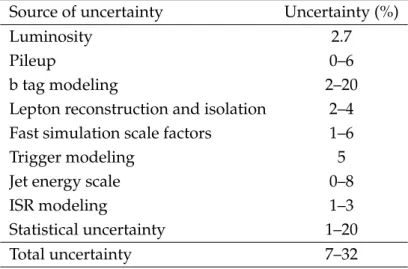
The systematic uncertainties in the signal yield have been evaluated by comparing the yields obtained after making a variation on the source of the systematic effect and the nominal yields. The uncertainty related to the measurement of the integrated luminosity is 2.7% [40]. The un-certainty in the corrections used to account for lepton identification and isolation efficiency differences between data and simulation is 2–4% in the signal acceptance. The uncertainty in the b tagging efficiency and mistag probability are 2–5% except for the edge signal regions without b tags, where they can range up to 20%. A further systematic uncertainty of 1–6% is considered on the scale factors correcting for the differences between fast and GEANT4 simula-tions for leptons. Dilepton trigger efficiencies ranging between 87% and 96%, and depending on the lepton flavor, are measured in data and applied as an overall scale factor to the signal simulation with a systematic uncertainty of 5%. The uncertainty in the jet energy scale varies between 0% and 8% depending on the signal kinematics. The uncertainty associated with the
100-150 GeV miss T E 150-225 GeV miss T E 225-300 GeV miss T E > 300 GeV miss T E 100-150 GeV miss T E 150-225 GeV miss T E 225-300 GeV miss T E > 300 GeV miss T E 100-150 GeV miss T E 150-225 GeV miss T E 225-300 GeV miss T E > 300 GeV miss T E 100-150 GeV miss T E 150-225 GeV miss T E 225-300 GeV miss T E > 300 GeV miss T E ATLAS SR
Events
0
20
40
60
80
100
(13 TeV) -1 2.3 fbCMS
Data Total uncertaintyFlavor symmetric Z+jets Other SM
> 400 GeV T H = 2-3 jets N 4 ≥ jets N = 0 b N 1 ≥ b N Nb = 0 1 ≥ b N
inclusive (c) b-Veto (c) b-Tagged (c) inclusive (f) b-Veto (f) b-Tagged (f) inclusive (c) b-Veto (c) b-Tagged (c) inclusive (f) b-Veto (f) b-Tagged (f) inclusive (c) b-Veto (c) b-Tagged (c) inclusive (f) b-Veto (f) b-Tagged (f) inclusive (c) b-Veto (c) b-Tagged (c) inclusive (f) b-Veto (f) b-Tagged (f) inclusive (c) b-Veto (c) b-Tagged (c) inclusive (f) b-Veto (f) b-Tagged (f)
Events 0 100 200 300 400 500 600 700 800 (13 TeV) -1 2.3 fb
CMS
Data Total uncertaintyFlavor symmetric Z+jets Other SM
low-mass below-Z on-Z above-Z high-mass
Figure 2: Overview of the results in all signal regions of the on-Z search (upper) and edge search (lower). The labels (c) and (f) refer to central and forward leptons. The data points in black are compared to the background expectation, which is shown as a solid blue line, together with its uncertainty, shown as a light blue band. The background components are shown as a stacked histogram with solid white color for the FS background, solid dark green for DY and dark purple for others.
modeling of initial-state radiation (ISR) is 1–3%. The uncertainty in the correction to account for the pileup in the simulation is evaluated by shifting the inelastic cross section by±5% and amounts to less than 6% on signal acceptance. Finally the statistical uncertainty on the number of simulated events is also considered and found to be in the range 1–20%, where the regions with low population of signal due to the acceptance in ETmissand/or b-tag multiplicity are most affected. These uncertainties are summarized in Table 6.
8.2 Interpretation using simplified models 11
Table 5: Results for the edge-like search in all 30 signal regions. The non-FS component of the total background is given separately in the brackets. All signal regions require EmissT
>150 (100) GeV if Njets ≥2 (3).
Nb-jets ≥0 Nb-jets=0 Nb-jets ≥1 m``range (GeV) Pred. Obs. Pred. Obs. Pred. Obs.
Central 20–70 477±30 445 130±13 135 347±24 310 ( 4.8±1.4) ( 3.6±1.1) ( 1.2±0.3) 70–81 134±13 131 40±6 33 94±10 98 ( 2.7±0.8) ( 2.1±0.6) ( 0.7±0.2) 81–101 254±18 275 95±11 107 160±14 168 ( 62±8) ( 46±8) ( 16±2) 101–120 166±15 165 48±7 43 118±12 122 ( 2.1±0.6) ( 1.6±0.5) ( 0.5±0.2) >120 477±30 518 112±12 144 365±25 374 ( 1.6±0.5) ( 1.2±0.4) ( 0.4±0.1) Forward 20–70 111±12 136 36±6 45 75±10 91 ( 1.6±0.4) ( 1.2±0.4) ( 0.4±0.1) 70–81 47±7 50 15±4 14 32±6 36 ( 1.2±0.3) ( 0.9±0.3) ( 0.3±0.1) 81–101 100±10 92 45±6 39 55±8 53 ( 24±3) ( 18±3) ( 6.0±1.2) 101–120 78±10 51 22±5 15 55±8 36 ( 1.0±0.3) ( 0.7±0.2) ( 0.2±0.1) >120 308±25 306 85±10 95 223±20 211 ( 0.7±0.2) ( 0.5±0.2) ( 0.2±0.1)
8.2 Interpretation using simplified models
Since the GMSB model leads to a signature containing at least 6 jets in the final state, most of the sensitivity of the on-Z search is provided by the high jet multiplicity signal regions defined within the SRB category. We only consider the number of observed and predicted events in these regions to set limits on this model. The expected and observed limits are presented in Fig. 4. We exclude gluino masses up to 1.28 (1.03) TeV for large (small) neutralino masses. These results show an improvement with respect to the 8 TeV result where we obtained an observed and expected limits for gluino masses from 1.0 to 1.1 TeV.
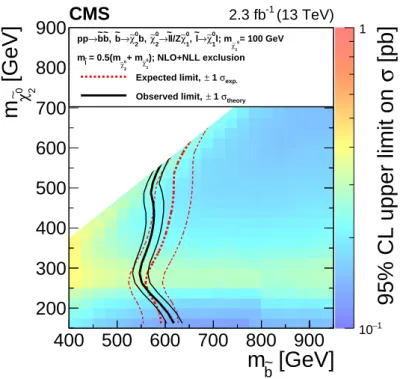
The edge search is interpreted using the slepton-edge model, combining all the invariant mass,
|η|, and mutually exclusive b tag regions. Figure 5 shows the exclusion contour in the plane
of the masses of the bottom squark and the second neutralino. We exclude bottom squark masses up to 620 GeV at lowχe
0
2masses. The slight decrease in sensitivity at a neutralino mass
of∼250 GeV corresponds to a kinematic edge located at∼150–200 GeV. In this case the signal is spread evenly across all mass regions, while in the case of low (high) χe
0
2 masses, the
ma-jority of signal events fall into the low- (high-) mass bin, which increases the sensitivity for these mass points. The expected upper limits in the bottom squark/neutralino mass plane are similar to the limits set by the 8 TeV analysis. In two parameter regions the expected limits are slightly improved due to the introduction of new signal regions. The introduction of the below-Z and above-Z signal region increases the sensitivity of the analysis for sbottom masses of about 550 GeV and neutralino masses of around 250 GeV. The second improvement is the
Prediction Data 0.5 1 1.5 2 [GeV] miss T E 0 50 100 150 200 250 300 350 Events / 25 GeV 1 10 2 10 3 10 Data templates miss T E FS background Other SM (13 TeV) -1 2.3 fb CMS > 600 GeV T ) + H 1,2 (lep T p Σ ) > 0.4 1,2 , jet miss T (E φ ∆ 2 ≥ jets N [GeV] ll m 50 100 150 200 250 300 Events / 10 GeV 0 50 100 150 200 250 (13 TeV) -1 2.3 fb
CMS Central signal region Data
Flavor symmetric Z+jets
Other SM Total uncertainty Slepton signal model
= 175 GeV 0 2 χ∼ = 450 GeV, m b ~ m = 175 GeV 0 2 χ∼ = 550 GeV, m b ~ m = 175 GeV 0 2 χ∼ = 650 GeV, m b ~ m Prediction Data 0 0.5 1 1.5 2
Figure 3: The EmissT and m``distributions are shown for data and background predictions in the
on-Z ATLAS signal region (upper) and for the region where CMS reported an excess in Run 1 (lower). The “Other SM” category includes WZ, ZZ, and other rare SM backgrounds taken from MC. The red lines in the m``distribution correspond to three different slepton-edge signal
hypotheses overlaid on top of the background distribution.
categorization according to the number of b-tagged jets that gives additional sensitivity close to the sbottom and neutralino mass diagonal where events with zero b-tagged jets become impor-tant since the produced b jets have less energy and are often not identified. The observed upper limits in the region with small neutralino masses have been largely improved with respect to
13
Table 6: List of systematic uncertainties taken into account for the signal yields and typical values.
Source of uncertainty Uncertainty (%)
Luminosity 2.7
Pileup 0–6
b tag modeling 2–20
Lepton reconstruction and isolation 2–4 Fast simulation scale factors 1–6
Trigger modeling 5
Jet energy scale 0–8
ISR modeling 1–3
Statistical uncertainty 1–20 Total uncertainty 7–32 the 8 TeV results from 500 to approximately 620 GeV.
9
Summary
A search for physics beyond the standard model has been presented in the opposite-sign, same-flavor lepton final state using a data sample of pp collisions collected at a center-of-mass energy of 13 TeV, corresponding to an integrated luminosity of 2.3 fb−1, recorded with the CMS detec-tor in 2015. Searches are performed for signals that either produce a kinematic edge, or a peak at the Z boson mass, in the dilepton invariant mass distribution. Comparing the observation to
[GeV]
g ~m
1000 1100 1200 1300 1400 1500[GeV]
1 0 χ ∼m
200 400 600 800 1000 1200 1400 1600[pb]
σ
95% CL upper limit on
-2 10 -1 10 1[pb]
σ
95% CL upper limit on
-2 10 -1 10 1 exp. σ 1 ± Expected limit, theory σ 1 ± Observed limit, = 1 GeV G~ ; m G~ Z → 0 1 χ , 0 1 χ 2j + → g ~ , g ~ g ~ → pp NLO+NLL exclusion (13 TeV) -1 2.3 fbCMS
Figure 4: Cross section upper limits and exclusions contours at 95% CL with the results of the on-Z search interpreted in the GMSB model. The region to the left of the red dotted (black solid) line shows the masses which are excluded by the expected (observed) limit.
estimates for SM backgrounds obtained from data control samples, no statistically significant evidence for a signal has been observed. Notably, this is true for the two event selections where excesses of 2.6 and 3.0 σ significance had been observed by the CMS and ATLAS collaborations in their respective 8 TeV results [11, 12].
The search for events containing an on-shell Z boson is interpreted in a model of gauge-mediated supersymmetry breaking, where the Z bosons are produced in decay chains initiated through gluino pair production, and where the branching ratios have been fixed to 100% to produce the desired topology. Gluino masses below 1.28 TeV for high neutralino masses and 1.03 TeV for low neutralino masses have been excluded, extending the previous exclusion limits derived from a similar analysis at 8 TeV by almost 200 GeV.
The search for an edge is interpreted in a simplified model based on bottom squark pair pro-duction, where dilepton mass edges are produced in decay chains containing the two lightest neutralinos and a slepton, where again the branching ratios have been fixed to produce the de-sired topology. Bottom squark masses below 550 and 620 GeV have been excluded, depending on theχe
0
2mass. These limits are similar to previous exclusion limits except for lowχe
0
2masses
where the excluded limits have been extended by about 100 GeV.
Acknowledgments
We congratulate our colleagues in the CERN accelerator departments for the excellent perfor-mance of the LHC and thank the technical and administrative staffs at CERN and at other CMS institutes for their contributions to the success of the CMS effort. In addition, we gratefully acknowledge the computing centers and personnel of the Worldwide LHC Computing Grid for delivering so effectively the computing infrastructure essential to our analyses. Finally,
[GeV]
b~m
400
500
600
700
800
900
[GeV]
0 2 χ ∼m
200
300
400
500
600
700
800
900
[pb]
σ
95% CL upper limit on
1 − 10 1 (13 TeV) -1 2.3 fbCMS
exp. σ 1 ± Expected limit, theory σ 1 ± Observed limit, ); NLO+NLL exclusion 0 1 χ∼ + m 0 2 χ∼ = 0.5(m l ~ m = 100 GeV 0 1 χ∼ l; m 0 1 χ∼ → l ~ , 0 1 χ∼ l/Z l ~ → 0 2 χ∼ b, 0 2 χ∼ → b ~ , b ~ b ~ → ppFigure 5: Cross section upper limits and exclusion contours at 95% CL with the results of the edge search interpreted in the slepton-edge model. The region to the left of the red dotted (black solid) line shows the masses which are excluded by the expected (observed) limit.
References 15
we acknowledge the enduring support for the construction and operation of the LHC and the CMS detector provided by the following funding agencies: BMWFW and FWF (Austria); FNRS and FWO (Belgium); CNPq, CAPES, FAPERJ, and FAPESP (Brazil); MES (Bulgaria); CERN; CAS, MoST, and NSFC (China); COLCIENCIAS (Colombia); MSES and CSF (Croatia); RPF (Cyprus); SENESCYT (Ecuador); MoER, ERC IUT and ERDF (Estonia); Academy of Finland, MEC, and HIP (Finland); CEA and CNRS/IN2P3 (France); BMBF, DFG, and HGF (Germany); GSRT (Greece); OTKA and NIH (Hungary); DAE and DST (India); IPM (Iran); SFI (Ireland); INFN (Italy); MSIP and NRF (Republic of Korea); LAS (Lithuania); MOE and UM (Malaysia); BUAP, CINVESTAV, CONACYT, LNS, SEP, and UASLP-FAI (Mexico); MBIE (New Zealand); PAEC (Pakistan); MSHE and NSC (Poland); FCT (Portugal); JINR (Dubna); MON, RosAtom, RAS and RFBR (Russia); MESTD (Serbia); SEIDI and CPAN (Spain); Swiss Funding Agencies (Switzerland); MST (Taipei); ThEPCenter, IPST, STAR and NSTDA (Thailand); TUBITAK and TAEK (Turkey); NASU and SFFR (Ukraine); STFC (United Kingdom); DOE and NSF (USA). Individuals have received support from the Marie-Curie program and the European Research Council and EPLANET (European Union); the Leventis Foundation; the A. P. Sloan Founda-tion; the Alexander von Humboldt FoundaFounda-tion; the Belgian Federal Science Policy Office; the Fonds pour la Formation `a la Recherche dans l’Industrie et dans l’Agriculture (FRIA-Belgium); the Agentschap voor Innovatie door Wetenschap en Technologie (IWT-Belgium); the Ministry of Education, Youth and Sports (MEYS) of the Czech Republic; the Council of Science and In-dustrial Research, India; the HOMING PLUS program of the Foundation for Polish Science, co-financed from European Union, Regional Development Fund, the Mobility Plus program of the Ministry of Science and Higher Education, the OPUS program contract 2014/13/B/ST2/02543 and contract Sonata-bis DEC-2012/07/E/ST2/01406 of the National Science Center (Poland); the Thalis and Aristeia programs cofinanced by EU-ESF and the Greek NSRF; the National Priorities Research Program by Qatar National Research Fund; the Programa Clar´ın-COFUND del Principado de Asturias; the Rachadapisek Sompot Fund for Postdoctoral Fellowship, Chu-lalongkorn University and the ChuChu-lalongkorn Academic into Its 2nd Century Project Advance-ment Project (Thailand); and the Welch Foundation, contract C-1845.
References
[1] P. Ramond, “Dual theory for free fermions”, Phys. Rev. D 3 (1971) 2415, doi:10.1103/PhysRevD.3.2415.
[2] Y. A. Gol’fand and E. P. Likhtman, “Extension of the algebra of Poincar´e group generators and violation of P invariance”, JETP Lett. 13 (1971) 323.
[3] A. Neveu and J. H. Schwarz, “Factorizable dual model of pions”, Nucl. Phys. B 31 (1971) 86, doi:10.1016/0550-3213(71)90448-2.
[4] D. V. Volkov and V. P. Akulov, “Possible universal neutrino interaction”, JETP Lett. 16 (1972) 438.
[5] J. Wess and B. Zumino, “A Lagrangian model invariant under supergauge
transformations”, Phys. Lett. B 49 (1974) 52, doi:10.1016/0370-2693(74)90578-4. [6] J. Wess and B. Zumino, “Supergauge transformations in four dimensions”, Nucl. Phys. B
[7] P. Fayet, “Supergauge invariant extension of the Higgs mechanism and a model for the electron and its neutrino”, Nucl. Phys. B 90 (1975) 104,
doi:10.1016/0550-3213(75)90636-7.
[8] H. P. Nilles, “Supersymmetry, supergravity and particle physics”, Phys. Rep. 110 (1984) 1, doi:10.1016/0370-1573(84)90008-5.
[9] G. R. Farrar and P. Fayet, “Phenomenology of the Production, Decay, and Detection of New Hadronic States Associated with Supersymmetry”, Phys. Lett. B 76 (1978) 575, doi:10.1016/0370-2693(78)90858-4.
[10] I. Hinchliffe et al., “Precision SUSY measurements at CERN LHC”, Phys. Rev. D 55 (1997) 5520, doi:10.1103/PhysRevD.55.5520, arXiv:hep-ph/9610544.
[11] CMS Collaboration, “Search for physics beyond the standard model in events with two leptons, jets, and missing transverse momentum in pp collisions at√s =8 TeV”, JHEP
04(2015) 124, doi:10.1007/JHEP04(2015)124, arXiv:1502.06031.
[12] ATLAS Collaboration, “Search for supersymmetry in events containing a same-flavour opposite-sign dilepton pair, jets, and large missing transverse momentum in√s=8 TeV pp collisions with the ATLAS detector”, Eur. Phys. J. C 75 (2015) 318,
doi:10.1140/epjc/s10052-015-3518-2, arXiv:1503.03290. [Erratum ibid. C
75(2015) 463].
[13] CMS Collaboration, “The CMS experiment at the CERN LHC”, JINST 3 (2008) S08004, doi:10.1088/1748-0221/3/08/S08004.
[14] CMS Collaboration, “Performance of electron reconstruction and selection with the CMS detector in proton-proton collisions at√s=8 TeV”, JINST 10 (2015) P06005,
doi:10.1088/1748-0221/10/06/P06005, arXiv:1502.02701.
[15] CMS Collaboration, “Particle–Flow Event Reconstruction in CMS and Performance for Jets, Taus, and EmissT ”, CMS Physics Analysis Summary CMS-PAS-PFT-09-001, 2009. [16] CMS Collaboration, “Commissioning of the Particle-flow Event Reconstruction with the
first LHC collisions recorded in the CMS detector”, CMS Physics Analysis Summary CMS-PAS-PFT-10-001, 2010.
[17] M. Cacciari, G. P. Salam, and G. Soyez, “The anti-ktjet clustering algorithm”, JHEP 04
(2008) 063, doi:10.1088/1126-6708/2008/04/063, arXiv:0802.1189.
[18] M. Cacciari, G. P. Salam, and G. Soyez, “FastJet user manual”, Eur. Phys. J. C 72 (2012) 1896, doi:10.1140/epjc/s10052-012-1896-2, arXiv:1111.6097.
[19] M. Cacciari and G. P. Salam, “Dispelling the N3myth for the ktjet-finder”, Phys. Lett. B
641(2006) 57, doi:10.1016/j.physletb.2006.08.037, arXiv:hep-ph/0512210. [20] CMS Collaboration, “Determination of Jet Energy Calibration and Transverse
Momentum Resolution in CMS”, JINST 6 (2011) P11002,
doi:10.1088/1748-0221/6/11/P11002, arXiv:1107.4277.
[21] M. Cacciari and G. P. Salam, “Pileup subtraction using jet areas”, Phys. Lett. B 659 (2008) 119, doi:10.1016/j.physletb.2007.09.077, arXiv:0707.1378.
References 17
[22] CMS Collaboration, “Identification of b quark jets at the CMS Experiment in the LHC Run 2”, CMS Physics Analysis Summary CMS-PAS-BTV-15-001, 2016.
[23] J. Alwall et al., “The automated computation of tree-level and next-to-leading order differential cross sections, and their matching to parton shower simulations”, JHEP 07 (2014) 079, doi:10.1007/JHEP07(2014)079, arXiv:1405.0301.
[24] S. Alioli, P. Nason, C. Oleari, and E. Re, “NLO single-top production matched with shower in POWHEG: s- and t-channel contributions”, JHEP 09 (2009) 111,
doi:10.1088/1126-6708/2009/09/111, arXiv:0907.4076. [Erratum: doi:10.1007/JHEP02(2010)011].
[25] E. Re, “Single-top Wt-channel production matched with parton showers using the POWHEG method”, Eur. Phys. J. C 71 (2011) 1547,
doi:10.1140/epjc/s10052-011-1547-z, arXiv:1009.2450.
[26] R. Gavin, Y. Li, F. Petriello, and S. Quackenbush, “FEWZ 2.0: A code for hadronic Z production at next-to-next-to-leading order”, Comput. Phys. Commun. 182 (2011) 2388, doi:10.1016/j.cpc.2011.06.008, arXiv:1011.3540.
[27] R. Gavin, Y. Li, F. Petriello, and S. Quackenbush, “W Physics at the LHC with FEWZ 2.1”, Comput. Phys. Commun. 184 (2013) 208, doi:10.1016/j.cpc.2012.09.005,
arXiv:1201.5896.
[28] M. Czakon and A. Mitov, “Top++: A Program for the Calculation of the Top-Pair Cross-Section at Hadron Colliders”, Comput. Phys. Commun. 185 (2014) 2930, doi:10.1016/j.cpc.2014.06.021, arXiv:1112.5675.
[29] C. Borschensky et al., “Squark and gluino production cross sections in pp collisions at√s = 13, 14, 33 and 100 TeV”, Eur. Phys. J. C 74 (2014), no. 12, 3174,
doi:10.1140/epjc/s10052-014-3174-y, arXiv:1407.5066.
[30] S. Frixione, P. Nason, and C. Oleari, “Matching NLO QCD computations with Parton Shower simulations: the POWHEG method”, JHEP 11 (2007) 070,
doi:10.1088/1126-6708/2007/11/070, arXiv:0709.2092.
[31] T. Sj ¨ostrand, S. Mrenna, and P. Skands, “A brief introduction to PYTHIA 8.1”, Comp. Phys. Comm. 178 (2008) 852, doi:10.1016/j.cpc.2008.01.036,
arXiv:0710.3820.
[32] NNPDF Collaboration, “Parton distributions for the LHC Run II”, JHEP 04 (2015) 040, doi:10.1007/JHEP04(2015)040, arXiv:1410.8849.
[33] GEANT4 Collaboration, “GEANT4 — a simulation toolkit”, Nucl. Instrum. Meth. A 506 (2003) 250, doi:10.1016/S0168-9002(03)01368-8.
[34] S. Abdullin et al., “The fast simulation of the CMS detector at LHC”, J. Phys. Conf. Ser.
331(2011) 032049, doi:10.1088/1742-6596/331/3/032049.
[35] S. P. Martin, “A Supersymmetry Primer”, in Perspectives on Supersymmetry II, G. L. Kane, ed. arXiv:hep-ph/9709356. Adv. Ser. Direct. High Energy Phys., vol. 21 (2010) 1. doi:10.1142/9789814307505_0001.
[36] T. Junk, “Confidence level computation for combining searches with small statistics”, Nucl. Instrum. Meth. A 434 (1999) 435, doi:10.1016/S0168-9002(99)00498-2, arXiv:hep-ex/9902006.
[37] A. L. Read, “Presentation of search results: the CLstechnique”, J. Phys. G 28 (2002) 2693,
doi:10.1088/0954-3899/28/10/313.
[38] ATLAS and CMS Collaborations, “Procedure for the LHC Higgs boson search combination in summer 2011”, Technical Report ATL-PHYS-PUB-2011-011, CMS-NOTE-2011-005, CERN, 2011.
[39] G. Cowan, K. Cranmer, E. Gross, and O. Vitells, “Asymptotic formulae for likelihood-based tests of new physics”, Eur. Phys. J. C 71 (2011) 1554,
doi:10.1140/epjc/s10052-011-1554-0, arXiv:1007.1727. [Erratum: doi:10.1140/epjc/s10052-013-2501-z].
[40] CMS Collaboration, “CMS Luminosity Measurement for the 2015 Data Taking Period”, Technical Report CMS-PAS-LUM-15-001, CERN, 2016.
19
A
The CMS Collaboration
Yerevan Physics Institute, Yerevan, Armenia
V. Khachatryan, A.M. Sirunyan, A. Tumasyan
Institut f ¨ur Hochenergiephysik der OeAW, Wien, Austria
W. Adam, E. Asilar, T. Bergauer, J. Brandstetter, E. Brondolin, M. Dragicevic, J. Er ¨o, M. Flechl, M. Friedl, R. Fr ¨uhwirth1, V.M. Ghete, C. Hartl, N. H ¨ormann, J. Hrubec, M. Jeitler1, A. K ¨onig, I. Kr¨atschmer, D. Liko, T. Matsushita, I. Mikulec, D. Rabady, N. Rad, B. Rahbaran, H. Rohringer, J. Schieck1, J. Strauss, W. Treberer-Treberspurg, W. Waltenberger, C.-E. Wulz1
National Centre for Particle and High Energy Physics, Minsk, Belarus
V. Mossolov, N. Shumeiko, J. Suarez Gonzalez
Universiteit Antwerpen, Antwerpen, Belgium
S. Alderweireldt, E.A. De Wolf, X. Janssen, J. Lauwers, M. Van De Klundert, H. Van Haevermaet, P. Van Mechelen, N. Van Remortel, A. Van Spilbeeck
Vrije Universiteit Brussel, Brussel, Belgium
S. Abu Zeid, F. Blekman, J. D’Hondt, N. Daci, I. De Bruyn, K. Deroover, N. Heracleous, S. Lowette, S. Moortgat, L. Moreels, A. Olbrechts, Q. Python, S. Tavernier, W. Van Doninck, P. Van Mulders, I. Van Parijs
Universit´e Libre de Bruxelles, Bruxelles, Belgium
H. Brun, C. Caillol, B. Clerbaux, G. De Lentdecker, H. Delannoy, G. Fasanella, L. Favart, R. Goldouzian, A. Grebenyuk, G. Karapostoli, T. Lenzi, A. L´eonard, J. Luetic, T. Maerschalk, A. Marinov, A. Randle-conde, T. Seva, C. Vander Velde, P. Vanlaer, R. Yonamine, F. Zenoni, F. Zhang2
Ghent University, Ghent, Belgium
A. Cimmino, T. Cornelis, D. Dobur, A. Fagot, G. Garcia, M. Gul, D. Poyraz, S. Salva, R. Sch ¨ofbeck, M. Tytgat, W. Van Driessche, E. Yazgan, N. Zaganidis
Universit´e Catholique de Louvain, Louvain-la-Neuve, Belgium
H. Bakhshiansohi, C. Beluffi3, O. Bondu, S. Brochet, G. Bruno, A. Caudron, L. Ceard, S. De Visscher, C. Delaere, M. Delcourt, L. Forthomme, B. Francois, A. Giammanco, A. Jafari, P. Jez, M. Komm, V. Lemaitre, A. Magitteri, A. Mertens, M. Musich, C. Nuttens, K. Piotrzkowski, L. Quertenmont, M. Selvaggi, M. Vidal Marono, S. Wertz
Universit´e de Mons, Mons, Belgium
N. Beliy
Centro Brasileiro de Pesquisas Fisicas, Rio de Janeiro, Brazil
W.L. Ald´a J ´unior, F.L. Alves, G.A. Alves, L. Brito, C. Hensel, A. Moraes, M.E. Pol, P. Rebello Teles
Universidade do Estado do Rio de Janeiro, Rio de Janeiro, Brazil
E. Belchior Batista Das Chagas, W. Carvalho, J. Chinellato4, A. Cust ´odio, E.M. Da Costa,
G.G. Da Silveira, D. De Jesus Damiao, C. De Oliveira Martins, S. Fonseca De Souza, L.M. Huertas Guativa, H. Malbouisson, D. Matos Figueiredo, C. Mora Herrera, L. Mundim, H. Nogima, W.L. Prado Da Silva, A. Santoro, A. Sznajder, E.J. Tonelli Manganote4, A. Vilela Pereira
Universidade Estadual Paulistaa, Universidade Federal do ABCb, S˜ao Paulo, Brazil
P.G. Mercadanteb, C.S. Moona, S.F. Novaesa, Sandra S. Padulaa, D. Romero Abadb, J.C. Ruiz Vargas
Institute for Nuclear Research and Nuclear Energy, Sofia, Bulgaria
A. Aleksandrov, R. Hadjiiska, P. Iaydjiev, M. Rodozov, S. Stoykova, G. Sultanov, M. Vutova
University of Sofia, Sofia, Bulgaria
A. Dimitrov, I. Glushkov, L. Litov, B. Pavlov, P. Petkov
Beihang University, Beijing, China
W. Fang5
Institute of High Energy Physics, Beijing, China
M. Ahmad, J.G. Bian, G.M. Chen, H.S. Chen, M. Chen, Y. Chen6, T. Cheng, C.H. Jiang, D. Leggat, Z. Liu, F. Romeo, S.M. Shaheen, A. Spiezia, J. Tao, C. Wang, Z. Wang, H. Zhang, J. Zhao
State Key Laboratory of Nuclear Physics and Technology, Peking University, Beijing, China
Y. Ban, Q. Li, S. Liu, Y. Mao, S.J. Qian, D. Wang, Z. Xu
Universidad de Los Andes, Bogota, Colombia
C. Avila, A. Cabrera, L.F. Chaparro Sierra, C. Florez, J.P. Gomez, C.F. Gonz´alez Hern´andez, J.D. Ruiz Alvarez, J.C. Sanabria
University of Split, Faculty of Electrical Engineering, Mechanical Engineering and Naval Architecture, Split, Croatia
N. Godinovic, D. Lelas, I. Puljak, P.M. Ribeiro Cipriano
University of Split, Faculty of Science, Split, Croatia
Z. Antunovic, M. Kovac
Institute Rudjer Boskovic, Zagreb, Croatia
V. Brigljevic, D. Ferencek, K. Kadija, S. Micanovic, L. Sudic
University of Cyprus, Nicosia, Cyprus
A. Attikis, G. Mavromanolakis, J. Mousa, C. Nicolaou, F. Ptochos, P.A. Razis, H. Rykaczewski
Charles University, Prague, Czech Republic
M. Finger7, M. Finger Jr.7
Universidad San Francisco de Quito, Quito, Ecuador
E. Carrera Jarrin
Academy of Scientific Research and Technology of the Arab Republic of Egypt, Egyptian Network of High Energy Physics, Cairo, Egypt
Y. Assran8,9, T. Elkafrawy10, A. Ellithi Kamel11, A. Mahrous12
National Institute of Chemical Physics and Biophysics, Tallinn, Estonia
B. Calpas, M. Kadastik, M. Murumaa, L. Perrini, M. Raidal, A. Tiko, C. Veelken
Department of Physics, University of Helsinki, Helsinki, Finland
P. Eerola, J. Pekkanen, M. Voutilainen
Helsinki Institute of Physics, Helsinki, Finland
J. H¨ark ¨onen, V. Karim¨aki, R. Kinnunen, T. Lamp´en, K. Lassila-Perini, S. Lehti, T. Lind´en, P. Luukka, T. Peltola, J. Tuominiemi, E. Tuovinen, L. Wendland
21
Lappeenranta University of Technology, Lappeenranta, Finland
J. Talvitie, T. Tuuva
DSM/IRFU, CEA/Saclay, Gif-sur-Yvette, France
M. Besancon, F. Couderc, M. Dejardin, D. Denegri, B. Fabbro, J.L. Faure, C. Favaro, F. Ferri, S. Ganjour, S. Ghosh, A. Givernaud, P. Gras, G. Hamel de Monchenault, P. Jarry, I. Kucher, E. Locci, M. Machet, J. Malcles, J. Rander, A. Rosowsky, M. Titov, A. Zghiche
Laboratoire Leprince-Ringuet, Ecole Polytechnique, IN2P3-CNRS, Palaiseau, France
A. Abdulsalam, I. Antropov, S. Baffioni, F. Beaudette, P. Busson, L. Cadamuro, E. Chapon, C. Charlot, O. Davignon, R. Granier de Cassagnac, M. Jo, S. Lisniak, P. Min´e, I.N. Naranjo, M. Nguyen, C. Ochando, G. Ortona, P. Paganini, P. Pigard, S. Regnard, R. Salerno, Y. Sirois, T. Strebler, Y. Yilmaz, A. Zabi
Institut Pluridisciplinaire Hubert Curien, Universit´e de Strasbourg, Universit´e de Haute Alsace Mulhouse, CNRS/IN2P3, Strasbourg, France
J.-L. Agram13, J. Andrea, A. Aubin, D. Bloch, J.-M. Brom, M. Buttignol, E.C. Chabert, N. Chanon, C. Collard, E. Conte13, X. Coubez, J.-C. Fontaine13, D. Gel´e, U. Goerlach, A.-C. Le Bihan, J.A. Merlin14, K. Skovpen, P. Van Hove
Centre de Calcul de l’Institut National de Physique Nucleaire et de Physique des Particules, CNRS/IN2P3, Villeurbanne, France
S. Gadrat
Universit´e de Lyon, Universit´e Claude Bernard Lyon 1, CNRS-IN2P3, Institut de Physique Nucl´eaire de Lyon, Villeurbanne, France
S. Beauceron, C. Bernet, G. Boudoul, E. Bouvier, C.A. Carrillo Montoya, R. Chierici, D. Contardo, B. Courbon, P. Depasse, H. El Mamouni, J. Fan, J. Fay, S. Gascon, M. Gouzevitch, G. Grenier, B. Ille, F. Lagarde, I.B. Laktineh, M. Lethuillier, L. Mirabito, A.L. Pequegnot, S. Perries, A. Popov15, D. Sabes, V. Sordini, M. Vander Donckt, P. Verdier, S. Viret
Georgian Technical University, Tbilisi, Georgia
T. Toriashvili16
Tbilisi State University, Tbilisi, Georgia
Z. Tsamalaidze7
RWTH Aachen University, I. Physikalisches Institut, Aachen, Germany
C. Autermann, S. Beranek, L. Feld, A. Heister, M.K. Kiesel, K. Klein, M. Lipinski, A. Ostapchuk, M. Preuten, F. Raupach, S. Schael, C. Schomakers, J.F. Schulte, J. Schulz, T. Verlage, H. Weber, V. Zhukov15
RWTH Aachen University, III. Physikalisches Institut A, Aachen, Germany
M. Brodski, E. Dietz-Laursonn, D. Duchardt, M. Endres, M. Erdmann, S. Erdweg, T. Esch, R. Fischer, A. G ¨uth, T. Hebbeker, C. Heidemann, K. Hoepfner, S. Knutzen, M. Merschmeyer, A. Meyer, P. Millet, S. Mukherjee, M. Olschewski, K. Padeken, P. Papacz, T. Pook, M. Radziej, H. Reithler, M. Rieger, F. Scheuch, L. Sonnenschein, D. Teyssier, S. Th ¨uer
RWTH Aachen University, III. Physikalisches Institut B, Aachen, Germany
V. Cherepanov, Y. Erdogan, G. Fl ¨ugge, W. Haj Ahmad, F. Hoehle, B. Kargoll, T. Kress, A. K ¨unsken, J. Lingemann, A. Nehrkorn, A. Nowack, I.M. Nugent, C. Pistone, O. Pooth, A. Stahl14
Deutsches Elektronen-Synchrotron, Hamburg, Germany
A.A. Bin Anuar, K. Borras17, A. Campbell, P. Connor, C. Contreras-Campana, F. Costanza, C. Diez Pardos, G. Dolinska, G. Eckerlin, D. Eckstein, E. Gallo18, J. Garay Garcia, A. Geiser, A. Gizhko, J.M. Grados Luyando, P. Gunnellini, A. Harb, J. Hauk, M. Hempel19, H. Jung, A. Kalogeropoulos, O. Karacheban19, M. Kasemann, J. Keaveney, J. Kieseler, C. Kleinwort,
I. Korol, W. Lange, A. Lelek, J. Leonard, K. Lipka, A. Lobanov, W. Lohmann19, R. Mankel, I.-A. Melzer-Pellmann, A.B. Meyer, G. Mittag, J. Mnich, A. Mussgiller, E. Ntomari, D. Pitzl, R. Placakyte, A. Raspereza, B. Roland, M. ¨O. Sahin, P. Saxena, T. Schoerner-Sadenius, C. Seitz, S. Spannagel, N. Stefaniuk, K.D. Trippkewitz, G.P. Van Onsem, R. Walsh, C. Wissing
University of Hamburg, Hamburg, Germany
V. Blobel, M. Centis Vignali, A.R. Draeger, T. Dreyer, E. Garutti, K. Goebel, D. Gonzalez, J. Haller, M. Hoffmann, A. Junkes, R. Klanner, R. Kogler, N. Kovalchuk, T. Lapsien, T. Lenz, I. Marchesini, D. Marconi, M. Meyer, M. Niedziela, D. Nowatschin, J. Ott, F. Pantaleo14, T. Peiffer, A. Perieanu, J. Poehlsen, C. Sander, C. Scharf, P. Schleper, A. Schmidt, S. Schumann, J. Schwandt, H. Stadie, G. Steinbr ¨uck, F.M. Stober, M. St ¨over, H. Tholen, D. Troendle, E. Usai, L. Vanelderen, A. Vanhoefer, B. Vormwald
Institut f ¨ur Experimentelle Kernphysik, Karlsruhe, Germany
C. Barth, C. Baus, J. Berger, E. Butz, T. Chwalek, F. Colombo, W. De Boer, A. Dierlamm, S. Fink, R. Friese, M. Giffels, A. Gilbert, D. Haitz, F. Hartmann14, S.M. Heindl, U. Husemann,
I. Katkov15, P. Lobelle Pardo, B. Maier, H. Mildner, M.U. Mozer, T. M ¨uller, Th. M ¨uller, M. Plagge, G. Quast, K. Rabbertz, S. R ¨ocker, F. Roscher, M. Schr ¨oder, G. Sieber, H.J. Simonis, R. Ulrich, J. Wagner-Kuhr, S. Wayand, M. Weber, T. Weiler, S. Williamson, C. W ¨ohrmann, R. Wolf
Institute of Nuclear and Particle Physics (INPP), NCSR Demokritos, Aghia Paraskevi, Greece
G. Anagnostou, G. Daskalakis, T. Geralis, V.A. Giakoumopoulou, A. Kyriakis, D. Loukas, I. Topsis-Giotis
National and Kapodistrian University of Athens, Athens, Greece
A. Agapitos, S. Kesisoglou, A. Panagiotou, N. Saoulidou, E. Tziaferi
University of Io´annina, Io´annina, Greece
I. Evangelou, G. Flouris, C. Foudas, P. Kokkas, N. Loukas, N. Manthos, I. Papadopoulos, E. Paradas
MTA-ELTE Lend ¨ulet CMS Particle and Nuclear Physics Group, E ¨otv ¨os Lor´and University
N. Filipovic
Wigner Research Centre for Physics, Budapest, Hungary
G. Bencze, C. Hajdu, P. Hidas, D. Horvath20, F. Sikler, V. Veszpremi, G. Vesztergombi21, A.J. Zsigmond
Institute of Nuclear Research ATOMKI, Debrecen, Hungary
N. Beni, S. Czellar, J. Karancsi22, A. Makovec, J. Molnar, Z. Szillasi
University of Debrecen, Debrecen, Hungary
M. Bart ´ok21, P. Raics, Z.L. Trocsanyi, B. Ujvari
National Institute of Science Education and Research, Bhubaneswar, India
23
Panjab University, Chandigarh, India
S. Bansal, S.B. Beri, V. Bhatnagar, R. Chawla, U.Bhawandeep, A.K. Kalsi, A. Kaur, M. Kaur, R. Kumar, A. Mehta, M. Mittal, J.B. Singh, G. Walia
University of Delhi, Delhi, India
Ashok Kumar, A. Bhardwaj, B.C. Choudhary, R.B. Garg, S. Keshri, A. Kumar, S. Malhotra, M. Naimuddin, N. Nishu, K. Ranjan, R. Sharma, V. Sharma
Saha Institute of Nuclear Physics, Kolkata, India
R. Bhattacharya, S. Bhattacharya, K. Chatterjee, S. Dey, S. Dutt, S. Dutta, S. Ghosh, N. Majumdar, A. Modak, K. Mondal, S. Mukhopadhyay, S. Nandan, A. Purohit, A. Roy, D. Roy, S. Roy Chowdhury, S. Sarkar, M. Sharan, S. Thakur
Indian Institute of Technology Madras, Madras, India
P.K. Behera
Bhabha Atomic Research Centre, Mumbai, India
R. Chudasama, D. Dutta, V. Jha, V. Kumar, A.K. Mohanty14, P.K. Netrakanti, L.M. Pant, P. Shukla, A. Topkar
Tata Institute of Fundamental Research-A, Mumbai, India
T. Aziz, S. Dugad, G. Kole, B. Mahakud, S. Mitra, G.B. Mohanty, N. Sur, B. Sutar
Tata Institute of Fundamental Research-B, Mumbai, India
S. Banerjee, S. Bhowmik25, R.K. Dewanjee, S. Ganguly, M. Guchait, Sa. Jain, S. Kumar, M. Maity25, G. Majumder, K. Mazumdar, B. Parida, T. Sarkar25, N. Wickramage26
Indian Institute of Science Education and Research (IISER), Pune, India
S. Chauhan, S. Dube, A. Kapoor, K. Kothekar, A. Rane, S. Sharma
Institute for Research in Fundamental Sciences (IPM), Tehran, Iran
H. Behnamian, S. Chenarani27, E. Eskandari Tadavani, S.M. Etesami27, A. Fahim28, M. Khakzad, M. Mohammadi Najafabadi, M. Naseri, S. Paktinat Mehdiabadi, F. Rezaei Hosseinabadi, B. Safarzadeh29, M. Zeinali
University College Dublin, Dublin, Ireland
M. Felcini, M. Grunewald
INFN Sezione di Baria, Universit`a di Barib, Politecnico di Baric, Bari, Italy
M. Abbresciaa,b, C. Calabriaa,b, C. Caputoa,b, A. Colaleoa, D. Creanzaa,c, L. Cristellaa,b, N. De Filippisa,c, M. De Palmaa,b, L. Fiorea, G. Iasellia,c, G. Maggia,c, M. Maggia, G. Minielloa,b, S. Mya,b, S. Nuzzoa,b, A. Pompilia,b, G. Pugliesea,c, R. Radognaa,b, A. Ranieria, G. Selvaggia,b,
L. Silvestrisa,14, R. Vendittia,b, P. Verwilligena
INFN Sezione di Bolognaa, Universit`a di Bolognab, Bologna, Italy
G. Abbiendia, C. Battilana, D. Bonacorsia,b, S. Braibant-Giacomellia,b, L. Brigliadoria,b, R. Campaninia,b, P. Capiluppia,b, A. Castroa,b, F.R. Cavalloa, S.S. Chhibraa,b, G. Codispotia,b, M. Cuffiania,b, G.M. Dallavallea, F. Fabbria, A. Fanfania,b, D. Fasanellaa,b, P. Giacomellia, C. Grandia, L. Guiduccia,b, S. Marcellinia, G. Masettia, A. Montanaria, F.L. Navarriaa,b, A. Perrottaa, A.M. Rossia,b, T. Rovellia,b, G.P. Sirolia,b, N. Tosia,b,14
INFN Sezione di Cataniaa, Universit`a di Cataniab, Catania, Italy
S. Albergoa,b, M. Chiorbolia,b, S. Costaa,b, A. Di Mattiaa, F. Giordanoa,b, R. Potenzaa,b, A. Tricomia,b, C. Tuvea,b