Introduction
Stand growth and yield are strongly influenced by site quality and stand density (Loetsch et al., 1973; Husch
et al., 1982; Avery and Burkhart, 1983; Clutter et al.,
1983; Philip, 1994). The potential of a land area to pro-duce wood is determined by its site quality. Stand den-sity can describe not only the degree to which a site is being used but also the intensity of tree competition. This parameter is the major factor that can be manipu-lated in order to influence stem quality, diameter growth,
Simulation of silvicultural scenarios and economic efficiency
for maritime pine (Pinus pinaster Aiton) wood-oriented
management in centre inland of Portugal
C. Alegria*
Instituto Politécnico de Castelo Branco. Escola Supeerior Agrária. Unidade Departamental de Recursos Naturais e Desenvolvimento Sustentável. Quinta da Senhora de Mércules. 6001-909 Castelo Branco. Portugal
Abstract
Seven silvicultural scenarios for pure and even aged maritime pine stands were simulated using a diameter class growth and yield model, for three levels of site index (low, medium and high). Total and merchantable yield along rotation and mean annual increment at rotation age were simulated. Revenue obtained from sale of standing timber (three commercial thinning and final harvest) was estimated. Costs paid for stand establishment (site preparation and plantation) and treatments (release, pre-commercial thinning and pruning) were also estimated. For each scenario, a cash-flow was simulated and economic efficiency was assessed using the net present value of an infinitive series of rotations (NPVIS) and the internal rate of return (IRR). The economic analysis results proved the selection of an intensive management stand prescription that is used as a guide for reforestation projects, using artificial regeneration by plantation, when the main goal is round wood yield. For areas of natural regeneration, a fully stocked stand prescription, pulp wood yield oriented, was selected. This prescription enables saving in site preparation and plantation costs, being at the moment the most suitable for the existing naturally regenerated maritime pine stands of Portuguese private forest areas.
Additional key words: stand prescription; growth and yield simulation; density indices; net present value; inter-nal rate of return.
Resumen
Simulación de escenarios silvícolas y de la eficiencia económica para el pino marítimo (Pinus pinaster Aiton) de la gestión orientada a la producción de madera en el centro interior de Portugal
Se han simulado siete escenarios selvícolas de rodales puros y regulares de pino pinaster utilizando un modelo de cre-cimiento con crecre-cimientos por clase diamétrica, para tres niveles de índice de sitio (bajo, medio y alto). Se simularon el rendimiento total y comercial a lo largo de la rotación y el incremento anual promedio a la edad de rotación. Se estima-ron los ingresos obtenidos por la venta de madera en pie (tres claras comerciales y corta final). También se estimaestima-ron los gastos pagados para el establecimiento del rodal (preparación del terreno y plantación) y tratamientos (liberación, entre-saca pre-comercial y podas). Para cada escenario, se simuló un flujo de caja y se evaluaron la eficiencia económica utili-zando el valor presente neto de una serie infinita de rotaciones (NPVIS) y la tasa interna de retorno (TIR). Los resultados del análisis económico sugieren la selección de una gestión intensiva que se usa como guía para proyectos de reforesta-cion, utilizando regeneración artificial mediante plantación, cuando el objetivo principal es la producción de madera en rollo. Para las áreas de regeneración natural, se seleccionó una alternativa de rodal denso, con orientación a la producción de pasta. Esta opción permite ahorrar en la preparación del sitio y los costos de plantación, siendo hasta el momento el más adecuado para lo rodales con regeneración natural existentes en bosques privados Portugueses de pino pinaster.
Palabras clave: prescripcion del rodal; simulation de crecimiento y rendimiento; índices de densidad; valor neto actual; tasa interna de retorno.
* Corresponding author: crisalegria@ipcb.pt Received: 18-05-11. Accepted: 09-09-11.
stand volume growth and even future regeneration (Davis and Johnson, 1987). To define an appropriate thinning schedule (interval and intensity) several commonly density and stocking measures can be used, such as the number of trees per hectare (N); basal area per hectare (G); Wilson’s factor (Fw); stand density index (SDI) and crown competition factor (CCF) (Reineke, 1933; Wilson, 1946; Krajicek et al., 1961; Clutter
et al., 1983; Davis and Johnson, 1987). The
relation-ship between stand density and yield is well known. As stand density increases a higher stand yield is obser-ved. However, there is a negative correlation between stand density and average stand diameter. Therefore, stands with high densities are composed of many trees of small diameter. Unlike wide stand spacing which promotes individual tree diameter growth to a certain limit. This means that two completely different situa-tions of stand density and composition of tree diameter may result in similar stocking level but leading to very distinct types of merchantable yield (Clutter et al., 1983; Davis and Johnson, 1987).
Davis and Johnson (1987) argued that predicting future growth and yield of managed and unmanaged stands is absolutely essential to credible forest mana-gement planning. In order to support the development of prescriptions for forest stands, the use of growth and yield models are needed to predict how much timber for commercial harvest can be obtained so the proce-dures to achieve a fully regulated forest can be imple-mented (Davis and Johnson, 1987). A variety of models are now available to make empirical yield predictions, such as whole stand models, size class models, and the more sophisticated single-tree and tree list models. Nevertheless, to make reliable growth and yield predic-tions it is necessary to check that models are appropria-te for a particular management situation (acceptable accuracy; valid for the species and geographical area; and adapted to the available data) (Clutter et al., 1983; Davis and Johnson, 1987; Vanclay, 1994).
Previous studies used simulation models to predict stand development and compare volume increment or economic efficiency (e.g. Hasse and Ek, 1981; Guldin and Baker, 1988; Haight and Monserud, 1990; Hanewinkel, 2002; Bussoni and Cabris, 2010). Skovsgaard and Vanclay (2008) mentioned that there is the notion that production eff iciency is greatest at lowest stocking densities that achieves full use of the site potential for timber production. However, others factors such as, timber quality, price assumptions, harvesting costs, risk of wind throw and regeneration options, also need
to be considered at the time during the rotation when determining desired stocking density.
In Spain, several studies were developed to support specie management in order to analyse differences in growth and yield generated by alternative silvicultural scenarios and selecting the best one using the economic criteria of the net present value of an infinitive series of rotations (NPVIS) and the internal rate of return (IRR) (Rodrígues-Soalheiro et al., 2000; Rodríguez et
al., 2002; Rojo et al., 2005). Rodrígues-Soalheiro et al. (2000) compared three silvicultural alternatives for
pure even aged stands of maritime pine in Galicia and proved that the most intensive prescription was the most desirable one for profit maximization. Rodríguez
et al. (2002) evaluated several standard treatment options
for Monterey pine (Pinus radiata D. Don.) plantations in Galicia and proved that a proposed variant for the Forest Service regime, which includes high pruning, gives the best economic results management regime for communal forests. It is characterized by lower stand densities and an extended rotation, providing high quality products and having possibly additional ad-vantages regarding biodiversity and other non-tangible benefits. For private forests, a proposed variant to the usual high-density regime encountered resulted in much better wood quality, greater stand stability and higher economic returns. Rojo et al. (2005) modelled two silvicultural and economic alternatives for Scots pine (Pinus sylvestris L.) plantations in Galicia and proved that the currently applied alternative was not the best one if the main aim is profit maximization. For very poor quality sites the proposed schedules were found to be uneconomical for all silvicultural alternatives.
On the other hand, a study on the effect of stand prescriptions on wood density was developed for pure even aged Picea abies (L.) Karst stands in South-eastern Finland proving that increasing thinning intensity resulted in lower mean wood density, tracheid length and latest wood proportion in harvest wood. It also proved that thinning regimes with high early growing stock and decreasing later growing stocking were the most profitable (Cao et al., 2008).
In Portugal, forests occupy 38% of the country (3.4× 10⁶ha) and belong mostly to non industrial owners
(73.4%) (DGRF, 2006). In 2000, only 33% of the Por-tuguese forest area had a forest management plan (Baptista and Santos, 2005). The Portuguese Forest Policy Law approved in 1996 (DR, 1996) had defined several ma-nagement tools to overcome this situation. During 1999 to 2006 all the Regional Forest Management Plans had
been approved, def ining the strategic guidelines for every region of Portugal (DR, 2009, 2011). In addition, the Forest Intervention Zones were def ined and had started to be proposed in order to overcame the pro-perty small size constrain for forest management (DR, 2009). Actually, Forest Management Plans for both public forestland and for private forestland are required and are being proposed (DR, 2009; AFN, 2009). In 2006, Forests national strategy had considered as one of the main goals to be achieved, in what concerns to improving forest productivity through forest sustaina-ble management, to have forest management plans for all public forest areas in 2008, all community forest areas in 2013 and 600 hundred hectares of private forest area (including Forest Intervention Zones) in 2016 (DR, 2006).
Maritime pine (Pinus pinaster Aiton) stands occupy 23% of Portuguese forest and more a half of them (58%) are located in the central region of the country where property average size is less than five hectares (Baptista and Santos, 2005; DGRF, 2006; DR, 2006). A large proportion of this maritime pine forest is re-generated naturally, over stocked, with a high f ire risk (vertical and horizontal continuity of fuel) mostly due to the absence of technical management (DR, 2006).
This species usually grow in pure stands in structures ranging from even-aged to multi-aged stands, where disturbance regimes are dominated by fire and stand reestablishment only occurs if there is some seed pro-duction. A study in the central inland region of Portugal (Pinhal Interior Sul-PIS) (Martins, 2007) emphasizes this situation where recent burned areas of mature ma-ritime pine stands showed excellent levels of regene-ration after five years (a range of 300 to 50,000 trees per hectare with an average of 19,190 trees per hectare was observed). In situations of reforestation, artificial or natural regeneration, when high stand density is ob-served, Oliveira (1999) proposes several non-commer-cial thinning until stand density reaches between 1,000 to 1,500 trees per hectare.
To support Portuguese public and/or private mari-time pine stands, several yield tables, had been develo-ped since the thirties of the last century. More recently, growth and yield models started to be developed. For instances, Hall and Martins (1986, 1993) for the spe-cies in central coastal region of Portugal; Oliveira (1985) for the montana and sub-montana regions of Portugal. Páscoa (1987) developed a diameter class growth and yield model (PBLEIRIA) for the national maritime
pine stands of Leiria region. This model was later ad-justed to maritime pine stands in Portugal, using the data from the National Forest Inventory of 1985/87 and renamed as PBRAVO model (Páscoa, 1990).
To support reforestation projects several stand prescriptions are also available to support species ma-nagement (Alves, 1975; Oliveira, 1985; Oliveira, 1999; Louro et al., 2002). However, there is no evidence to support which the best silviculture alternative to achieve a certain merchantability yield goal and its economic efficiency is.
Being the maritime pine wood of strategic importan-ce for Portugal and where some effort is now being made to develop Forest Management Plans for the pri-vate areas located in the central region of the country, it is crucial to know the economic eff iciency of the wood-oriented stand management prescriptions available for this species to help private owners to engage in forest management.
Therefore, the working hypothesis of this study was to test if stand management using prescriptions that lead to an under stocked stand situation were the most suitable in terms of merchantable yield and economic eff iciency. Seven silvicultural alternative scenarios, for three levels of site index (low, medium and high), were considered to test the working hypothesis. To simulate stand development the model PBRAVO from Páscoa (1990) was used. Stand projection tables of fu-ture yield were obtained and total and merchantable yield along rotation and the mean annual increment (MAI) were assessed.
Revenue obtained from standing timber sale (three commercial thinning and final harvest) and the costs of stand establishment (site preparation and plantation) and treatments (release, pre-commercial thinning and pruning) were estimated to produce a cash-flow for each scenario. Finally, scenarios economic efficiency was assessed using both the NPVIS and the IRR economic criteria. A sensitivity analysis was carried out, in terms of prices and discount rates.
Material and methods
Stocking measures used to define thinning
grade
Stand stocking was assessed using the following indices: crown competition factor (CCF), stand density index (SDI) and Wilson’s factor (Fw).
The crown competition factor, for the species in the centre inland region of Portugal (Alegria, 1994), was assessed as:
[1] where:
A = sample plot area (m2).
di = individual tree diameter, over bark, at breast height (1.30 m above ground) (cm).
A CCF value of 100% indicates that the minimum density below which site is under stocked and values higher than 100% indicates that competition between stand trees increases (Husch et al., 1982; Clutter et al., 1983).
The stand density index used was f itted for the maritime pine stands in Portugal, using the data from the National Forest Inventory of 1985/87 (Luís et al., 1991) and defined as:
[2] where:
N = number of trees per hectare.
dg = quadratic mean diameter at breast height (dbh)
(cm).
The need of thinning was assessed using the following stocking classes:
— Over stocked (c(SDI) > 1) – thinning needed; — Fully stocked (c(SDI)∈ ] 0.58, 1]) – thinning needed;
— Under stocked (c(SDI)∈ ] 0.26, 0.58]) – may require future thinning;
— Very under stocked (c(SDI)≤ 0.26) – no need for intervention.
These two indices above referred are positively linear correlated to one another.
The Wilson’s factor for stand irregular spacing (Oliveira, 1984) used was defined as:
[3] where:
hdom = average dominant height, e.g. the 100 trees of
the largest dbh per hectare (m).
Wilson’s factors of 0.11, 0.16, 0.20, 0.23 and 0.28 correspond accordingly, to a thinning grade A (natural mortality), C (light thinning), C/D, D and E (heavy thinning) (Alves, 1975; Oliveira, 1984). Alves (1975) recommend, for the Portuguese maritime pine stands
when previous silvicultural treatments are unknown, the use of a C/D thinning grade when reaching to a stand dominant height of 10 m (Oliveira, 1984).
Stand prescription scenarios
Seven wood production oriented silvicultural alter-native scenarios were considered in this study and are described as follow:
1. Scenario one (S1) was based on the stand pres-cription by Louro et al. (2002). An initial stand density of 1,100 trees per hectare by artif icial regeneration (plantation), two bush control actions for release at three and eight years, two pruning actions at 10 and 15 years (to a height of three to four m in selected trees of dbh between 10 to 15 cm that will reach to f inal harvest), three commercial thinning from bellow at 15, 20 and 35 years (removing around 25% of the stand number of trees per hectare) and the final harvest at 45 years were considered.
2. Scenario two (S2) was based on the stand prescription by Oliveira (1999) that proposes the use of Wilson’s factor thinning grade D (0.23) for maritime pine stands in the north and centre of Portugal and the use of Wilson’s factor thinning grade between D and E (0.25 to 0.28) for maritime pine stands in the south of the Tejo river and in sites of low quality in the centre of country. An initial stand density of 3,000 trees per hectare by natural regeneration, two systematic pre-commercial thinning at f ive and 10 years, three commercial thinning from bellow at 15-20, 20-25 and 35-40 years (Fw from 0.25 to 0.28) and the final harvest at 45-50 years depending on site index were considered. 3. Scenario three (S3) was based on a stand pres-cription by Alves (1975) who suggests, that when there is no information of previous management treatment, the application of Wilson’s factor thinning grade C/D (0.20), from the moment a stand dominant height reaches 10 m (Oliveira, 1984). An initial stand density of 5,000 trees per hectare by natural regeneration, two systematic pre-commercial thinning at five and 10 years, three commercial thinning from bellow at 15-20, 20-25 and 35-40 years (Fw around 0.20) and the f inal harvest at 45-50 years depending on site index were considered.
4. Scenario four (S4) considered an initial stand density of 5,000 trees per hectare by natural regenera-tion, two systematic pre-commercial thinning at five and 10 years, three commercial thinning from below
Fw= 100 hdom 0.933N c(SDI )= N e12.544−1.815ln(dg ) CCF=25π A
(
0.335229+ 0.171785di)
2 i=1 n∑
at 15-20, 20-25 and 35-40 years (CCF around 100%) and the final harvest at 45-50 years depending on site index.
5. Scenario five (S5) considered an initial stand density of 1,100 trees per hectare by artif icial rege-neration (plantation), two bush control actions for re-lease at three and eight years, two pruning actions at 10 and 15 years (to a height of three to four m in selec-ted trees of dbh between 10 to 15 cm that will reach to final harvest), three commercial thinning from bellow at 15-20, 20-25 and 35-40 years (c(SDI) around 0.58) and the final harvest at 45-50 years depending on site index.
6. Scenario six (S6) considered an initial stand density of 1,100 trees per hectare by artificial regene-ration (plantation), two bush control actions for release at three and eight years, two pruning actions at 10 and 15 years (to a height of three to four m in selected trees of dbh between 10 to 15 cm that will reach to f inal harvest), three commercial thinning from bellow at 15-20, 20-25 and 35-40 years (c(SDI) around 0.26) and the final harvest at 45-50 years depending on site index. 7. Scenario seven (S7) was based on a stand pres-cription by Oliveira (1985) yield tables for maritime pine stands in the montana and sub-montana regions in Portugal using a Wilson’s factor thinning grade of 0.27. An initial stand density between 1,122 to 2,290 trees per hectare by artificial regeneration (plantation), two bush control actions for release at three and eight years, two pruning actions at 10 and 15 years (to a height of three to four m in selected trees of dbh bet-ween 10 to 15 cm that will reach to final harvest), three commercial thinning from bellow at 15-20, 20-25 and 35-40 years (Fw around 0.27) and the final harvest at 45-50 years depending on site index were considered.
Stand total and merchantable yield simulation
The PBRAVO model was used to simulate stand development of the seven scenarios for three levels of site index (low, medium and high). This model is a size class growth and yield model that uses the Weibull distribution to project the number of trees per hectare by dbh class and produces a stand table projection of future yield (m3 ha–1) (Páscoa, 1987; Páscoa, 1990).
The Weibull distribution function used is defined as: [4]
where, a, b and c are the parameters to be estimated as a function of the stand variables. Parameters b and c are solved by the equation system
[5]
[6]
where:
xp = distribution p percentile (0 < p < 1). Γ(x) = gama function.
E(X2) = distribution second moment.
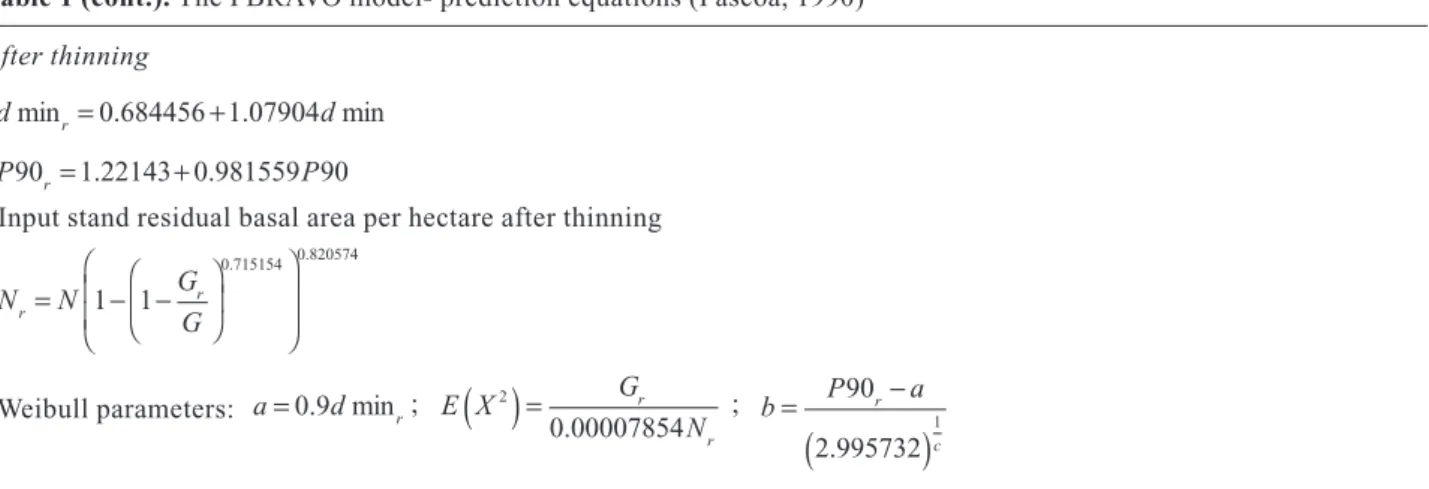
The parameter c can be estimated through an itera-tive approach using equation [3]. Then having the esti-mates of parameters a and c, parameter b can be obtai-ned using equation [2] (Páscoa, 1987; Páscoa, 1990). The PBRAVO model is composed by a suit of equa-tions that make possible to simulate stand projecequa-tions tables for the following situations: stands previously unthhinned, stands previously thinned and stands after thinning operation. A set of growth equations are as well included to project variables in the future (Ta-ble 1) (Páscoa, 1990).
The PBRAVO model has as input parameters: the average dominant height (hdom), the age (t) and the number of trees per hectare distribution by dbh class (Fig. 1), being the diameter classes organized in a range of 5 cm, with the initial class as [2.5, 7.5[ (Páscoa, 1990). The site index is defined as the stand dominant height at the reference age of 50 years (SI50) (Páscoa, 1990).
The three levels of site index considered in scenarios simulation were: low – SI50= 15, medium – SI50= 18 and
high – SI50= 21. To define the above three levels of site
index the stand total volume mean annual increment (MAI) at the age of 45 years was used.
Output parameters of the stand table projection are: the number of trees per hectare (N), the basal area per hectare (G), the quadratic mean diameter at breast height (dg), the average height (h¯) and the total and merchantable yield by class of timber for industrial use (Páscoa, 1990). + x
(
p− a)
2 Γ 1+ 2 c ⎛ ⎝ ⎜ ⎞ ⎠ ⎟ − ln 1− p( )
2c − E X2( )
= 0 a2+ 2a x(
p− a)
Γ 1+1 c ⎛ ⎝ ⎜ ⎞ ⎠ ⎟ − ln 1− p( )
1c + b= xp− a − ln 1− p( )
⎡⎣ ⎤⎦1c F x( )
= 1− e −x−a b ⎛ ⎝ ⎜ ⎞ ⎠ ⎟ cTable 1. The PBRAVO model- prediction equations (Páscoa, 1990) Unthinned stands Weibull parameters: Thinned stands Weibull parameters: Growth projection
Weibull parameters: a= 0.9d mint 2; E X
( )
2 = Gt 20.00007854Nt 2 ; b= P90t 2− a 2.995732
(
)
1 c Nt 2= Nt1 ⎝ ⎠ Gt 2= Gt1 t1 t 2e 1−t1 t 2 ⎛ ⎝ ⎜ ⎞ ⎠ ⎟ 4.178774+0.039053hdom( ) f t1, t1, hdom(
)
= −0.009172 t2 − t1(
)
+ 1−t1 t 2 ⎛ ⎝ ⎜ ⎞ ⎠ ⎟ 2.919335 − 0.034485hdom(
)
⎛ ⎞ P90t 2= 154.155144 Gt1 t1 t 2 Nt1 ⎛ ⎝ ⎜ ⎜ ⎜ ⎞ ⎠ ⎟ ⎟ ⎟ −0.5 ef t1,t 2,hdom( ) f t1, t1, hdom(
)
= 0.062039 t2 − t1(
)
+ 1−t1 t 2 ⎛ ⎝ ⎜ ⎞ ⎠ ⎟ −6.721703+ 0.039053hdom(
)
d mint 2= 44.99529 Gt1 t1 t 2 Nt1 ⎛ ⎝ ⎜ ⎜ ⎜ ⎞ ⎠ ⎟ ⎟ ⎟ −0.5 ef t1,t 2,hdom( ) ⎛ ⎞ hdom= SI50100.380999−2.694076t−0.5 a= 0.9d min E X( )
2 = G 0.00007854N ; ; b= P90− a 2.995732(
)
1 c v= πd 2 h 400000.336e 0.94 h+ 3.79 d h= 1.891036hdom0.890695 G−0.146749N0.075548 e2.000723t−1−11.96184d−1 SI50= hdom10−0.380999+2.694076t−0.5 a= 0.5d min E X( )
2 = G 0.00007854N ; ; b= P90− a 2.995732(
)
1 c N = 1324.485hdom−0.382656G0.231516e 5.407995 t G= 0.000984hdom2.103402 N0.797707 e −8.702327 t P90= 2.754927hdom1.445365 N−0.161445 d min= 12.302998hdom1.617991 N−0.687786Merchantable volume simulation, over bark, was considered a timber height at 0.15 m; 2.3 m log length; and the following limit diameter for industrial use: round wood (Vround) a minimum diameter of 20 cm, pulp wood (Vpulp) a diameter between 20 and 7 cm and fuel wood (Vfuel) a maximum diameter of 7 cm.
In the simulation process thinning was incorporated, considering a selective thinning from below (in the dominated stand stratum-trees of smaller dbh, since maritime pine is a light species) and a thinning grade defined by the stand residual basal area supported by the stocking indices referred to above.
After having obtained the total and merchantable yield stand table projections, for the stand development scenarios under study, it was possible to assess mean annual increment at the age of 45 years (MAI).
Economic efficiency assessment
Maritime pine average wood sale prices since 2000 were obtained at the National Forest Authority. From 2002 to 2005, the wood sale prices could also be obtai-ned according to the wood industrial destination (SICOP 2005, 2010).
Information about the costs paid for stand establish-ment (site preparation, plantation) and treatestablish-ments (re-lease, pre-commercial thinning and pruning) were obtained at the commission for forest operations super-vising (CAOF).
The year of 2005 was considered was reference for prices and therefore for costs paid because maritime
pine wood sale prices were both the lowest and very similar for the country, the central region and the re-gion of Pinhal Interior Sul (PIS); and in addition they could also be obtained according to the wood industrial destination (Fig. 2).
For each scenario, revenue obtained from sale of standing timber (three commercial thinning and final harvest) was estimated according to industrial use (round wood, pulp wood and fuel wood). The maritime pine wood sale prices, in the stand, according to the wood industrial destination, over bark, in the year of 2005 were: 36.63 euros by m3for round wood, 18.5
euros by m3for pulp wood and 18.16 euros by m3for
fuel wood (SICOP, 2005).
Costs paid of stand establishment (site preparation, plantation) and treatments (release, pre-commercial thinning and pruning) were also estimated based on the average values at the CAOF prices matrix for the year of 2005 (CAOF, 2005).
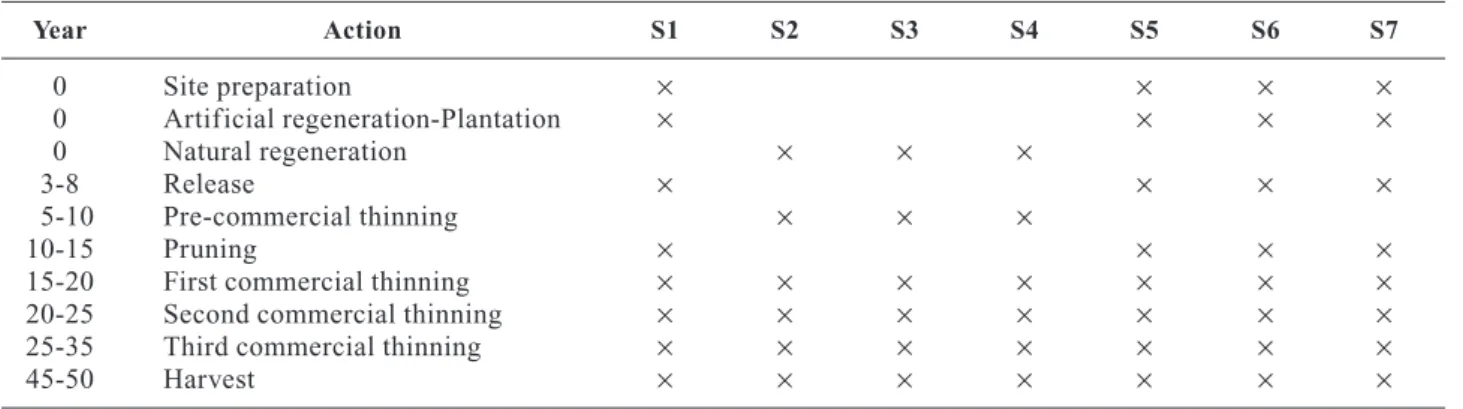
Land was assumed to belong to forest private owners in all scenarios. In scenarios S1, S5, S6 and S7, due to stand spacing, artificial regeneration through plantation were considered and therefore costs for site preparation, plantation, release and pruning were included in the analysis (Table 2). Values ranging from 1,631 to 2,440 euros per hectare, in respect to initial stand density, were used for site preparation and plantation. Values of 530 and 250 euros per hectare were considered for the two releases at the stand age of three and eight years. Finally, values ranging from 45 to 180 euros per hecta-re, in respect to stand density, were used for each of the two pruning actions at the stand age of ten and 15 years. Table 1 (cont.). The PBRAVO model- prediction equations (Páscoa, 1990)
After thinning
Input stand residual basal area per hectare after thinning
Weibull parameters:
N: number of trees per hectare. G: basal area per hectare (m2ha–1). hdom: dominant height (m). t: stand age (years). SI
50: dominant
height at the reference age of 50 years (m). dmin: distribution minimum diameter (cm). P90: diameter distribution 90th
percen-tile. d: tree diameter at breast height (cm). h: tree total height (m). v: tree total volume (m3). t1 and t2: initial and projected age
(years). r: index for variables after thinning.
a= 0.9d minr; E X
( )
2 = Gr 0.00007854Nr ; b= P90r− a 2.995732(
)
1 c Nr = N 1− 1−Gr G ⎛ ⎝ ⎜ ⎞ ⎠ ⎟ 0.715154 ⎛ ⎝ ⎜ ⎜ ⎞ ⎠ ⎟ ⎟ 0.820574 P90r= 1.22143+ 0.981559P90 d minr= 0.684456 +1.07904d minFor scenarios S2, S3 and S4, due to high stand den-sities, natural regeneration was considered, the analysis included only the costs for two pre-commercial thinning to reduce stand density (Table 2), considering a value of 1,070 euros per hectare each at the stand age of ten and 15 years.
A 45-50 year schedule cash-flow for each silvicul-tural prescription was assessed based on the costs and revenues present values in the year of 2005. It was
assumed that land belonged to the forest private owners and there were no constant annual costs.
The net present value of an infinite series (NPVIS) of like rotations and the internal rate of interest (IRR) were used as criteria to assess the economic efficiency scenarios (e.g. Clutter et al., 1983; Davis and Johnson, 1987; Peyron et al., 1998). [7] NPVIS= Ct
( )
e−it t=0 ∞∑
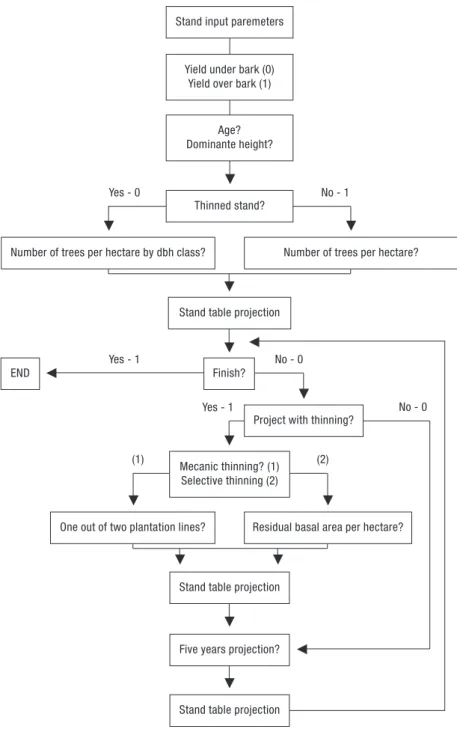
Yes - 0 No - 1 Yes - 1 Yes - 1 No - 0 No - 0 (1) (2) 䊲 䊲 䊲 䊲 䊲 䊲 䊲 䊲 䊲 䊲 䊲 䊲 䊲 䊲 䊲 䊲Stand table projection Mecanic thinning? (1) Selective thinning (2)
Project with thinning?
Five years projection? Stand table projection
Residual basal area per hectare? One out of two plantation lines?
Finish? END
Age? Dominante height? Yield under bark (0) Yield over bark (1) Stand input paremeters
Stand table projection
Number of trees per hectare? Number of trees per hectare by dbh class?
Thinned stand?
where:
Ct = net cash-flow at the rotation age (calculated on
the basis of the costs paid and harvesting revenues).
i = discount rate.
t = rotation age.
The net present value is also referred to in the lite-rature as the land expectation value (Clutter et al., 1983; Davis and Johnson, 1987; Rodrígues et al., 2002).
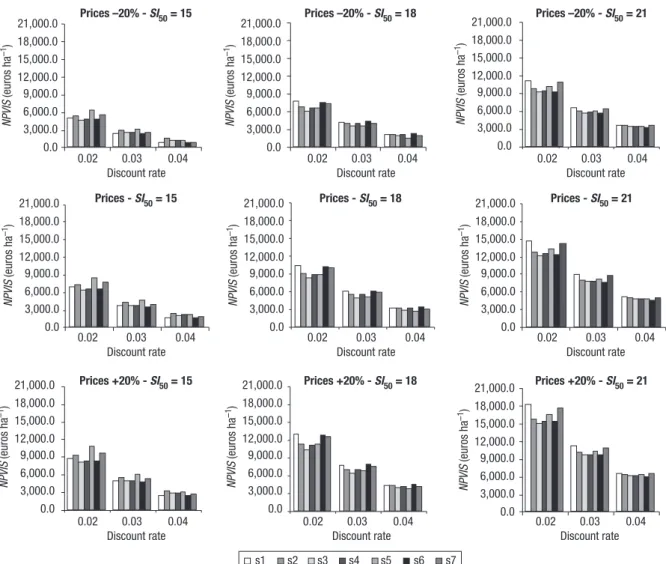
The basic discount rate considered for NPVIS eva-luation was 0.03 (3%). Discount rates of 0.02 and 0.04 were also used to analyse the effect of altering discount rate on the economic results.
The IRR criterion, defined as the discount rate that makes the NPVIS value of a silvicultural option equal to zero, is a unique characteristic of a project and ana-lysis does not require a guiding discount rate for calculation. It is measured by the rate the project actually earns on money invested and is calculated by trial and error to find the discount rate (Clutter et al., 1983; Davis and Johnson, 1987).
Finally, a sensitivity analysis was carried out for all calculations by altering the wood sale prices by ±20%.
Results
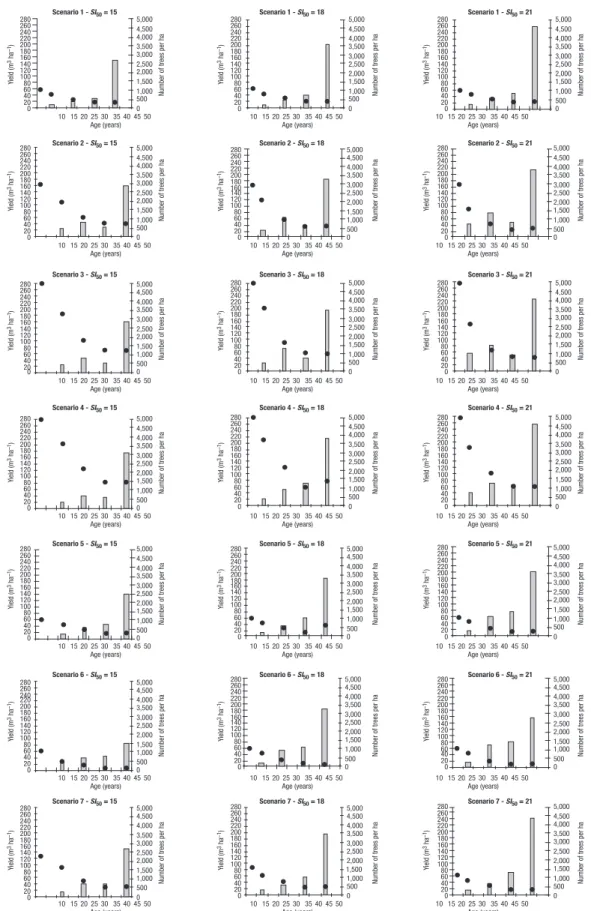
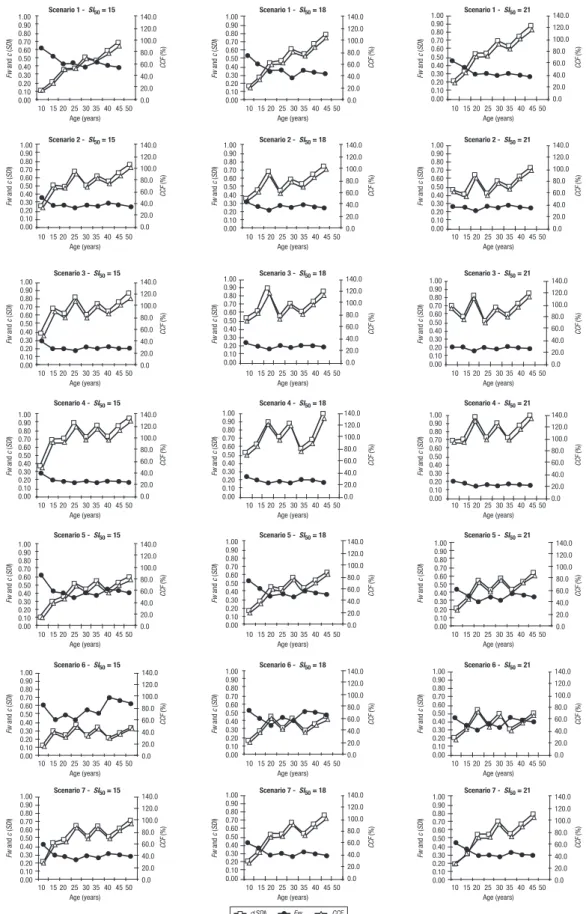
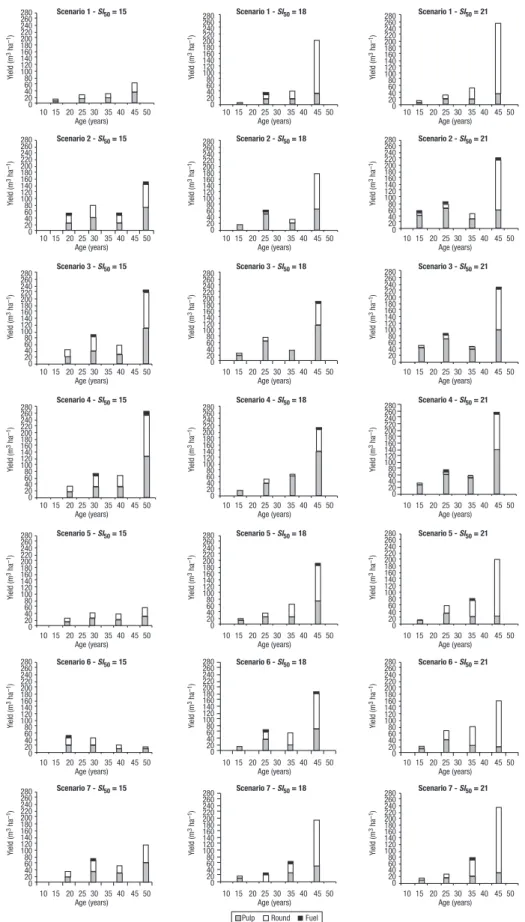
The analysis of the simulated scenarios (Fig. 3, Fig. 4, Fig. 5 and Fig. 6) made possible to compare the avai-lable stand prescriptions for maritime pine proposed in what concerns to stand stocking and the effect on stand total and merchantable volume and the mean annual increment at rotation age.
Scenarios S1, S5, S6 and S7 have initial stand den-sities of 1,100 trees per hectare or slightly superior (around 1,122 to 2,290 trees per hectare depending on site index). For these scenarios artificial regeneration by plantation had been considered. In scenario S1 a thinning rule of removing 25% of stand trees was con-sidered. This prescription resulted in a growing stand stocking reaching an over stocked situation at f inal harvest age, being this scenario the most favourable
Table 2. Stand establishment and treatments schedule for each scenario
Year Action S1 S2 S3 S4 S5 S6 S7 0 Site preparation × × × × 0 Artificial regeneration-Plantation × × × × 0 Natural regeneration × × × 3-8 Release × × × × 5-10 Pre-commercial thinning × × × 10-15 Pruning × × × ×
15-20 First commercial thinning × × × × × × ×
20-25 Second commercial thinning × × × × × × ×
25-35 Third commercial thinning × × × × × × ×
45-50 Harvest × × × × × × ×
Country
Stand maritime pine wood average prices
0 5 10 15 20 25 30 35 40 45 50 2002 2003 2004 2005 Year
Maritime pine wood average prices
0 5 10 15 20 25 30 35 40 45 50 2000 2001 2002 2003 2004 2005 2006 Year Euros per m 3 over bark Euros per m 3 over bark
Country Central region PIS Fuel Poles Roundwood Pulpwood
0 20 40 60 80 100 120 140 160 180 200 220 240 260 280 0 500 1,000 1,500 2,000 2,500 3,000 3,500 4,000 4,500 5,000 10 15 20 25 30 35 40 45 50 Age (years) 10 15 20 25 30 35 40 45 50 Age (years) 10 15 20 25 30 35 40 45 50 Age (years) Scenario 7 - SI50 = 18 Yield (m 3 ha –1)
Number of trees per ha
0 20 40 60 80 100 120 140 160 180 200 220 240 260 280 0 500 1,000 1,500 2,000 2,500 3,000 3,500 4,000 4,500 5,000 10 15 20 25 30 35 40 45 50 Age (years) 10 15 20 25 30 35 40 45 50 Age (years) 10 15 20 25 30 35 40 45 50 Age (years) Scenario 6 - SI50 = 18 Yield (m 3 ha –1)
Number of trees per ha
0 20 40 60 80 100 120 140 160 180 200 220 240 260 280 0 500 1,000 1,500 2,000 2,500 3,000 3,500 4,000 4,500 5,000 10 15 20 25 30 35 40 45 50 Age (years) 10 15 20 25 30 35 40 45 50 Age (years) 10 15 20 25 30 35 40 45 50 Age (years) Scenario 5 - SI50 = 18 Yield (m 3 ha –1)
Number of trees per ha
0 20 40 60 80 100 120 140 160 180 200 220 240 260 280 0 500 1,000 1,500 2,000 2,500 3,000 3,500 4,000 4,500 5,000 10 15 20 25 30 35 40 45 50 Age (years) 10 15 20 25 30 35 40 45 50 Age (years) 10 15 20 25 30 35 40 45 50 Age (years) Scenario 4 - SI50 = 18 Yield (m 3 ha –1)
Number of trees per ha
0 20 40 60 80 100 120 140 160 180 200 220 240 260 280 0 500 1,000 1,500 2,000 2,500 3,000 3,500 4,000 4,500 5,000 10 15 20 25 30 35 40 45 50 Age (years) 10 15 20 25 30 35 40 45 50 Age (years) 10 15 20 25 30 35 40 45 50 Age (years) Scenario 3 - SI50 = 18 Yield (m 3 ha –1)
Number of trees per ha
0 20 40 60 80 100 120 140 160 180 200 220 240 260 280 0 500 1,000 1,500 2,000 2,500 3,000 3,500 4,000 4,500 5,000 10 15 20 25 30 35 40 45 50 Age (years) 10 15 20 25 30 35 40 45 50 Age (years) 10 15 20 25 30 35 40 45 50 Age (years) Scenario 2 - SI50 = 18 Yield (m 3 ha –1)
Number of trees per ha
0 20 40 60 80 100 120 140 160 180 200 220 240 260 280 0 500 1,000 1,500 2,000 2,500 3,000 3,500 4,000 4,500 5,000 10 15 20 25 30 35 40 45 50 Age (years) 10 15 20 25 30 35 40 45 50 Age (years) 10 15 20 25 30 35 40 45 50 Age (years) Scenario 1 - SI50 = 18 Yield (m 3 ha –1)
Number of trees per ha
0 20 40 60 80 100 120 140 160 180 200 220 240 260 280 0 500 1,000 1,500 2,000 2,500 3,000 3,500 4,000 4,500 5,000 Scenario 7 - SI50 = 15 Yield (m 3 ha –1)
Number of trees per ha
0 20 40 60 80 100 120 140 160 180 200 220 240 260 280 0 500 1,000 1,500 2,000 2,500 3,000 3,500 4,000 4,500 5,000 Scenario 6 - SI50 = 15 Yield (m 3 ha –1)
Number of trees per ha
0 20 40 60 80 100 120 140 160 180 200 220 240 260 280 0 500 1,000 1,500 2,000 2,500 3,000 3,500 4,000 4,500 5,000 Scenario 5 - SI50 = 15 Yield (m 3 ha –1)
Number of trees per ha
0 20 40 60 80 100 120 140 160 180 200 220 240 260 280 0 500 1,000 1,500 2,000 2,500 3,000 3,500 4,000 4,500 5,000 Scenario 4 - SI50 = 15 Yield (m 3 ha –1)
Number of trees per ha
0 20 40 60 80 100 120 140 160 180 200 220 240 260 280 0 500 1,000 1,500 2,000 2,500 3,000 3,500 4,000 4,500 5,000 Scenario 3 - SI50 = 15 Yield (m 3 ha –1)
Number of trees per ha
0 20 40 60 80 100 120 140 160 180 200 220 240 260 280 0 500 1,000 1,500 2,000 2,500 3,000 3,500 4,000 4,500 5,000 Scenario 2 - SI50 = 15 Yield (m 3 ha –1)
Number of trees per ha
Scenario 1 - SI50 = 15 0 20 40 60 80 100 120 140 160 180 200 220 240 260 280 0 500 1,000 1,500 2,000 2,500 3,000 3,500 4,000 4,500 5,000 Yield (m 3 ha –1)
Number of trees per ha
0 20 40 60 80 100 120 140 160 180 200 220 240 260 280 0 500 1,000 1,500 2,000 2,500 3,000 3,500 4,000 4,500 5,000 Scenario 7 - SI50 = 21 Yield (m 3 ha –1)
Number of trees per ha
0 20 40 60 80 100 120 140 160 180 200 220 240 260 280 0 500 1,000 1,500 2,000 2,500 3,000 3,500 4,000 4,500 5,000 Scenario 6 - SI50 = 21 Yield (m 3 ha –1)
Number of trees per ha
0 20 40 60 80 100 120 140 160 180 200 220 240 260 280 0 500 1,000 1,500 2,000 2,500 3,000 3,500 4,000 4,500 5,000 Scenario 5 - SI50 = 21 Yield (m 3 ha –1)
Number of trees per ha
0 20 40 60 80 100 120 140 160 180 200 220 240 260 280 0 500 1,000 1,500 2,000 2,500 3,000 3,500 4,000 4,500 5,000 Scenario 4 - SI50 = 21 Yield (m 3 ha –1)
Number of trees per ha
0 20 40 60 80 100 120 140 160 180 200 220 240 260 280 0 500 1,000 1,500 2,000 2,500 3,000 3,500 4,000 4,500 5,000 Scenario 3 - SI50 = 21 Yield (m 3 ha –1)
Number of trees per ha
0 20 40 60 80 100 120 140 160 180 200 220 240 260 280 0 500 1,000 1,500 2,000 2,500 3,000 3,500 4,000 4,500 5,000 Scenario 2 - SI50 = 21 Yield (m 3 ha –1)
Number of trees per ha
0 20 40 60 80 100 120 140 160 180 200 220 240 260 280 0 500 1,000 1,500 2,000 2,500 3,000 3,500 4,000 4,500 5,000 Scenario 1 - SI50 = 21 Yield (m 3 ha –1)
Number of trees per ha
Figure 3. Scenarios S1 to S7 - trees per hectare, commercial thinning and final harvest yield stand and stocking after thinning along
0.00 0.10 0.20 0.30 0.40 0.50 0.60 0.70 0.80 0.90 1.00 0.0 20.0 40.0 60.0 80.0 100.0 120.0 140.0 Scenario 1 - SI50 = 18 10 15 20 25 30 35 40 45 50 Age (years) Fw and c ( SDI ) CCF (%) 0.00 0.10 0.20 0.30 0.40 0.50 0.60 0.70 0.80 0.90 1.00 0.0 20.0 40.0 60.0 80.0 100.0 120.0 140.0 Scenario 2 - SI50 = 18 10 15 20 25 30 35 40 45 50 Age (years) Fw and c ( SDI ) CCF (%) 0.00 0.10 0.20 0.30 0.40 0.50 0.60 0.70 0.80 0.90 1.00 0.0 20.0 40.0 60.0 80.0 100.0 120.0 140.0 Scenario 3 - SI50 = 18 10 15 20 25 30 35 40 45 50 Age (years) Fw and c ( SDI ) CCF (%) 0.00 0.10 0.20 0.30 0.40 0.50 0.60 0.70 0.80 0.90 1.00 0.0 20.0 40.0 60.0 80.0 100.0 120.0 140.0 Scenario 4 - SI50 = 18 10 15 20 25 30 35 40 45 50 Age (years) Fw and c ( SDI ) CCF (%) 0.00 0.10 0.20 0.30 0.40 0.50 0.60 0.70 0.80 0.90 1.00 0.0 20.0 40.0 60.0 80.0 100.0 120.0 140.0 Scenario 5 - SI50 = 18 10 15 20 25 30 35 40 45 50 Age (years) Fw and c ( SDI ) 0.00 0.10 0.20 0.30 0.40 0.50 0.60 0.70 0.80 0.90 1.00 0.0 20.0 40.0 60.0 80.0 100.0 120.0 140.0 Scenario 6 - SI50 = 18 10 15 20 25 30 35 40 45 50 Age (years) Fw and c ( SDI ) CCF (%) 0.00 0.10 0.20 0.30 0.40 0.50 0.60 0.70 0.80 0.90 1.00 0.0 20.0 40.0 60.0 80.0 100.0 120.0 140.0 Scenario 7 - SI50 = 18 10 15 20 25 30 35 40 45 50 Age (years) Fw and c ( SDI ) CCF (%) Scenario 1 - SI50 = 15 0.00 0.10 0.20 0.30 0.40 0.50 0.60 0.70 0.80 0.90 1.00 10 15 20 25 30 35 40 45 50 Age (years) 0.0 20.0 40.0 60.0 80.0 100.0 120.0 140.0 Fw and c ( SDI ) CCF (%) 0.00 0.10 0.20 0.30 0.40 0.50 0.60 0.70 0.80 0.90 1.00 0.0 20.0 40.0 60.0 80.0 100.0 120.0 140.0 Scenario 2 - SI50 = 15 10 15 20 25 30 35 40 45 50 Age (years) Fw and c ( SDI ) CCF (%) 0.00 0.10 0.20 0.30 0.40 0.50 0.60 0.70 0.80 0.90 1.00 0.0 20.0 40.0 60.0 80.0 100.0 120.0 140.0 Scenario 3 - SI50 = 15 10 15 20 25 30 35 40 45 50 Age (years) Fw and c ( SDI ) CCF (%) 0.00 0.10 0.20 0.30 0.40 0.50 0.60 0.70 0.80 0.90 1.00 0.0 20.0 40.0 60.0 80.0 100.0 120.0 140.0 Scenario 4 - SI50 = 15 10 15 20 25 30 35 40 45 50 Age (years) Fw and c ( SDI ) CCF (%) 0.00 0.10 0.20 0.30 0.40 0.50 0.60 0.70 0.80 0.90 1.00 0.0 20.0 40.0 60.0 80.0 100.0 120.0 140.0 Scenario 5 - SI50 = 15 10 15 20 25 30 35 40 45 50 Age (years) Fw and c ( SDI ) 0.00 0.10 0.20 0.30 0.40 0.50 0.60 0.70 0.80 0.90 1.00 0.0 20.0 40.0 60.0 80.0 100.0 120.0 140.0 Scenario 6 - SI50 = 15 10 15 20 25 30 35 40 45 50 Age (years) Fw and c ( SDI ) CCF (%) 0.00 0.10 0.20 0.30 0.40 0.50 0.60 0.70 0.80 0.90 1.00 0.0 20.0 40.0 60.0 80.0 100.0 120.0 140.0 Scenario 7 - SI50 = 15 10 15 20 25 30 35 40 45 50 Age (years) Fw and c ( SDI ) CCF (%) 0.00 0.10 0.20 0.30 0.40 0.50 0.60 0.70 0.80 0.90 1.00 0.0 20.0 40.0 60.0 80.0 100.0 120.0 140.0 Scenario 1 - SI50 = 21 10 15 20 25 30 35 40 45 50 Age (years) Fw and c ( SDI ) CCF (%) 0.00 0.10 0.20 0.30 0.40 0.50 0.60 0.70 0.80 0.90 1.00 0.0 20.0 40.0 60.0 80.0 100.0 120.0 140.0 Scenario 2 - SI50 = 21 10 15 20 25 30 35 40 45 50 Age (years) Fw and c ( SDI ) CCF (%) 0.00 0.10 0.20 0.30 0.40 0.50 0.60 0.70 0.80 0.90 1.00 0.0 20.0 40.0 60.0 80.0 100.0 120.0 140.0 Scenario 3 - SI50 = 21 10 15 20 25 30 35 40 45 50 Age (years) Fw and c ( SDI ) CCF (%) 0.00 0.10 0.20 0.30 0.40 0.50 0.60 0.70 0.80 0.90 1.00 0.0 20.0 40.0 60.0 80.0 100.0 120.0 140.0 Scenario 4 - SI50 = 21 10 15 20 25 30 35 40 45 50 Age (years) Fw and c ( SDI ) CCF (%) 0.00 0.10 0.20 0.30 0.40 0.50 0.60 0.70 0.80 0.90 1.00 0.0 20.0 40.0 60.0 80.0 100.0 120.0 140.0 Scenario 5 - SI50 = 21 10 15 20 25 30 35 40 45 50 Age (years) Fw and c ( SDI ) 0.00 0.10 0.20 0.30 0.40 0.50 0.60 0.70 0.80 0.90 1.00 0.0 20.0 40.0 60.0 80.0 100.0 120.0 140.0 Scenario 6 - SI50 = 21 10 15 20 25 30 35 40 45 50 Age (years) Fw and c ( SDI ) CCF (%) 0.00 0.10 0.20 0.30 0.40 0.50 0.60 0.70 0.80 0.90 1.00 0.0 20.0 40.0 60.0 80.0 100.0 120.0 140.0 Scenario 7 - SI50 = 21 10 15 20 25 30 35 40 45 50 Age (years) Fw and c ( SDI ) CCF (%) CCF (%) CCF (%) CCF (%) c(SDI) Fw CCF
0 20 40 60 80 100 120 140 160 180 200 220 240 260 280 0 20 40 60 80 100 120 140 160 180 200 220 240 260 280 0 20 40 60 80 100 120 140 160 180 200 220 240 260 280
Pulp Round Fuel
Scenario 7 - SI50 = 15 Scenario 7 - SI50 = 18 Scenario 7 - SI50 = 21
10 15 20 25 30 35 40 45 50 Age (years) 10 15 20 25 30 35 40 45 50 Age (years) 10 15 20 25 30 35 40 45 50 Age (years) Yield (m 3 ha –1) Yield (m 3 ha –1) Yield (m 3 ha –1) 0 20 40 60 80 100 120 140 160 180 200 220 240 260 280 0 20 40 60 80 100 120 140 160 180 200 220 240 260 280 0 20 40 60 80 100 120 140 160 180 200 220 240 260 280
Scenario 6 - SI50 = 15 Scenario 6 - SI50 = 18 Scenario 6 - SI50 = 21
10 15 20 25 30 35 40 45 50 Age (years) 10 15 20 25 30 35 40 45 50 Age (years) 10 15 20 25 30 35 40 45 50 Age (years) Yield (m 3 ha –1) Yield (m 3 ha –1) Yield (m 3 ha –1) 0 20 40 60 80 100 120 140 160 180 200 220 240 260 280 Scenario 1 - SI50 = 15 0 20 40 60 80 100 120 140 160 180 200 220 240 260 280 10 15 20 25 30 35 40 45 50 Age (years) 0 20 40 60 80 100 120 140 160 180 200 220 240 260 280 Scenario 1 - SI50 = 18 Scenario 1 - SI50 = 21 10 15 20 25 30 35 40 45 50 Age (years) 10 15 20 25 30 35 40 45 50 Age (years) Yield (m 3 ha –1 ) Yield (m 3 ha –1 ) Yield (m 3 ha –1 ) 0 20 40 60 80 100 120 140 160 180 200 220 240 260 280 0 20 40 60 80 100 120 140 160 180 200 220 240 260 280 0 20 40 60 80 100 120 140 160 180 200 220 240 260 280
Scenario 4 - SI50 = 15 Scenario 4 - SI50 = 18 Scenario 4 - SI50 = 21
10 15 20 25 30 35 40 45 50 Age (years) 10 15 20 25 30 35 40 45 50 Age (years) 10 15 20 25 30 35 40 45 50 Age (years) Yield (m 3 ha –1) Yield (m 3 ha –1) Yield (m 3 ha –1) 0 20 40 60 80 100 120 140 160 180 200 220 240 260 280 0 20 40 60 80 100 120 140 160 180 200 220 240 260 280 0 20 40 60 80 100 120 140 160 180 200 220 240 260 280
Scenario 3 - SI50 = 15 Scenario 3 - SI50 = 18 Scenario 3 - SI50 = 21
10 15 20 25 30 35 40 45 50 Age (years) 10 15 20 25 30 35 40 45 50 Age (years) 10 15 20 25 30 35 40 45 50 Age (years) Yield (m 3 ha –1 ) Yield (m 3 ha –1 ) Yield (m 3 ha –1 ) 0 20 40 60 80 100 120 140 160 180 200 220 240 260 280 0 20 40 60 80 100 120 140 160 180 200 220 240 260 280 0 20 40 60 80 100 120 140 160 180 200 220 240 260 280
Scenario 2 - SI50 = 15 Scenario 2 - SI50 = 18 Scenario 2 - SI50 = 21
10 15 20 25 30 35 40 45 50 Age (years) 10 15 20 25 30 35 40 45 50 Age (years) 10 15 20 25 30 35 40 45 50 Age (years) Yield (m 3 ha –1 ) Yield (m 3 ha –1 ) Yield (m 3 ha –1 ) 0 20 40 60 80 100 120 140 160 180 200 220 240 260 280 0 20 40 60 80 100 120 140 160 180 200 220 240 260 280 0 20 40 60 80 100 120 140 160 180 200 220 240 260 280
Scenario 5 - SI50 = 15 Scenario 5 - SI50 = 18 Scenario 5 - SI50 = 21
10 15 20 25 30 35 40 45 50 Age (years) 10 15 20 25 30 35 40 45 50 Age (years) 10 15 20 25 30 35 40 45 50 Age (years) Yield (m 3 ha –1) Yield (m 3 ha –1) Yield (m 3 ha –1)
for round wood production. In scenarios S5 and S6 the thinning rule used was based on a SDI index, to accor-dingly, provide a fully stocked situation (c(SDI) = 0.58) and an under stocked situation (c(SDI) = 0.26). The results obtained proved a loss in stand total volume, as well in both round and pulp wood production when comparing to scenario S1. In scenario S7 the thinning rule used was the Wilson’s factor, according to a slightly heavy thinning (Fw grade D/E). The results obtained proved this scenario to be very similar to sce-nario S1, although being S7 slightly superior.
Scenarios S2, S3 and S4 have very high initial stand densities (either 5,000 or 3,000 trees per hectare) and therefore natural regeneration had been considered. In scenario S2, with an initial stand density of 3,000 trees per hectare and a thinning rule using Wilson’s factor, according to a slightly heavy thinning (Fw grade D/E) was used. This prescription resulted in a stand total volume similar to scenario S7, although pulp wood increased in relation to round wood. Scenarios S3 and S4 have initial stand densities of 5,000 trees per hectare. In scenario S3 a thinning rule using Wilson’s
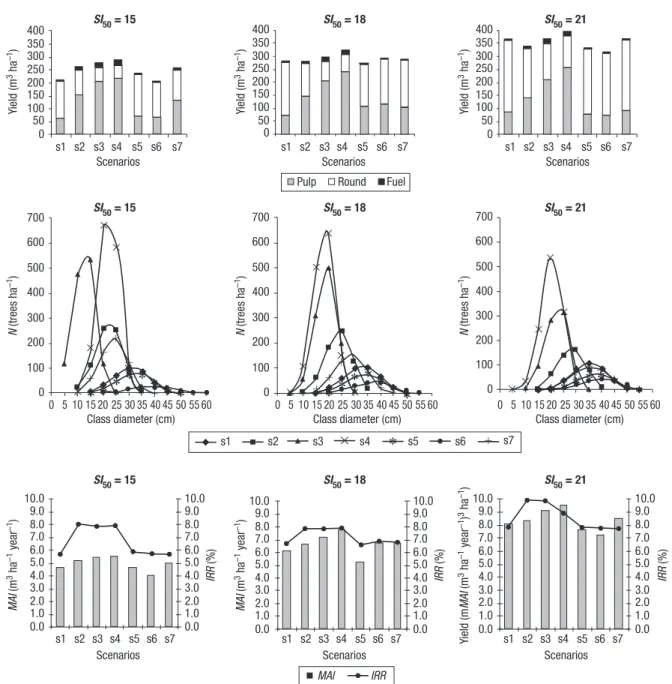
0 50 100 150 200 250 300 350 400 SI50 = 15 0 50 100 150 200 250 300 350 400 0 100 200 300 400 500 600 700 0 5 10 15 20 25 30 35 40 45 50 55 60 Class diameter (cm) 0 100 200 300 400 500 600 700 0 50 100 150 200 250 300 350 400 0 100 200 300 400 500 600 700 0 5 10 15 20 25 30 35 40 45 50 55 60 Class diameter (cm) 0 5 10 15 20 25 30 35 40 45 50 55 60 Class diameter (cm) s1 s2 s3 s4 s5 s6 s7 Scenarios s1 s2 s3 s4 s5 s6 s7 Scenarios s1 s2 s3 s4 s5 s6 s7 Scenarios SI50 = 18 SI50 = 21 SI50 = 15 SI50 = 18 SI50 = 21 Yield (m 3 ha –1) Yield (m 3 ha –1) Yield (m 3 ha –1) N (trees ha –1) N (trees ha –1) N (trees ha –1)
Pulp Round Fuel
× × × × × × × × × × × × × × × × ×
* *
* * * *
* *
*
* *
* *
* *
* * *
* * * * * *
0.0 1.0 2.0 3.0 4.0 5.0 6.0 7.0 8.0 9.0 10.0 0.0 1.0 2.0 3.0 4.0 5.0 6.0 7.0 8.0 9.0 10.0 0.0 1.0 2.0 3.0 4.0 5.0 6.0 7.0 8.0 9.0 10.0 0.0 1.0 2.0 3.0 4.0 5.0 6.0 7.0 8.0 9.0 10.0 0.0 1.0 2.0 3.0 4.0 5.0 6.0 7.0 8.0 9.0 10.0 0.0 1.0 2.0 3.0 4.0 5.0 6.0 7.0 8.0 9.0 10.0 s1 s2 s3 s4 s5 s6 s7 Scenarios s1 s2 s3 s4 s5 s6 s7 Scenarios s1 s2 s3 s4 s5 s6 s7 Scenarios SI50 = 15 SI50 = 18 SI50 = 21 MAI (m 3 ha –1 year –1) MAI (m 3 ha –1 year –1) Yield (m MAI (m 3 ha –1 year –1) 3 ha –1) IRR (%) IRR (%) IRR (%) MAI IRR s2 s1 s3 × s4*
s5 s6 + s7 + + + + + ++ + ++ + + + + + ++ ++ + + +Figure 6. Scenarios S1 to S7 - total stand merchantable yield, diameter distribution at rotation age, mean annual increment (MAI)
factor, according to medium severity thinning (Fw grade C/D) proved to increase stand total volume and pulp wood production. Scenario S4 used a thinning rule based on CCF, ensuring a stand stock with CCF around 100%, meaning a full use of site productivity capacity, before competition starts to occur. This scenario was the most stocked one, having the highest stand total volume, pulp wood production and mean annual increment at the age of 45 years.
From the analysis, one can say that scenarios S1, S5, S6 and S7 goals are round wood oriented and scenarios S2, S3 and S4 goals are pulp wood oriented. For ins-tance, in scenario S7 the number of trees per hectare reaching f inal harvest ranged from 336 to 599 trees per hectare with quadratic mean diameters from 24.4 to 35.4 cm depending on site index. While in scenario S2, the number of trees per hectare reaching final har-vest ranged from 447 to 731 trees per hectare with qua-dratic mean diameters from 22.5 to 28.2 cm depending on site index (Fig. 3 and Fig. 6). In addition, the analy-sis of scenarios stand stability by the slenderness ratio (h/d) proved them to be all stable.
The results of the scenarios economic analysis (Table 3; Fig. 6 and Fig. 7) showed that scenarios S2, S3 and S4 had the highest values of IRR, while highest
NPVIS values were found in scenarios S5, S2 and S7
for poor sites, scenarios S6, S1, S7 and S2 for medium productivity sites and scenarios S1, S7, S5 and S2 for good sites.
In short, if artificial regeneration is an option, scena-rio S5 for poor sites, scenascena-rios S1 or S6 for medium productivity sites and scenarios S1 or S7 for good sites should be preferred. If instead, natural regeneration is an option, scenario S2 should be preferred. Scenario S2 ranked in the first four highest values for IRR and
NPVIS values, having the advantage of using natural
regeneration, saving in site preparation and plantation costs. Total stand volume proved to have a good balan-ce between both round and pulp wood yields.
The analysis of sensitivity (Fig. 7) for different dis-count rates and when prices change in a range of ±20% revealed that scenarios ranking remained generally constant.
Discussion
The present study compared stand total and mer-chantable yield along rotation, the mean annual incre-ment at final harvest age and economic efficiency for the seven silvicultural alternative scenarios and three site quality levels.
Although the findings may depend on the assumptions and the growth model on which they are based on, it was observed that scenarios S2, S3 and S4, that uses natural regeneration as an option, resulted in the highest value for stand yield, mean annual increment and pulp wood yield, being therefore pulp wood oriented. Scenarios S1, S5, S6 and S7, that uses arti-f icial regeneration by plantation as an option, were among the ones of the highest round wood yield, being therefore round wood oriented, but providing as well a more diversified wood products.
The economic analysis results proved to choose nario S2 when natural regeneration is an option and sce-nario S5 for poor sites, scesce-narios S1 or S6 for medium productivity sites and scenarios S1 or S7 for good sites when artificial regeneration by plantation is an option. It was proved that under stocked stand prescrip-tion, such as scenario S6, didn’t provide the highest
Table 3. Results of the economic analysis
SI50 = 15 SI50 = 18 SI50 = 21 Scenario NPVIS IRR NPVIS IRR NPVIS IRR i = 0.02 i = 0.03 i = 0.04 i = 0.02 i = 0.03 i = 0.04 i = 0.02 i = 0.03 i = 0.04 S1 6,848.1 3,671.3 1,639.3 0.0567 10,329.9 5,966.2 3,158.7 0.0670 14,617.7 8,806.7 5,050.5 0.0772 S2 7,299.2 4,245.9 2,388.7 0.0799 9,031.1 5,489.4 3,203.1 0.0787 12,686.0 8,022.6 4,979.8 0.0983 S3 6,401.0 3,681.5 2,026.4 0.0786 8,207.4 4,978.4 2,889.5 0.0783 12,115.0 7,682.3 4,784.5 0.0984 S4 6,481.4 3,721.6 2,050.2 0.0791 8,907.6 5,396.1 3,129.8 0.0784 12,415.1 7,787.1 4,778.3 0.0895 S5 8,465.6 4,540.8 2,105.2 0.0580 8,926.1 5,107.8 2,630.7 0.0656 13,280.9 8,142.1 4,767.4 0.0775 S6 6,554.4 3,528.5 1,605.9 0.0571 10,162.2 6,083.9 3,403.8 0.0685 12,262.2 7,605.6 4,511.4 0.0776 S7 7,589.9 3,939.4 1,685.7 0.0564 9,971.5 5,764.7 3,047.1 0.0667 14,259.3 8,637.5 4,984.0 0.0772 * Best value are highlighted in bold.
merchantable yield neither was the most prof ita-ble one.
The stand prescription by Louro et al. (2002) (scena-rio S1), used as a guide for reforestation in Portugal, was validated being one of the most profitable. So was the stand prescription by Oliveira (1985) (scenario S7). In the same way, but for naturally regenerated stands, the prescription by Oliveira (1999) (scenario S2) was, being in accordance to the stand densities after a pre-commercial thinning proposed by Carrilho et al. (2001). This last prescription enables saving in site preparation and plantation costs, being in at moment the most sui-table for the existing naturally regenerated maritime pine stands of Portuguese private forest areas.
This study results are in accordance a similar study for maritime pine in Spain (Rodrígues-Soalheiro et al., 2000), being selected the most intensive silvicultural prescription (initial stand density of 1,100 trees per
hectare, two thinning and f inal harvest at 35 years). The NPVIS and IRR values were found to be consistent with the ones presented in that study.
Considering that Portuguese forest belongs mostly to non-industrial forest private owners, have a very fragmented patch size, are mainly over stocked (with trees with small dbh) and have no management plan, the use of natural regeneration and scenario S2 will be a good option to start with, since is the closer situation to reality. Natural regeneration of maritime pine refo-restation should be preferred, mainly when excellent levels in burned areas of mature maritime pine stands are observed. Moreover, it is the cheapest approach and it ensures species adaptation. This situation will also provide logs with fewer knots, straight and cylindrical bole which make these stands especially suitable for pole production as opposed to what it was observed in plantations (Cabecinhas, 2008). 0.0 3,000.0 6,000.0 9,000.0 12,000.0 15,000.0 18,000.0 21,000.0 NPVIS (euros ha –1) Prices –20% - SI50 = 15 0.0 3,000.0 6,000.0 9,000.0 12,000.0 15,000.0 18,000.0 21,000.0 NPVIS (euros ha –1) 0.02 0.03 0.04 Discount rate 0.02 0.03 0.04 Discount rate 0.02 0.03 0.04 Discount rate 0.0 3,000.0 6,000.0 9,000.0 12,000.0 15,000.0 18,000.0 21,000.0 NPVIS (euros ha –1) Prices –20% - SI50 = 18 Prices –20% - SI50 = 21
Prices - SI50 = 15 Prices - SI50 = 18 Prices - SI50 = 21
0.0 3,000.0 6,000.0 9,000.0 12,000.0 15,000.0 18,000.0 21,000.0 NPVIS (euros ha –1) 0.0 3,000.0 6,000.0 9,000.0 12,000.0 15,000.0 18,000.0 21,000.0 NPVIS (euros ha –1) 0.02 0.03 0.04 Discount rate 0.02 0.03 0.04 Discount rate 0.02 0.03 0.04 Discount rate 0.0 3,000.0 6,000.0 9,000.0 12,000.0 15,000.0 18,000.0 21,000.0 NPVIS (euros ha –1)
Prices +20% - SI50 = 15 Prices +20% - SI50 = 18 Prices +20% - SI50 = 21
0.0 3,000.0 6,000.0 9,000.0 12,000.0 15,000.0 18,000.0 21,000.0 NPVIS (euros ha –1) 0.0 3,000.0 6,000.0 9,000.0 12,000.0 15,000.0 18,000.0 21,000.0 NPVIS (euros ha –1) 0.02 0.03 0.04 Discount rate 0.02 0.03 0.04 Discount rate 0.02 0.03 0.04 Discount rate s1 s2 s3 s4 s5 s6 s7 0.0 3,000.0 6,000.0 9,000.0 12,000.0 15,000.0 18,000.0 21,000.0 NPVIS (euros ha –1)
Having in mind what was just referred, and being scenario S4 the most productive one, but yet not the most prof itable one, the effect of stand stocking in wood density and stem shape for applications other then pulp or sawmill industries should be investigated. In fact, studies on wood properties of the maritime pine stands in central region of Portugal are being investi-gated the use of small-diameter poles in structural applications and it is believed that this utilization could promote stand thinning operations by providing extra income to forest owners (Morgado et al., 2009). These authors referred that good correlations were obtained between bending strength, density, and local modulus of elasticity and therefore future development of natio-nal strength grading standards are to be considered. Nevertheless the promising results being obtained, wood technology research must be bound up with forest management for effective practical results such as those presented by Cao et al. (2008).
Moreover, the Regional Forest Management Plans are started to be revised, monitoring the last five years achievements. The earlier plans were based in the 1990’s cover land map which was updated in 2009 bringing up signif icant differences in Portuguese landscape that must be integrated in forest fire defence plans and management plans (DR, 2011).
Finally, future research on the effect fire risk and pine wood nematode (Bursaphelenchus xylophilus) attack in financial analysis are also needed. Bright and Price (2000) referred that one technical problem is what value should be included for successor crops, when the time of replacement depends on the incidence of hazards, rather than on a planned rotation. These authors developed a method that can be adapted to any number of hazards, any profile of probability, and to circumstances where the crop replacement strategy de-pends on the fate of the initial crop. This methodology was later considered the analysis of f ire risk in the economic analysis for Monterey pine plantations in Galicia by Rodríguez et al. (2002). These authors considered for the probability of fire destruction for pre-commercial stands of 0.078 and assumed that crop replacement on average f ive years after plantations. For commercial stands fire probability considered was 0.022 for each ten year period. Prices for burnt timber auctions were used and an average relationship between prof itable and total timber of 0.85 was used. Under hazard of f ire destruction the NPVIS values for the treatment options were 30 to 40% lower. These authors referred that a high risk of fire favours shorter
rota-tions, but actually, the concentration of forest fire risk in the ten years after establishment makes the regimes with longer rotations to be more attractive, especially for regions located in climates with a moderate Medi-terranean influence. Rojo et al. (2005) also included the fire risk in the economic analysis of two silvicul-tural alternatives for Scots pine plantations in Galicia and a general decrease in profitability was also observed. Furthermore, one must stress that the present study focused only on economic criteria concerning to timber production, but in areas where protection; conserva-tion; farm forestry; hunting and fishing; and/or leisure and landscape aesthetics functions have priority then other revenues and costs related to those should be brought up to the economic analysis on evaluating alternative silvicultural scenarios.
Acknowledgements
Sincere thanks are due to my colleague, at Instituto Politécnico de Castelo Branco-Escola Superior Agrária, Isabel Figueiredo e Silva, English lecturer, who proof-read this article. Finally, I gratefully acknowledge the two anonymous reviewers whose suggestions greatly improved the manuscript.
References
AFN, 2009. Normas técnicas de elaboração dos planos de gestão florestal. Autoridade Florestal Nacional [on line].Available in http://www.afn.min-agricultura.pt/ portal/gestao-florestal/resource/f icheiros/pgf/manual/ Normas-tecnicas-PGF-AFN.pdf [26 Jul, 2010]. [In Por-tuguese].
ALEGRIA C., 1994. Crescimento e produção do pinheiro bravo na região de Castelo Branco (Páscoa F., Pinheiro L., Isidoro A., eds). Proc Conference on III Congresso Florestal: Os Recursos Florestais no Desenvolvimento Rural, SPCF, DEF/ISA. pp. 269-292.
ALVES A., 1975. Teoria geral da intervenção produtiva. Ed ci-clostilada, Instituto Superior de Agronomia, Lisboa. 100 pp. AVERY T., BURKHART H., 1983. Forest measurements, 3rd
ed. McGraw-Hill Book Company, New York. 381 pp. BAPTISTA F., SANTOS R., 2005. Os proprietários
flores-tais. CELTA, Oeiras. 62 pp.
BRIGHT G., PRICE C., 2000. Valuing forest land under hazards to crop survival. Forestry 73(4), 361-370. BUSSONI A., CABRIS J. 2010. A financial evaluation of
two contrasting silvicultural systems applicable to Pinus
taeda grown in north-east Uruguay. Southern Forests
CABECINHAS G., 2008. Estudo sobre a produção da ma-deira de pinheiro bravo para aproveitamento de varas, madeira de torno e postes região centro litoral de Portugal. Graduation thesis. Instituto Politécnico de Castelo Bran-co, Escola Superior Agrária, Castelo Branco. 25 pp. [In Portuguese].
CAO T., VALSTA L., HÄRKÖNEN S., SARANPÄÄ P., MÄKELÄ A., 2008. Effetcs of thinning and fertilization on wood properties and economic returns for Norway spruce. For Eco and Manage 256, 1280-1289.
CAOF, 2005. Matrizes de referência. Comissão de Acom-panhamento das Operações Florestais [on line]. Available in http://www.idrha.pt/caof [5 May, 2006]. [In Portu-guese].
CARRILHO A., MARQUES A., ACÁCIO V., MACHADO C., 2001. O pinheiro bravo. Caderno técnico. Silvicon-sultores – Ambiente e Recursos Naturais, Lda Federação dos Produtores Florestais de Portugal. 71 pp.
CLUTTER J., FORTSON J., PIENAAR L., BRISTER G., BAILEY R., 1983. Timber management. A quantitative approach. John Wiley & Sons, New York. 307 pp. DAVIS L., JOHNSON K., 1987. Forest management.
McGraw-Hill, New York. 790 pp.
DGRF, 2006. Resultados do IFN 2005|06. Direcção Geral dos Recursos Florestais [on line]. Available in http:// www.afn.min-agricultura.pt/portal/ifn/ifn-apresentacao-de-resultados [25 Mar, 2010]. [In Portuguese].
DR, 1996. Lei nº 33/96 de 17 de Agosto, Lei de bases da política florestal. Diário da República, I Série-A – nº 190 de 17 de Agosto [on line]. Available in http://www. dre.pt/pdf1sdip/1996/08/190A00/25682573.pdf [15 Apr, 2010]. [In Portuguese].
DR, 2006. Resolução do Conselho de Ministros nº 114/2006, Estratégia nacional para as florestas. Diário da Repúbli-ca, I Série – nº 179 de 15 de Setembro [In Portuguese] [on line]. Available in http://www.dre.pt/pdf1s/2006/07/ 13800/50145029.pdf [15 Apr, 2010]. [In Portuguese]. DR, 2009. Decreto-Lei n.º 16/2009, de 14 de Janeiro. Diário
da República, I Série – nº 9 de 14 de Janeiro [on line]. Available in http://dre.pt/pdf1sdip/2009/01/00900/ 0026800273.pdf [26 Jul, 2010]. [In Portuguese]. DR, 2011. Portaria n.º 62/2011, de 2 de Fevereiro. Diário da
República, I Série – nº 23 de 2 de Fevereiro [on line]. Available in http://dre.pt/pdf1sdip/2011/02/02300/ 0065800659.pdf [16 mai, 2011]. [In Portuguese]. GULDIN J., BAKER J., 1988. Yield comparisons from
even-aged and uneven-even-aged loblolly-shortleaf pine stands. South J Appl For 12, 107-114.
HAIGHT R. ,MONSERUD R., 1990. Optimizing any-aged management of mixed-species stands. II. Effects of decision criteria. For Sci 36, 125-144.
HALL A.S., MARTINS L.S., 1986. A previsão do volume do povoamento total - um estudo para o pinheiro bravo. In: Comunicações do 1º Congresso Florestal Nacional, SPCF, Lisboa. pp. 71-77.
HALL A.S., MARTINS L.S., 1993. Produção de madeira de pinheiro bravo. Uma análise económica. Estudos e Infor-mação nº 304, Direcção Geral das Florestas, Lisboa. pp.
HANEWINKEL M., 2002. Comparative economic investi-gations of even-aged and uneven-aged silvicultural sys-tems: a critical analysis of different methods. Forestry 7, 473- 481.
HASSE W., EK A., 1981. A simulated comparison of yields for even-aged versus uneven-aged management of northern hardwood stands. J Environ Manage 12, 235-246. HUSCH B., MILLER C., BEERS T., 1982. Forest
mensu-ration. John Wiley & Sons, New York. 402 pp.
KRAJICEK J., BRINKMAN K., GINGRICH S., 1961 Crown competion - a measure of density. For Sci 7, 35-42.
LOETSCH F., ZOHRER F, HALLER K., 1973. Forest inventory. Vol II. BLV Verlagsgesellshaft mbH, Munchen. 469 pp.
LOURO G., MARQUES H., SALINAS F., 2002. Elementos de apoio à elaboração de projectos florestais, 2ª ed. Estudos e Informação nº 321, Direcção Geral das Florestas -DGF, Lisboa. 108 pp.
LUÍS J., BENTO J., OLIVEIRA A., 1991. A relação alo-métrica na condução de povoamentos florestais. O caso do Pinus pinaster Ait. em Portugal (Páscoa F., Martinho A., Santos H., Ribeiro T., eds). Proc Conferen-ce on Pinhal Bravo, Material Lenhoso e Resina, ESAC. pp. 149-157.
MARTINS R., 2007. Análise da capacidade produtiva da floresta na freguesia de Sarnadas de S. Simão, concelho de Oleiros. Graduation thesis. Instituto Politécnico de Castelo Branco, Escola Superior Agrária, Castelo Branco. 67 pp. [In Portuguese].
MORGADO T. .M., RODRIGUES J., MACHADO J.S., DIAS A.M.P.G., CRUZ H., 2009. Bending and compression strength of Portuguese maritime pine small-diameter poles. Forest Products Journal 59, 23-8.
OLIVEIRA A., 1984. A teoria da produção florestal. CEF, ISA/UTL, Lisboa. 531 pp.
OLIVEIRA A., 1985. Tabela de produção geral para o pinheiro bravo das regiões montanas e submontanas. DGF, CEF, INIC, Lisboa. 37 pp.
OLIVEIRA A., 1999. Boas práticas florestais para o pinheiro bravo. Manual. Centro Pinus, Porto. 31 pp.
PÁSCOA F., 1987. Estrutura, crescimento e produção em povoamentos de pinheiro bravo. Um modelo de simula-ção. Doctoral thesis. Universidade Técnica de Lisboa, Ins-tituto Superior de Agronomia, Lisboa. 241 pp. [In Por-tuguese].
PÁSCOA F., 1990. Using forest inventory data to build growth and yield stands models (Wensel L., Biging G., eds). Proc of the IUFRO Conf on Forest Simulation Systems, University of California, Division of Agriculture and Natural Resources, Bull. 1927. pp. 279-286. PEYRON J.L., TERREAUX J.P., CALVET P., GUO B., 1998.
Principaux critères économique de gestion des fôrets: analyse critique et comparative. Ann For Sci 55, 523-551. PHILIP M., 1994. Measuring trees and forests, 2nded. CAB
INTERNATIONAL, Wallingford, UK. 310 pp.
REINEKE L., 1933. Perfecting a stand density index for even-aged stands. J Agric Res 46, 627-638.
RODRÍGUEZ-SOALLEIRO R., ÁLVAREZ J.G., SCHRÕDER J., 2000. Simulation and comparison of silvicultural alternatives for even-aged Pinus pinaster Ait. stands in Galicia (Northwestern Spain). Ann For Sci 57, 747-754. RODRÍGUEZ-SOALLEIRO R., SÁNCHEZ F., GORGOSO J., CASTEDO F., LÓPEZ C., GADOW K.V., 2002. Eva-luating standard treatment options for Pinus radiata plantations in Galicia (north-western Spain). Forestry 75, 273-284.
ROJO A., DIÉGUEZ-ARANDA U., RODRÍGUEZ-SOALLEIRO R., GADOW K. VON, 2005. Modelling silvicultural and economic alternatives for Scots pine (Pinus sylvestris L.) plan-tations in north-western Spain. Forestry 78(4), 385-401. SICOP, 2005. Indicadores de mercado. SICOP-Sistema de Informação de Cotações de Produtos Florestais na
Produ-ção [on line]. Available in http://cryptomeria.dgrf.min-agricultura.pt [25 Mar, 2005]. [In Portuguese].
SICOP, 2010. Indicadores de mercado. SICOP - Sistema de Informação de Cotações de Produtos Florestais na Produ-ção [on line]. Available in http://cryptomeria.dgrf.min-agricultura.pt [29 Nov, 2010]. [In Portuguese].
SKOVSGAARD J., VANCLAY J., 2008. Forest site produc-tivity: a review of the evolution of dendrometric concepts for even-aged stands. Forestry 81(1), 13-31. doi: 10.1093/ forestry/cpm041.
VANCLAY J., 1994. Modelling forest growth and yield. Applications to mixed tropical forests. CAB INTER-NATIONAL, Wallingford, UK. 312 pp.
WILSON F., 1946. Numerical expression of stocking in terms of height. J For 44, 758-761.