Work Project, presented as part of the requirements for the Award of a Master Degree in Management from the NOVA – School of Business and Economics.
FIELD LAB - CUSTOMER RELATIONSHIP MANAGEMENT AT PCDIGA: EXAMINING CUSTOMER LIFETIME VALUE AT A MULTI-CHANNEL RETAILER
NUNO MIGUEL CAMILO RIBEIRO, 24057
A Project carried out on the Master in Management Program, under the supervision of:
Professor Elizabete Cardoso
FIELD LAB - CUSTOMER RELATIONSHIP MANAGEMENT AT PCDIGA: EXAMINING CUSTOMER LIFETIME VALUE AT A MULTI-CHANNEL RETAILER Abstract
Customer-centric companies focus on sustaining relationships with customers in the long-term. For that purpose, it was pertinent to examine Customer Lifetime Value at the client of this Work Project – PCDIGA, a multi-channel retailer – and draw recommendations on the CLV model to be adopted by the company. Different iterations were tried, with a final model being recommended and applied to get insights on Customer Value at PCDIGA. Based on the insights, initiatives were suggested with the focus on increasing Customer Equity and differentiating customers based on their profitability.
Keywords: CRM, Customer Lifetime Value, Multi-channel Retailing, Return on Customer.
Table of Contents
Introduction... 2
Literature Review ... 3
Methodology ... 9
Analysis and Discussion ... 12
Conclusions and Recommendations ... 15
Introduction
This Work Project was developed by five Masters students with the partnership of the company PCDIGA, as a requirement for the award of a Masters Degree in Management from Nova School of Business and Economics. PCDIGA, our client, is a Portuguese company that established itself in 2003, with headquarters in Leiria, as a specialist retailer in computer equipment and technology, particularly in the gaming area. The core business is online retailing, although the company has currently five open stores in Portugal: Leiria, Parque das Nações (Lisbon), Benfica (Lisbon), Porto, and Braga. PCDIGA positions itself in the market as the retailer that has competitive prices – usually lower than the competitors – and recognized specialized service, being these two aspects the main sources of competitive advantage. Additionally, the company has other strong characteristics such as speed in order delivery, high quality, diversity and specificity of the products with more than 8 000 SKUs, mainly in the gaming area, and partnerships with well-known and established manufacturer brands.
In the retailing of computer equipment and technology market, there are mainly two different types of stores: specialized retailers, such as PCDIGA, and big retailers. Our client is competing with these two types of stores, where the main players are MHR, Globaldata and PcComponentes, which are specialized stores, and Worten, Fnac, Rádio Popular and Media Markt, which are big retailers. Moreover, in 2016, PCDIGA registered an annual operating revenue of 29 505 323€, which shows an increase of 39% (revenue growth rate), when compared to the value of 2015 that was 21 218 598€ (Amadeus, 2018). In fact, PCDIGA’s business has been rapidly growing not only due to the market growth, but also because of the positive word-of-mouth marketing, the high level of customer satisfaction and its strong online community. Furthermore, in the last four years, the company was awarded by a well-established Portuguese magazine of technology, called PCGuia, with the title of the best store of technology.
More recently, PCDIGA started facing challenges regarding identifying and understanding its customers, which led to an increase in the interest of having a customer-centric approach and, consequently, the intention of developing a Customer Relationship Management Department. Therefore, this consulting project comprised the creation of the aforementioned department, alongside the definition of its strategy.
It is divided into five major streams: segmentation of current clients, analysis of marketing campaigns, brand activation and communication, design thinking applied to service automation and recommendation of a Customer Lifetime Value model. The latter will be the focus of this paper.
This article will examine the existing literature in the field of Customer Lifetime Value and its applications in Customer Relationship Management and retailing, with the aim to propose a Customer Lifetime Value model to PCDIGA to help identify the most and the least profitable customers, and to create a measure that links marketing and financial department. The analysis and recommendations were based on the academic knowledge and on the information collected throughout the Field Lab at PCDIGA.
Literature Review
Firstly, in order to understand and examine Customer Lifetime Value (CLV), it is required to define what is a customer and what is Customer Relationship Management (CRM).
A customer is an individual person that makes decisions with the aim of buying or considering to buy a product or a service from a business or a store (Esmaeili Gookeh & Tarokh, 2013). By this reasoning, one of the companies’ priorities nowadays is to ensure a customer-centric approach, which concerns about customers being in the centre of all business activities to ensure their happiness, because they represent the main source of profit, and, consequently, the most valuable asset (Jasek et al., 2018). Thus, in order to achieve this approach, enterprises need to understand their relationship with customers and how to manage it, being this one of the main reasons why CRM is so important.
The roots of CRM were born in the eighties by Dwyer, Schurr and Sejo (1987), when they stated that the relationship between the seller and the buyer should be the focus of marketing and not the transaction itself. Therefore, by developing this relationship with customers, they will stay longer with the company, tending to spend more money, which was validated later by Reichheld and Sasser in 1990 (in Estrella-Ramón, Sánchez-Pérez, Swinnen, & VanHoof, 2013). In fact, the profitability of current customers tends to increase over time, while the acquisition of new customers tends to be more expensive than retaining the current ones (Aghaie, 2009). In fact, as stated by Kotler (1974), acquiring a customer is five times more expensive than retaining one. Since then CRM has been growing, becoming a core business strategy that
integrates business processes and networks to create and deliver value to customers (Buttle, 2015). In other words, CRM consists in understanding and influencing customers, with the aim to fulfil needs and improve customer acquisition, customer satisfaction, customer loyalty and customer profitability (Estrella-Ramón et al., 2013). Moreover, a CRM strategy mainly comprises the acquisition of new customers, the retention of existing ones and the creation of long-term relationships with customers to raise their value and loyalty (Ryals & Knox, 2007), being the CRM motto to Get (acquire), Keep (retain) and Grow (maximize the value of) customers. Nonetheless, the extent of CRM is broader, including the perks about identifying customers, differentiating them, interacting with them and delivering value to them (Peppers & Rogers, 2011). CRM is a mean to create a centric approach. Companies which are customer-centric, being focused on their customers, keeping them and growing their value, are the ones more successful in their industry, since with this approach, enterprises can tailor their offer to customers’ needs, delivering valuable products and services to them (Safari, Safari, & Montazer, 2016). According to Kumar (2007), many companies that changed their approach from product-centric – focus on the products that have in the market – to customer-centric, have seen their profits increased significantly.
As stated above, customers are the most valuable asset in a company, and enterprises need to manage them in order to maximize their value – Customer Value is the value that customers bring to the company in their life cycle. Customer Value can be raised mainly by two routes: one is to acquire new customers; the other is to increase their individual value, selling more to them, reducing the costs of serving them and/or making them stay longer with the company (Buttle, 2015). Furthermore, Customer Value is measured through Customer Equity (CE), which is defined by the sum of all the expected earnings of each current and future customer for the company, that corresponds to the sum of all Customer Lifetime Values (CLVs), [1] 𝐶𝐸 = ∑𝑁𝑖=1𝐶𝐿𝑉𝑖, being equal to the company’s total economic value (Peppers & Rogers, 2011). Additionally, Customer Lifetime Value (CLV) can also be described as Lifetime Value (LTV) or Customer Profitability (CP), depending on the author. In fact, CE and CLV are related, because the first one measures the value of all customers to the firm and the second one measures the value of a particular
customer to the company (Estrella-Ramón et al., 2013). The concept of Customer Lifetime Value was introduced by Kotler (1974), who defined CLV as “the present value of the future profit stream expected given a time horizon of transacting with the customer”, being very similar to a discounted cash flow in finance, however with two main differences: CLV is defined at a segment or a customer level and includes the defection effect, which is the probability of a customer switch to a competitor (Ferrentino, Cuomo, & Boniello, 2016). In 1996, CLV was described as the net present value of the monetary value resulted from transactions and contacts between a customer and the firm (Pearson, 1996). Afterwards, Berger & Nasr (1998) explained CLV as the sum of the net revenues generated from a customer over its life cycle after subtracting the total cost of attracting, selling and servicing, taking into consideration the time value of money. Moreover, in 2002, Jain and Singh described CLV as the net income or loss from a customer over its lifetime of transactions with the company (in Ferrentino, Cuomo, & Boniello, 2016). In 2003, Gupta and Lehmann defined CLV as the present value of all future profits of a customer. Additionally, according to Buttle (2015) CLV is the net present value of the margins generated from a relationship with a customer, segment or cohort – group of customers that has some characteristics in common. In other words, the concept is defined as the net present value of the positive cash flows of a customer, once acquired, minus the costs associated with that customer, such as marketing, selling and production costs, during the time spent with the company (Estrella-Ramón et al., 2013).
Despite that fact that CLV can be defined in different ways, the ambiguity of this concept relies on its managerial applications. For this reason, several authors proposed models to estimate the value of a customer during its lifetime (CLV) and identify the profitable and non-profitable customers for a company (Esmaeili Gookeh & Tarokh, 2013) – according to Kotler & Armstrong (1996) a profitable customer is a client that creates profit, increases revenues and decreases losses. The Customer Lifetime Value models have in consideration how changes in consumer behaviour have an impact on its profitability (Estrella-Ramón et al., 2013). Thus, they address two important topics: one is what are the consumer behaviour variables that are key to the customers’ value, and the other, is how to forecast the customers’ value by
using these variables (Etzion, Fisher, & Wasserkrug, 2005). Moreover, these models have always three main variables, which are the value of the customer over time, the customer survival time – the time that a customer will still be with the company – and the discount factor (Rosset, Neumann, Eick, & Vatnik, 2003), but to these variables many others can be added. Starting with the basic models, CLV can be formulated as the following according Reinartz & Kumar (2003) and Gupta & Zeithaml (2006): [2] 𝐶𝐿𝑉𝑖 = ∑
(𝑝𝑡−𝑐𝑡)𝑟𝑡 (1+𝑑)𝑡 𝑇
𝑡=0 − 𝐴𝐶, where i is customer index, pt is the price paid by the client at the time t, ct is
the cost of serving the client at the time t, rt is the probability of a customer to repeat a purchase (retention
rate), AC is the acquisition cost at the time t0, T is the time horizon and d is the discount rate. In this model,
the issue is in the great amount of data that needs to be retrieved and analysed. Thus, in order to solve this, Gupta & Lehmann (2003) propose a model, also known as simple retention model, that has two assumptions: the profit margin and the retention rate are constant over time; and the lifetime of a customer is infinite. Therefore, the model is the following [3] 𝐶𝐿𝑉𝑖 = 𝑚
𝑟
(1+𝑑−𝑟) subtracting the AC in the case of recently acquired clients, where m is the profit margin per customer. Subsequently, the authors showed that if margins grow at a constant rate (g), the model changes to [4] 𝐶𝐿𝑉𝑖 = 𝑚
𝑟
[1+𝑑−𝑟(1+𝑔)]. Another example of a significant model is the one taught by Cardoso (2018) in the CRM course at Nova SBE, called multivariate model, because of the expanded number of variables included: [5] 𝐶𝐿𝑉𝑖 = 𝑚𝑖(1 + 𝑔𝑛) 𝑡−𝑎𝑖( 𝑟𝑛 1+𝑑−𝑟𝑛) (1 − ( 𝑟𝑛 1+𝑑) 𝑡−𝑖
), where rn is the retention rate of the segment that the customer
belongs, gn is the revenue growth rate of the customer’s segment, t is the predicted time of relationship
between the company and the customer (in years) and a is the duration of the relationship with the customer (in years). This model was created in the context of a telecom retailer (which also sells technological products) to facilitate computations, since it considers a finite horizon and variables regarding the segment to which the individual belongs, instead of variables of a particular client.
Furthermore, more complex models are found in literature, being one the most studied, the Markov migration model. In 2000, Pfeifer & Carraway created this model to estimate CLV, having as advantages:
being flexible to different types of customer relationships; being used both for customer retention and customer migration models; and being easily used in decision-making. Its foundation is the RFM model, which is a marketing framework to predict consumer behaviour, based on 3 variables: Recency – the days passed from the last date which the client made a purchase –, Frequency – the number of times that a client made a purchase – and Monetary value – the total amount spent with the company (in Etzion et al., 2005). In fact, there are different models to calculate CLV, but the most known methods are the simple retention and the Markov migration models (Zhang, Liang, & Wang, 2016). However, there is no best model to use, so the choice of the model depends on the type of the business. Additionally, when choosing a model, enterprises should take into consideration how frequently the CLV should be updated, which depends on the dynamics of the market where it operates, for example, if it is a highly competitive environment, then it is advisable to update CLV more frequently (Ferrentino, Cuomo, & Boniello, 2016).
The importance of CLV as a measure of customer’s profit generation (Buttle, 2015) is growing in the areas of marketing and CRM, and consequently for businesses. In fact, the number of studies on the concept is increasing and the main reasons are: 1) the high pressure to make marketing accountable, being CLV a link between marketing and finance; 2) the inefficiency of financial metrics like stock price, whilst CLV reveals to be a suitable metric in assessing Customer Value; 3) to compute this concept, it is needed to collect a great amount of customer data, and CLV allows firms to use relevant data with concrete objectives (Esmaeili Gookeh & Tarokh, 2013). Hence, by estimating CLV, it is possible to rank and identify customers based on their contribution to the firm’s income, treat each customer differently based on their profitability, focus on the right prospects, and know how much the firm should invest on clients to have positive returns (Kumar, 2007). All these applications reflect the CLV role in the area of CRM. Similarly, CLV is an important concept in a multi-channel retailer, with focus on the e-commerce component. By estimating the Customer Value, retailers will make better decisions concerning promotions, campaigns and customer prioritization, and the IT department will base decisions on this measure, such as servers dedicated to specific customers and prioritize requests (Etzion et al., 2005).
Therefore, retailers require models that accurately estimate their customers’ value, with relevant variables for its business. In the case of retailers, they use already developed models or they create their own models based on the existing ones by changing some variables or adding new ones.
After the estimation of CLV and consequently of CE, according to Peppers & Rogers (2011), there is a measure that can evaluate how well a firm is using customers to create value in the short-term and long-term, called Return on Customer (ROC). ROC is a similar metric to Return on Investment (ROI), that assess the efficiency of how well a company uses capital to create value. Hence, in order to estimate ROC for a particular customer or segment, it is needed information of that particular customer or segment regarding CLV, changes in CLV and profit for the period. However, if the enterprise assesses the ROC at a global level, the Customer Value uses the total Customer Equity, thus the metric will be equal to the Total Shareholder Return (TSH) – which is the overall return that a shareholder gets from having a company’s stock over a period of time (Peppers & Rogers, 2011) –, because CE is equal to the operating value of the business. Moreover, when evaluating a marketing initiative, if the ROC is lower than the cost of capital, and consequently TSH is lower than the cost of capital, the company should not undertake the initiative, since the shareholders would not get benefits, because the Customer Equity generated would not be enough. Therefore, a firm should only implement initiatives when the ROC and TSH are higher than the cost of capital, because it is when value is created for the company and consequently for the shareholders. The formula to compute ROC is the following: [6] 𝑅𝑂𝐶 = 𝑃(𝑡)+(𝐶𝐸(𝑡)−𝐶𝐸(𝑡−1))
𝐶𝐸(𝑡−1) , where P
(t) is
the company cash flow in period t, CE(t) is the Customer Equity in period t, and CE(t-1) is the Customer Equity in period t-1 (Peppers & Rogers, 2011). Additionally, for this computation there are two main steps: the first one is to measure marketing activities and assess the effect on customer acquisition, growth and retention; and the second one is to compute CLV and CE at a certain point. Lastly, when this measure is calculated, it is possible to assess if the company is a value creator, a value harvester or a value destroyer. A value creator is a company where customers are creating value in both short-term and long-term and the ROC is greater than the cost of capital, implying that the future earnings will grow; a value harvester is
when the company is increasing profits, but not CE, and the ROC is not zero, being below the cost of capital, which will likely cause future earnings to decline; and a value destroyer is a firm in which the ROC is below zero, showing that future earnings will definitely decline. ROC as a metric provides managers the incentives to create shareholder value, and also company value (Peppers & Rogers, 2011).
In the context of PCDIGA, the company aims to assume a better customer-centric approach in the sense discussed in this literature, however the metrics used are not assessing the long-term span, which can lead to several mistakes, as discussed above, since PCDIGA could be creating value in the short-term, but destroying its future value base. Therefore, the research question for this paper is “Are PCDIGA’s customers growing in future value?”. To the same extent, taking into consideration the company information and what the literature suggests as essential to know about the clients, the hypotheses to be studied are: H1: The average individual CLV is positive; H2: Different segments have different CLVs; H3:
PCDIGA is growing in Customer Equity; H4: PCDIGA is a value creator company; and H5: PCDIGA’s
ROC is leveraged by customer acquisition.
Methodology
This paper follows a critical realism philosophy of science, implying that the knowledge of reality is a consequence of social conditioning and can only be understood by a knowledge derivation process that consists in a multi-level study of the social world – in the case of PCDIGA, the social world comprises the individual customers, the employees and the organization – (Saunders, Lewis, & Thornhill, 2015). Also, the research approach was inductive in nature, since initially data was collected and only upon its analysis was a theory formulated. More specifically, a mix of methods was used, with both qualitative and quantitative data collection techniques being applied. Therefore, firstly a business analysis was developed by performing an audit to the company, aiming to execute a CRM diagnosis, divided into the techniques stated above. Regarding the qualitative research, the data was collected by: analysing multiple-sources of secondary data in a qualitative way to form an area-based data set, where information was retrieved from data archives platforms, journals and reports in order to understand better the market and the business; conducting face-to-face semi-structured interviews in Portuguese (that were recorded in order to analyse
them afterwards) to the CEO of the company, the after-sales, HR, IT, marketing, orders, product and store managers, that consisted in predetermined open questions varying from interview to interview, with the possibility to explore additional topics that were not covered by the interview guide and with the goal to understand people’s opinion, the business and the market (Saunders et al., 2015); performing mystery shopping in order to assess the quality of customer service and store experience, that consisted in asking and requesting advices about smartphones, as well as for the purchase of one smartphone in a disguised environment, where the observer was a complete participant; developing a customer touchpoint map, which consists in a graph of the company’s interactions with customers across each channel from a customer’s perspective, that helps identify customer touchpoints, track technology implementation and employee performance, and assess if a positive seamless experience is present over these touchpoints (Peppers & Rogers, 2011); doing the 5C’s framework, that comprises the marketing analysis of clients – customer behaviour – , company – strengths and weaknesses –, competitors, collaborators – set of external players that complement the assets of the company – and context – PESTLE analysis (Political, Economic, Social, Technological, Legal and Environmental factors that influence the company and the market) – to have a deep analysis of the company, the business and the market (Dolan, 2014); developing the SWOT framework, as studied in the Advanced Strategy course at Nova SBE, with aim to assess the strengths and weaknesses of the company, and the opportunities and threats of the market.
Regarding the quantitative research, observations in an event (Comic Con Portugal), a store (Benfica store) and the call-centre in Leiria were conducted in a disguised and natural environment (Saunders et al., 2015). For these observations, a grid with all the relevant information to be gathered was prepared, in order to achieve the goals of understanding behaviours, identifying the typical client, assessing the in-store and call-centre services, and understanding what are the reasons why consumers use these services. Also, two self-administered questionnaires were addressed to PCDIGA clients and non-clients, with the aim to study the typical client, brand image, brand awareness, current positioning and get a deeper understanding of the seven segments that were created. There were two different questionnaires available in the first week of
November, one was spread by our research team in their social media platforms and the other was spread by PCDIGA in their social networks, website and newsletter. The questionnaires were very similar, with two main differences: the questionnaire spread by PCDIGA did not include the assessment of brand recognition and the specialized technologic retailers in the predetermined answers, by request of the company. The questionnaires were composed in a structured way, with predetermined possible answers and order, by a filter section – in order to guarantee that the respondents are living in Portugal for more than 5 years and bought a technological product in the last 2 years –, the assessment of consumer behaviour, the allocation to a specific segment, the PCDIGA experience, the non-PCDIGA experience, the comparison of PCDIGA and other retailers, and the demographics section. The survey included non-comparative scaling, such as continuous rating scales to assess customer satisfaction and loyalty, semantic differential scales to evaluate PCDIGA communication and Likert ranking scales to draw PCDIGA brand image, and comparative scaling, like constant sum scaling to understand what variables are important when buying a technological product. This latter quantitative research, with an average time of response of 10 minutes, had 520 respondents where 367 answers were valid and passed the filter section in the questionnaire spread by the team, and had 5 047 respondents, with 3 658 valid answers in the questionnaire spread by PCDIGA. The high number of respondents comes from the fact that a smartphone was raffled to one respondent.
All the tools and methods mentioned so far were the source of information for the Field Lab and can be seen in more detail in the Group Report. Regarding this work stream specifically, the most pertinent sources were the data of the segmentation and campaign analysis streams, that enabled the identification of the most relevant variables that predict customer behaviour and assess its profitability. After this analysis, and having in consideration the fact that PCDIGA is just becoming familiar with the concept of CLV and that more complex models require high skills of collecting and analysing data, three models were studied in order to understand which best examines CLV for PCDIGA.
without and with margin growth rate, and also the multivariate model (Cardoso, 2018). For each model, all the individual Customer Lifetime Values were computed for two periods: one from 02/10/2016 to 02/10/2017 (first year – 2016/2017) and another from 03/10/2017 to 03/10/2018 (second year – 2017/2018). Then, the customers were ranked according to their CLV value in order to know which are the most and the least profitable ones, with the ultimate goal to differentiate customers and to treat them according to their value. By the same line of thought, a more in-depth analysis was conducted to get insights about the segments in terms of profitability and strategy, as well to identify the ones in which the most and the least profitable customers belong. Followed, it was computed the sum of individual CLVs in each specific period, leading to the value of CE in both periods. Finally, it was estimated the ROC, using the formula proposed by Peppers & Rogers (2011). Hence, an analysis concerning these values was made, and recommendations regarding estimation and increase of Customer Value were suggested.
Analysis and Discussion
Using the aforementioned methods and frameworks, it was possible to retrieve all the relevant information and analyse it, in order to answer to the five hypotheses of this research: H1: The average individual CLV
is positive; H2: Different segments have different CLVs; H3: PCDIGA is growing in Customer Equity; H4:
PCDIGA is a value creator company; and H5: PCDIGA’s ROC is leveraged by customer acquisition. The analysis was made with the aim to reject or not reject the hypotheses formulated. Therefore, firstly it was chosen the best model that predicted CLV, which is the multivariate model (Cardoso, 2018), since the others were not predicting CLV accurately. To formulate this model, an interest rate of 2.36% (d) (Banco de Portugal, 2018) was used, as well as the assumptions of 3 years of the predicted time of relationship between the company and the customer (t) – because of the nature of the product, since a technological product (such as smartphones) is bought on average every 2 years (Kantar Worldpanel, 2017) – and of constant revenue growth rate and retention rate over time, being equal for both periods were made. The examination of CLV started by computing the values of the variables that compose the recommended model, which are the profit per customer, the retention rate of each segment, the revenue growth rate of each segment and the duration of the relationship with the customer. Concerning the profit per customer,
it was calculated for both periods. In the first year (2016/2017), the profit varied from -12 945€ to 2 756€, with an average profit of 48€ per customer, with a total value of 1 506 567€. In the second year (2017/2018), the values started at -1 247€ and ended at 4 330€, with an average profit of 54€ per customer, having as total profit for the year 2 467 657€. The reasons for the customers’ unprofitability are due to cases when PCDIGA is selling products at a price lower than the purchasing price, mainly in stock out campaigns, and when the product managers do not include the correct cost of the product in the internal management platform, called PSM, being the profit undervalued. Concerning the retention rate of each segment, the values were estimated through the formula in the slide 54 of the Group Report, being 69% for Melhor Amigo, 71% for Colega de Casa, 62% for Amigo das Boleias, 5% for Amigo Distante, 6% for
O Oportunista, 7% for O Impulsivo and 13% for O Conhecido, having a total retention rate of 33% for all
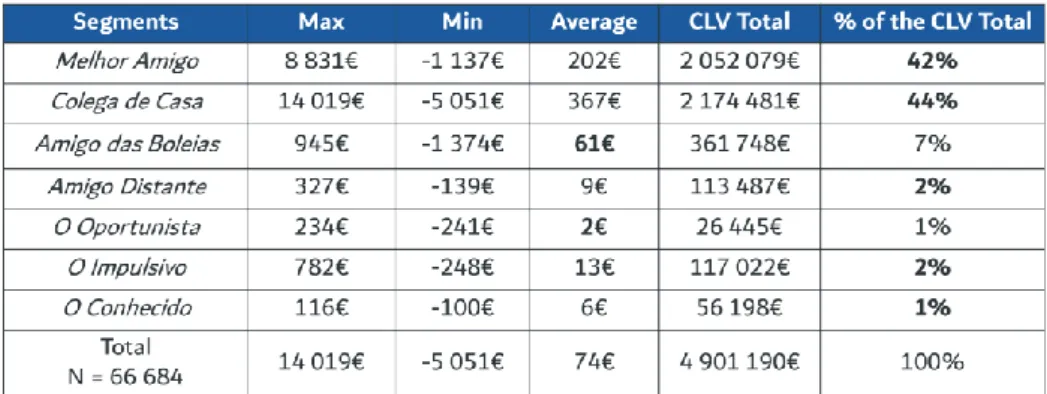
the database. This shows that PCDIGA does an excellent job in retaining customers of the three first segments. By the same extent, the revenue growth rates of each segment were calculated (formula in the slide 54 of the Group Report), which are 54% for all the PCDIGA’s customers, 35% for Melhor Amigo, 86% for Colega de Casa, 88% for Amigo das Boleias, 44% for Amigo Distante, 77% for O Oportunista, 70% for O Impulsivo and 103% for O Conhecido. This reflects that revenues increased significantly from one year to the other and are growing at rates higher than 30%. Furthermore, the duration of the relationship between PCDIGA and the customer can be either one or two years: a customer that only made a purchase in the first or the second year has the value 1 in this variable, whereas a customer that purchased in both years gets a 2. Consequently, the individual Customer Lifetime Values for both years were computed and a ranking of profitability was made with the total values for the two years, in order to assess which are the most and the least valuable customers. CLV comprises values between -5 051€ and 14 019€, with an average of 74€, as it can be seen in Table 1. Hence, H1: The average individual CLV is positive is not rejected, since the average CLV is positive. When looking to the different segments in Table 1, it is possible to state that each one has a different distribution of CLV, meaning that each segment has a different CLV from the others, implying that the H2: Different segments have different CLVs is not rejected. Furthermore,
the ranking was divided into the top 25% and the bottom 25%, which can be seen in Table 2 with the segment distribution in each position of the ranking. Regarding the top of the ranking, it is mainly composed by the segments Melhor Amigo and Colega de Casa, which represent the most valuable customers. According to Peppers & Rogers (2011), these are the segments with the highest value to PCDIGA, being the ones to be retained. Also, the segment Amigo das Boleias is divided, being half present in the top and the other half in the middle of the ranking, therefore Peppers & Rogers (2011) refer to this customers as super-growth customers, which have significant value to the company and a potential to grow their value, being the goal to retain this segment and mine for more value. In terms of middle positions in the ranking, they are composed by the segments Amigo Distante, O Impulsivo and O
Conhecido representing the most growable customers. As stated by Peppers & Rogers (2011), they
represent a low value for the company, but have a significant potential to grow, being the ultimate goal to grow their value. Lastly, the bottom of the ranking is characterized by the segment O Oportunista, which has very low and negative CLVs, and according to Peppers & Rogers (2011), this type of customers belongs to the category below-zero, having a low potential to grow. Thus, the goal for these customers is to make them profitable or churn them out (Peppers & Rogers 2011). Afterwards, the CE was computed, being the value for the first year 1 559 677€, and for the second year 3 341 514€, which reflects a Table 2 - CLV ranking allocated to the segments
significant increase of more than 110% from one year to the other. Therefore, this proves that H3: PCDIGA
is growing in Customer Equity is not rejected. In addition, these results show that, in 2016/2017, PCDIGA
was expecting long-term earnings from customers of more than 1.5 million euros and this value was duplicated in 2017/2018, expecting higher earnings.
Regarding Return on Customer, PCDIGA recorded a value of 2.72 (272%), balancing the short and the long-term, which according to Peppers & Rogers (2011) means that PCDIGA is a value creator company, since its customer base is increasing in value at a rate that is higher than the cost of capital (272% > 2.36%). Thus, PCDIGA can expect its profit to grow in the future, suggesting that H4: PCDIGA is a value creator
company is not rejected. Lastly, it is believed that this high value is due to the acquired customers, since
there were 31 263 clients in 2016/2017 and 45 640 in 2017/2018, of which 10 219 were retained and 35 421 were acquired, reflecting an increase of 46% in the client database, which has a positive impact in the short-term (profit) and long-term (CE) earnings, since as stated by Buttle (2015) this is one of the ways to increase CE, leveraging in this way the ROC. So, the H5: PCDIGA’s ROC is leveraged by customer
acquisition is not rejected. In the end, through this analysis, all the hypotheses were not rejected.
Conclusions and Recommendations
Taking into consideration the research conducted in this work stream and the insights gathered from the Field Lab, it is possible to conclude PCDIGA’s customer value and, with which goal can PCDIGA use the referred concepts in its new CRM department and strategy. Therefore, this final section of the paper is divided into academic implications, managerial implications, limitations and further research.
In terms of academic implications, this analysis showed that the simple retention model with margin growth rate proposed by Gupta & Lehmann (2003) is not suitable for a retailer like PCDIGA, that is growing its revenues at an annual growth rate greater than 30%. As the main reason, the fact when the growth and retention rates have an extremely high value, the CLV is negative.
Regarding managerial implications, a multivariate model is recommended to PCDIGA to estimate CLV, since the other two models were not examining CLV accurately and, this one simplifies computations and takes into consideration relevant variables for PCDIGA, such as revenue growth. Moreover, since this
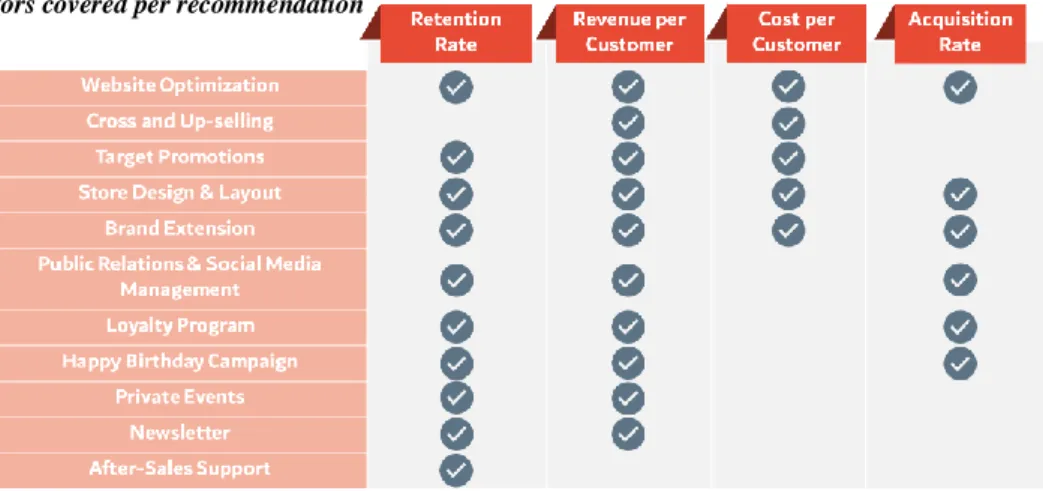
paper aims to understand if customer value is increasing, which in fact is, some recommendations were made to raise CE even more in the future. According to Buttle (2015), there are four ways to achieve this goal: through improving customer retention rate, increasing revenue per customer, decreasing the cost of serving a customer (this three ways increase CLV and consequently CE), and becoming better at acquiring customers (which increases CE). Therefore, PCDIGA should optimize its website, develop a cross and up-selling strategy, implement target promotions to specific segments, improve its stores’ design and layout and its after-sales support, create a retailer brand, a loyalty program, an anniversary campaign and personalized newsletters, organize private events to the most valuable segments and form a public relations strategy. These recommendations are in more detail in the Group Report. Below, there is a summary table (see Table 3), regarding these recommendations in terms of the four factors to increase CE.
Concerning limitations, if another CLV model was suggested instead of the multivariate model, and, if the data collected was complete and reliable, and assessed a longer period, the results would be different. Finally, further research should be conducted on the analysis of acquisition rate and the predicted time of relationship between the customer and the company variables. As it can be seen in slide 58 of the Group Report, the acquisition rates are really high, reflecting an important variable that should be analysed by the company. In relation to the predicted time of the relationship, the assumption in this paper was 3 years, but since this is a variable that affects positively the CLV, a more accurate estimation should be made in order to better estimate CLV. Implementing these recommendations may allow PCDIGA to confidently apply CLV in future segmentations, and hence strengthen their customer-centricity.
References
Aghaie, A. (2009). Measuring and Predicting Customer Lifetime Value in Customer Loyalty Analysis: A Knowledge Management Perspective (A Case Study on an e-Retailer). International Journal of
Industrial Engineering & Production Research, 20(1 & 2), 21–30. Retrieved from
http://ijiepr.iust.ac.ir/article-1-51-en.pdf
Amadeus. (2018). Amadeus - company report of PCDIGA, LDA.
Berger, P. D., & Nasr, N. I. (1998). Customer lifetime value: Marketing models and applications. Journal
of Interactive Marketing, 12(1), 17–30. http://doi.org/10.1002/(SICI)1520-6653(199824)12:1<17::AID-DIR3>3.0.CO;2-K
Buttle, F. (2015). Customer Relationship Management Concept and Technologies.
Cardoso, E. (2018). Customer Lifetime Value. Customer Relationship Management course, 12th
February 2018, Lisbon: Nova School of Business and Economics.
Dolan, R. (2014). Framework for Marketing Strategy Formation. Harvard Business Publishing, 1–36. Esmaeili Gookeh, M., & Tarokh, M. (2013). Customer Lifetime Value Models: A literature survey.
International Journal of Industrial Engineering and Production Management, 24(4), 317–336.
http://doi.org/2008-4889
Estrella-Ramón, A. M., Sánchez-Pérez, M., Swinnen, G., & VanHoof, K. (2013). A marketing view of the customer value: Customer lifetime value and customer equity. South African Journal of Business
Management, 44, 47–64. Retrieved from
http://fesrvsd.fe.unl.pt:2116/ehost/detail/detail?vid=0&sid=07e90d56-b4f9-4fb9-9551-
6c1b3124e10e%40sdc-v-sessmgr04&bdata=JnNpdGU9ZWhvc3QtbGl2ZSZzY29wZT1zaXRl#AN=96352228&db=bth Etzion, O., Fisher, A., & Wasserkrug, S. (2005). e-CLV: A Modeling Approach for Customer Lifetime
Evaluation in e-Commerce Domains, with an Application and Case Study for Online Auction.
Information Systems Frontiers (Vol. 7). Retrieved from
https://fesrvsd.fe.unl.pt:2744/content/pdf/10.1007%2Fs10796-005-4812-6.pdf
Ferrentino, R., Cuomo, M T, & Boniello, C. (2016). On the customer lifetime value: a mathematical perspective. Computational Management Science, 13, 521–539. http://doi.org/10.1007/s10287-016-0266-1
Gupta, S., & Lehmann, D. R. (2003). Customers as assets. Journal of Interactive Marketing, 17(1), 9–24. http://doi.org/10.1002/dir.10045
Gupta, S., & Zeithaml, V. (2006). Customer Metrics and Their Impact on Financial Performance.
Marketing Science, 25(6), 718–739. http://doi.org/10.1287/mksc.1060.0221
Jasek, P., Vrana, L., Sperkova, L., Smutny, Z., Kobulsky, M., Jasek, P., … Kobulsky, M. (2018). Modeling and Application of Customer Lifetime Value in Online Retail. Informatics, 5(1), 2. http://doi.org/10.3390/informatics5010002
Kotler, P. (1974). Marketing during Periods of Shortage. Journal of Marketing, 38(3), 20. http://doi.org/10.2307/1249846
Kumar, V. (2007). Customer Lifetime Value – The Path to Profitability. Foundations and Trends® in
Marketing (Vol. 2). Now Publishers, Inc. http://doi.org/10.1561/1700000004
Pearson, S. (1996). Building Brands Directly. London: Palgrave Macmillan UK. http://doi.org/10.1007/978-1-349-13771-8_13
Peppers, D., & Rogers, M. (2011). Managing customer relationships : a strategic framework. Wiley.
Retrieved from
https://www.wiley.com/en- am/Managing+Customer+Relationships%3A+A+Strategic+Framework%2C+2nd+Edition-p-9780470423479
Pfeifer, P. E., & Carraway, R. L. (2000). Modeling customer relationships as Markov chains. Journal of
Interactive Marketing, 14(2), 43–55. http://doi.org/10.1002/(SICI)1520-6653(200021)14:2<43::AID-DIR4>3.0.CO;2-H
Banco de Portugal (2018). BPstat | Estatísticas Online. Retrieved December 4, 2018, from https://www.bportugal.pt/EstatisticasWeb/(S(4pnhm53oheep15zaqlhu5dmc))/SeriesCronologicas. aspx
Reinartz, W. J., & Kumar, V. (2003). The Impact of Customer Relationship Characteristics on Profitable Lifetime Duration. Journal of Marketing, 67(1), 77–99. http://doi.org/10.1509/jmkg.67.1.77.18589 Rosset, S., Neumann, E., Eick, U., & Vatnik, N. (2003). Customer Lifetime Value Models for Decision
Support. Data Mining and Knowledge Discovery, 7(3), 321–339. http://doi.org/10.1023/A:1024036305874
Ryals, L., & Knox, S. (2007). Measuring and managing customer relationship risk in business markets.
Industrial Marketing Management, 36, 823–833. http://doi.org/10.1016/j.indmarman.2006.06.017
Safari, F., Safari, N., & Montazer, G. A. (2016). Customer lifetime value determination based on RFM model. Marketing Intelligence & Planning, 34(4), 446–461. http://doi.org/10.1108/MIP-03-2015-0060
Saunders, M., Lewis, P., & Thornhill, A. (2015). Research Methods for Business Students. Retrieved from www.pearsoned.co.uk/saunderswww.pearson-books.com
Silveira, C. S., Oliveira, M. O. R. de, & Luce, F. B. (2017). Comparing alternative approaches to estimate customer equity. Marketing Intelligence & Planning, 35(5), 611–625. http://doi.org/10.1108/MIP-10-2016-0183
Zhang, H., Liang, X., & Wang, S. (2016). Customer value anticipation, product innovativeness, and customer lifetime value: The moderating role of advertising strategy. Journal of Business Research,