210
Rev. Bras. Gest. Neg. São Paulo v.20 n.2 apr-jun. 2018 p.210-231
REVISTA BRASILEIRA DE GESTÃO DE NEGÓCIOS ISSN 1806-4892
REVIEw Of BuSINESS MANAGEMENT e-ISSN 1983-0807 © FECAP
RBGN
Review of Business Management
DOI: 10.7819/rbgn.v20i2.3798
210
Received on 03/06/2017 Approved on 09/05/2017
Responsible editor:
Prof. Dr. Susana Costa e Silva
Evaluation process: Double Blind Review
The influence of customer value
on word of mouth: a study of the
financial services company in Brazil
Sandro Bonfim da Costa
11Insper, Marketing Department, São Paulo, Brazil
Danny Pimentel Claro
11Insper, Marketing Department, São Paulo, Brazil
Adriana Bruscato Bortoluzzo
22Insper, Quantitative Methods Department, São Paulo, Brazil
Abstract
Purpose– Our study analyzes the non-linear effect of customer lifetime value (CLV), which accounts for the revenue accumulated over the lifetime of a customer relationship, calculated using a discount rate, on customer referral value (CRV), which accounts for the value created by customers converted to the firm.
Design/methodology/approach– We collected data from customers of a financial institution that provides retirement plan products. A random sample of 768 customers provided the full names of individuals to whom they made a recommendation. After these names were elicited, respondents and referrals were identified in the firm’s records, and we calculated the CLV and CRV values.
Findings – The results show the existence of a U-shaped effect of CLV on CRV, and a negative linear effect of CLV on recommendation intention.
Originality/value– Our study contributes to the body of literature on word of mouth by focusing on a product and business segment with low perceived brand differentiation and low customer involvement. We contribute to the marketing literature by showing a U-shape relationship between CLV and word of mouth activity, represented by CRV.
211 Rev. Bras. Gest. Neg. São Paulo v.20 n.2 apr-jun. 2018 p.210-231
The influence of customer value on word of mouth: a study of the financial services company in Brazil
1
Introduction
Previous research has found evidence suggesting that relationship marketing is a successful strategy for firms. Relationship marketing encompasses marketing activities to establish, develop, and maintain successful exchange relationships with customers (Palmatier, Dant, Grewal, & Evans, 2006). A solid and long-term relationship with customers improves loyalty and enhances retention (Kumar & Reinartz, 2016). Moreover, firms create a competitive advantage by leveraging their marketing activities to convert customers into relationship marketing-based assets (Chang & Olumide, 2016). As a result, the marketing relationship generates positive word of mouth, in which customers play the role of referring other potential customers to a company.
Any individual in the firm can play the customer referral role and boost word of mouth to promote and share experiences. The classic Westbrook (1987) study defined word of mouth as any informal communication directed at other customers about the use and features of products and services, and about their vendors. Word of mouth affects most purchasing decisions and has been the focus of more and more research in recent years. Consumers rely on referrals and lessons from other consumers’ comments when making a purchase decision (Berger, Jonah, & Schwartz, 2011). Word of mouth is even stronger where there is more intense exchange through digital channels, such as the internet and social media. Efforts by firms include intensifying campaigns in digital channels to influence and monitor word of mouth activity (Kozinets, Valck, Wojnicki, & Wilner, 2010). In addition, maintaining word of mouth depends less on how interesting the products are and more on how accessible they are in the consumer’s mind (Kumar, Petersen, & Leone, 2010).
There is a need to study word of mouth activity, what drives word of mouth, and its impact on performance. Kumar, Petersen, and Leone (2010) point out that the financial
value of word of mouth must be large, but it is complex to measure. Capturing word of mouth and performance for each customer becomes even more relevant in the context of competitive pressure and increasing costs of delivering value to customers. The valuable information about customers’ word of mouth activities and performance enables firms to better understand every individual customer and develop proper marketing activities for every opportunity in the customer portfolio. Acting assertively on the best customers is key, and this is at the heart of the marketing research agenda suggested by Kumar, Reinartz, and Werner (2016).
Our study aims to analyze the impact at the individual customer level of customer lifetime value (CLV), which accounts for the revenue accumulated over the lifetime of a customer relationship, calculated using a discount rate, on customer referral value (CRV), which accounts for the value created by customers converted to the firm. First, we deepen the understanding of the impact of customer performance on effective recommendations created by word of mouth. Second, we analyze the effect of CLV on recommendation intention, measured by a 1-10 recommendation score. Third, we run a cluster analysis to identify customer segments according to their performance and effective recommendation value, which enables us to profile customers as brand promoters accounting for their current and potential value for the firm. The contribution of our study lies in developing and empirically testing two key constructs for marketing, adding to the little relationship marketing research that exists in the field.
212
Rev. Bras. Gest. Neg. São Paulo v.20 n.2 apr-jun. 2018 p.210-231 Sandro Bonfim da Costa / Danny Pimentel Claro / Adriana Bruscato Bortoluzzo
to identify customer referral value based solely on recommendation history (Kumar, Petersen, & Leone, 2007). In our study, we capture the construct by assessing effective recommendations that have been made up to a certain point in time, thus representing in real form the value created by customer recommendations. Our construct pinpoints the names referred and assures that these are crosschecked with the firm database to calculate the CLV of the converted customers. It is important to point out the difficulty of obtaining such effective recommendation data because it is necessary to carefully scrutinize names of referred individuals.
The second construct is CLV. Taking into consideration the history and future revenue potential of each customer, CLV enables a customer’s value to a firm during the active time of the relationship to be estimated, including the value created in past purchases. Previous research has shown the importance of CLV (Venkatesan & Kumar, 2004; Kumar, Reinartz, & Werner, 2016) and suggested accounting for the value of the entire flow of customer purchases throughout the lifetime of a customer’s relationship with the company. It also accounts for the present value of future customer cash flow (Pfeifer, Haskins, & Conroy, 2005) or the sum of the discounted cash flow generated by any customer during that customer’s relationship with the firm (Berger & Nasr, 1998). Moreover, CLV accounts for the future by incorporating the dynamic nature of customer behavior and enabling firms to treat customers individually depending on their value contribution to the firm (Kotler & Armstrong, 2016). In addition to measuring individual customer value, this construct for converted customers is the key input for calculating CRV.
Since acquiring new customers is more expensive than retaining current ones, measuring and leveraging CLV is a top priority. This has helped firms identify the most profitable customers and engage in marketing activities for relationship management in recent years (Chang & Olumide, 2016). Moreover, to maximize
a firm’s profitability, it is a critical to manage customers by jointly assessing customer value and customer referral activity (Kumar et al., 2010). This full analysis provides a complete view of each customer’s value by encompassing the revenue generated by them as well as their behavior in terms of spreading the word about brands, products, and services. So, our study sought to examine the relationship between CRV and CLV, and this model can change the way the value of each customer is evaluated by firms. Kumar et al. (2007) suggested that the relationship between these two metrics may be non-linear, identifying customer profiles with low CLV and high CRV and customers with high CLV and low CRV.
To study the impact of CLV on CRV, we collected data from customers of a financial institution that provides retirement plan products. In spite of industry growth, the banking industry is hardly perceived as “something to rely on”, and investors experience difficulties in handling their investments for the long term future. A random sample of 768 customers was used to test the hypotheses of our theoretical model. Respondents were asked to communicate their willingness to recommend (ranging from 0 to 10) and the full names of the individuals to whom they made a recommendation. After the referred names were elicited, the respondents and referrals were identified in the firm’s records, and we calculated the CLV and CRV values. The firm also provided demographic and consumer behavior data used as controls.
2
Customer Referral and Value
213 Rev. Bras. Gest. Neg. São Paulo v.20 n.2 apr-jun. 2018 p.210-231
The influence of customer value on word of mouth: a study of the financial services company in Brazil
(1966) about the word of mouth process proposes that customers are effective and reliable sources of information affecting most purchasing decisions. Interpersonal communication plays an important role in any individual’s choices (Katz & Lazarsfeld, 1955). Some factors may even increase the relevance of these communications in the context of consumption. For instance, increasingly intense interaction between people, whether at work, in school, or even in online social networks, is conducive to the intense dissemination of information on products and services. The dissemination may take place actively, through the direct presentation of product characteristics and opinions, and passively, as visual dissemination through photographs.
Word of mouth occurs in situations where the consumer searches for information about a product he or she intends to purchase or when
214
Rev
. Bras. Gest. Neg. São Paulo v
.20 n.2 apr
-jun. 2018 p.210-231
Sandro Bonfim da Costa / Danny Pimentel Claro / Adriana Bruscato Bortoluzzo
Table 1
Reference Empirical Evidence WOM CLV CRV Main findings and limitations
Berger, Jonah and Schwartz, Eric M. (2011) Journal of Marketing Research
Three studies: 1. About 2,000 volunteers, who received product and gift information, reporting recommendations. 2. 1,687 volunteers, marketing campaigns sent by e-mail. 3. Study with 120 volunteers, through short conversation with stimuli.
Measures the level of recommendation, considering:
• Product interest level;
• Accessibility / visibility, tips, promotional gifts.
N/A N/A
• Accessibility forms WOM.
• Public visibility and tips influence what people talk about.
• Not always the most interesting products are discussed.
• It lacks the investigation of the actual gain of WOM in sales and result, as well as the quality and duration of WOM.
Hidalgo, Pedro, Manzur, Enrique, Olavarrieta, Sergio and Farías, Pablo (2007)
Journal of Business Research
Chilean firms with CLV calculation, based on public data of large corporations.
N/A
Measures CLV considering:
• Fees paid by the customer, less operating expenses.
• Retention rate based on the % of clients who remain in the company after 1 year.
• Employs discount rate of 12%.
N/A
• For industry with low level of brand differentiation and low level of customer involvement, seeking cheaper competitor prices reduces CLV and, consequently, stimulates marketing investment.
215
Rev
. Bras. Gest. Neg. São Paulo v
.20 n.2 apr
-jun. 2018 p.210-231
The influence of customer value on word of mouth: a study of the financial services company in Brazil
Table 1
Reference Empirical Evidence WOM CLV CRV Main findings and limitations
Chang, Chun-Wei and Ijose,Olumide (2016)
Journal of Business Research
4,675 Taiwan’s large bank customers, with 224,112 transactions (January 2011 to January 2013).
• demographic data (age, income, occupation, ZIP code, family size and marital status); and
• Transaction data (purchase value, location and store name and purchase date).
N/A
CLV Calculation considering 4 components:
• Expenses expectation;
• Marketing expenses;
• Retention rate; and
• Discount rate.
N/A
• Creates 4 customer profiles, not only considering CLV but also Current Value (Most Valuable Customers, Potentialities, Loyalty Crisis and Less Valuable Customers).
• It seeks to guide paths for the treatment of each identified profiles.
• As an evolution in future studies, individualized retention rates can be sought, instead of a constant retention rate.
• One can aggregate additional information about marketing actions, interactions and etc., seeking the impact of these actions in CLV.
Persson, Andreas (2013)
European Journal of Marketing
• Qualitative method, with analysis of 3 large banks.
• Interviews with 4 to 6 employees.
• Information of action costs and behavior change results captured, evaluating effects on CLV and ROI.
N/A
Seeks to expand CLV measured result through cost reduction, based on strategies to adapt the customer’s behavior
N/A
• Companies that identify sources of high costs related to their customers can derive substantial benefits in reducing these costs regardless of the customer’s profitability.
• Case studies show that changes in customer behavior reduce costs, maintaining or even increasing retention and margin measured by CLV.
• As a future evolution, it should expand the number of evaluated cases, expand to other industries and with a longer term to analyze the results.
216
Rev
. Bras. Gest. Neg. São Paulo v
.20 n.2 apr
-jun. 2018 p.210-231
Sandro Bonfim da Costa / Danny Pimentel Claro / Adriana Bruscato Bortoluzzo
Table 1 - Continued
Reference Empirical Evidence WOM CLV CRV Main inputs and limitations
Kumar, V. and Reinartz, Werner (2016)
Journal of Marketing
Extensive literature review related to relationship marketing and CLV, using empirical studies of several authors.
N/A
Extensive literature review related to CLV, considering use and intro-duction form.
N/A
• Enjoys vision of Value for the Customer and Customer Value.
• When analyzing Value for the Customer, it defines the concept of Perceived Value by the client, which can be measured by objective attributes or perceived attributes.
• When it addresses Customer Value, it uses CLV as an index that measures the present value of a customer, according to future purchases, considering revenues, expenses and behavior.
• It adds the idea of strategy based on CLV, also used for acquisition, retention and recovery.
• It brings the view that the Customer Value comes not only from the financial value of their purchases, but also from their influence on other consumers.
V. Kumar, J. Andrew Petersen, & Robert P. Leone (2010)
Journal of Marketing
Four studies:
1. Financial companies, including a direct marketing campaign for a sample of 300 clients, out of a total of 14,160 clients.
2. Sample of 600 clients, from the same company, considering total residual of 13,860 customers. 3. Sample (6,700) and control group (6,560) of the residual sample, discounting the two previous groups (13,260). 4. Retail company and sample of 40,000 customers, collected from 2005 to 2007.
N/A
CLV calculation considering, in a certain period:
• Client’s expenses expectation;
• Marketing expenses; and
• Discount rate.
CRV calculation, considering:
• Recommendation time;
• Number of recommendations in the period and margin contribution (excluding margin already existing);
• Cost acquisition saving in case of customer coming from recommendation.
• The article shows how to quantify the incremental results in the marketing strategies guided according to CLV and CRV;
• It empirically illustrates how to determine a set of CRV behavioral drivers, using data from a retail company to drive marketing campaigns more efficiently, as well as opportunities to leverage CRV.
• As limitations, CRV may not apply to all industries.
• Not all companies will have the capability and systems to maintain the CRV.
217
Rev
. Bras. Gest. Neg. São Paulo v
.20 n.2 apr
-jun. 2018 p.210-231
The influence of customer value on word of mouth: a study of the financial services company in Brazil
Table 1 - Continued
Reference Empirical Evidence WOM CLV CRV Main inputs and limitations
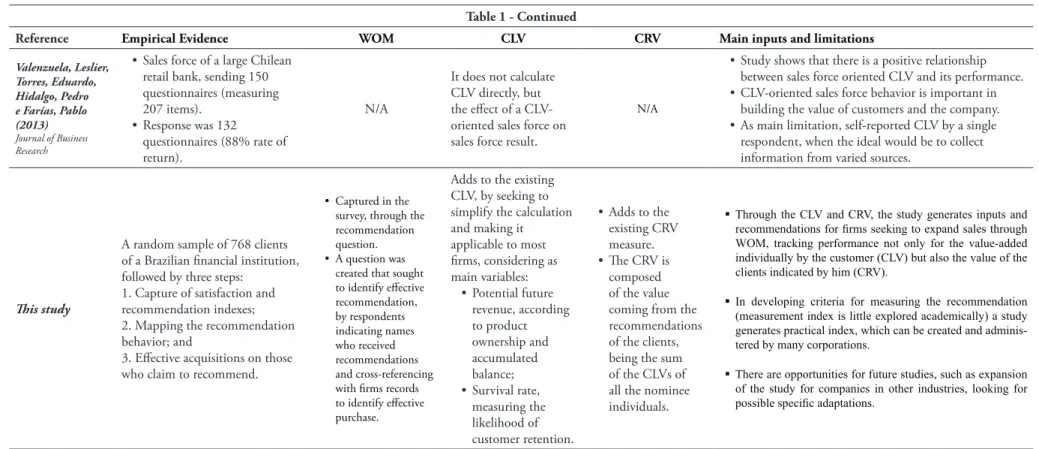
Valenzuela, Leslier, Torres, Eduardo, Hidalgo, Pedro e Farías, Pablo (2013)
Journal of Business Research
• Sales force of a large Chilean retail bank, sending 150 questionnaires (measuring 207 items).
• Response was 132 questionnaires (88% rate of return).
N/A
It does not calculate CLV directly, but the effect of a CLV-oriented sales force on sales force result.
N/A
• Study shows that there is a positive relationship between sales force oriented CLV and its performance.
• CLV-oriented sales force behavior is important in building the value of customers and the company.
• As main limitation, self-reported CLV by a single respondent, when the ideal would be to collect information from varied sources.
This study
A random sample of 768 clients of a Brazilian financial institution, followed by three steps:
1. Capture of satisfaction and recommendation indexes; 2. Mapping the recommendation behavior; and
3. Effective acquisitions on those who claim to recommend.
• Captured in the survey, through the recommendation question.
• A question was created that sought to identify effective recommendation, by respondents indicating names who received recommendations and cross-referencing with firms records to identify effective purchase.
Adds to the existing CLV, by seeking to simplify the calculation and making it applicable to most firms, considering as main variables:
• Potential future revenue, according to product ownership and accumulated balance;
• Survival rate, measuring the likelihood of customer retention.
• Adds to the existing CRV measure.
• The CRV is composed of the value coming from the recommendations of the clients, being the sum of the CLVs of all the nominee individuals.
Through the CLV and CRV, the study generates inputs and
recommendations for firms seeking to expand sales through WOM, tracking performance not only for the value-added
individually by the customer (CLV) but also the value of the clients indicated by him (CRV).
In developing criteria for measuring the recommendation (measurement index is little explored academically) a study generates practical index, which can be created and adminis-tered by many corporations.
There are opportunities for future studies, such as expansion
218
Rev. Bras. Gest. Neg. São Paulo v.20 n.2 apr-jun. 2018 p.210-231 Sandro Bonfim da Costa / Danny Pimentel Claro / Adriana Bruscato Bortoluzzo
Word of mouth relates to attitudinal and behavioral dimensions of loyalty. It involves a customer positively recommending a service or product to another potential customer. In addition, some results show that word of mouth may be the best way to monitor high levels of loyalty (Reichheld, 2003). Loyal customers, who have a strong relationship with a firm, brand, product, and/or vendor, are willing to risk their reputation by recommending it to someone else. Loyalty precedes word of mouth, based on the logic that loyal customers: (i) make firm, positive recommendations to others in their reference group (friends and relatives); (ii) are more motivated to process new information about the firm (to take notice of innovations, for example); and (iii) are more resistant to being persuaded by information that goes against their attitudes (Dick & Basu, 1994). The referral component of word of mouth includes the time when a customer enters into a transaction with a firm and passes his or her purchase experience and motivation on to another customer. Studies have shown that customers who have received a referral and purchased products and/or services have proven to be more profitable over time (Kumar et al., 2010).The decision whether or not to recommend a firm depends on the individual’s perception of the cost and benefit of such an exchange (Ryu & Feick, 2007). As a result, using only willingness to recommend leads to inconsistency because willingness does not fully conceptualize referral activity (Kumar et al., 2010). There are three drivers of referral: (i) post-purchase anxiety reduction, (ii) impact on other people’s impressions, and (iii) a real concern for others and thus helping in their decision process (Ryu & Feick, 2007). There are costs when recommending, such as effort cost and time spent on communication. There is also the risk that the recommendation wears out the relationship, if the product is not considered appropriate.
Firms influence word of mouth intentionally through consumer-to-consumer communication using specific campaigns called Word of Mouth Marketing (Kozinets et al., 2010).
Specific campaigns increase word of mouth and referrals, intensified with increasing use of the internet and thus gaining even more strength and reach (Kozinets et al., 2010). Decisions about how much money to spend on each marketing effort are particularly important. Consequently, in marketing communication, there is a need to develop models that focus on maximizing CRV rather than just measuring CLV (Hidalgo, Manzur, Olavarrieta, & Farías, 2008).
CRV is a key construct of the marketing relationship, especially because the traditional consumer satisfaction construct is not so useful. Previous research studied two years of questionnaire responses, actual consumer behavior (buying and referral patterns), and revenue growth, and found that the growth driver was not consumer satisfaction or loyalty, but actually the predisposition to recommend the product or service to someone else (Reichheld, 2003). There was no direct relationship between satisfaction, consumer behavior, and growth. The construct that proved to be the best growth predictor was “How likely is it that you would recommend this particular brand/product/service to a friend or colleague?” In several industries, there is a strong correlation between firm growth and the percentage of customers who are “promoters”, i.e. those who responded very highly on the recommendation scale (Reichheld, 2003). This shows the importance of assessing CRV as a key construct of the marketing relationship.
219 Rev. Bras. Gest. Neg. São Paulo v.20 n.2 apr-jun. 2018 p.210-231
The influence of customer value on word of mouth: a study of the financial services company in Brazil
the strength of each customer’s relationship with the firm. This component enables this strength to be monitored, as developing and maintaining long term relationships with customers is at the heart of relationship marketing (Berger & Nars, 1998).
Previous studies show that correctly allocating marketing resources to maximize CLV leads to effective results in firm financial performance. In addition, CLV has gained acceptance as a measure of the obtainment, growth, and retention of the right customers through customer relationship management (Boulding, Staelin, Ehret, & Johnston, 2005). Researchers suggests that CLV is a good way of selecting customers and designing marketing programs because customers selected for marketing actions through the CLV model can add more value than the ones selected by traditional relationship measures (Reinartz & Kumar, 2003).
CLV includes purchase frequency, contribution margin, and marketing costs as a function of the future contribution margin, the customer’s propensity to continue the relationship (retention), and the marketing resources allocated to the customer (Venkatesan & Kumar, 2004). Most of the factors that compose the CLV calculation can be positively influenced by the implementation of a relationship strategy. For instance, among the factors that make up CLV is the frequency of purchase, which is influenced by the firm’s relationship strategy.
CRV aims to measure the financial impact of word of mouth and it is inspired by the metric proposed by Kumar et al. (2010). CRV is composed of the value derived from a customer’s recommendations, based on the CLV calculation for each referred individual. The final CRV of a current customer is the sum of the CLVs of all the individuals referred by him or her. According to Rust, Lemon, and Zeithaml (2000), the effect of word of mouth is difficult to measure but is very important for marketing. Few studies have employed a financial measurement of word of mouth and referral behavior, and how word of mouth information can be used to
guide customers consistently (Villanueva, Yoo, & Hanssens, 2008).
Customers can be stimulated through active marketing actions, aiming to increase performance results and recommendations (Kumar et al., 2007). Working with marketing campaigns focused on incrementing one of the two indicators also helps to leverage results. Previous research has demonstrated how important it is to stay focused and take action to improve efficiency, even if the cost of running two campaigns is about the same as one. This is because many concurrent campaigns can lead to confusing information for the customer (Kumar et al., 2010). Another finding of the research shows how a customer can increase CRV even when consumption frequency and referral frequency are moderate (Kumar et al., 2010). Each additional purchase, even when less often, is an opportunity to share the experience with friends, leading to new purchases.
3
Hypotheses
The traditional relationship-marketing model, which evaluates consumers as isolated individuals and with no social interaction, is inappropriate. This model fails to account for the social effect, such as word of mouth and imitation, which influence future purchases (Hogan, Lemon, & Libai, 2004). To maximize firm profitability, customers have to be managed by jointly considering the customer performance and the recommendation constructs (Kumar et al., 2010). Previous studies have shown the importance of CLV (Berger & Schwartz, 2011) and CRV (Persson & Andreas, 2013), however not in an integrated analytical model. This gives rise to the need to assess the impact of CLV and CRV in a fully-integrated model.
220
Rev. Bras. Gest. Neg. São Paulo v.20 n.2 apr-jun. 2018 p.210-231 Sandro Bonfim da Costa / Danny Pimentel Claro / Adriana Bruscato Bortoluzzo
to reinforce the nonlinear relationship found in a previous study (Kumar, Petersen, & Leone, 2007). Although it has not been explored much in the literature, the literature does suggest a potential nonlinear effect between the two constructs, prompting further studies in this direction (e.g., Kumar et al., 2010). The relationship between customer performance and recommendation may not be linear: low-performing customer profiles can lead to a high recommendation rate and high-performance customers can also display high referral activity. Low CLV customers may feel compelled to recommend to potential buyers as a way of rewarding and repaying the firm for what it does well. High CLV customers are natural advocates for their own volume of purchases and investments (Chang & Ijose, 2016). These customers are solid and aspirational references of future investments of potential buyers. Thus, the first hypothesis is presented below:
H1: There is a positive non-linear (U-shaped) effect of Customer Lifetime Value (CLV) on Customer Referral Value (CRV).
The tendency to recommend a firm’s products and/or services emerges as an important predictive variable for revenue growth. Previous studies have shown the impact of the number of “promoters”, that is, customers with a greater potential for repurchases and who add the largest margins to a firm, on the firm’s growth (Reichheld, 2003). On the other hand, customers that generate the most business with firms are not necessarily the ones with the highest recommendation intention (Kumar et al., 2007). Thus, the promoters indicated in referral surveys would not necessarily be the firm’s best customers in terms of total return, including sales performance and sales generation, compared to those customers who were impacted by that particular customer’s word of mouth.
A high recommendation rate actually presents diverse results for different industries. The relationship between recommendation
and growth in monopolistic or near monopoly industries, where the consumer has few options, may be low in terms of the recommendation effect on firm results (Reichheld, 2003). In industries with low brand differentiation and low customer involvement, as is currently the case of the retirement plans segment in Brazil, the choice is often made through inertia (Hidalgo et al., 2008). In addition, some studies also indicate that more interesting products generate immediate recommendations, but the products that generate the most long-term recommendations are those that are more visible or have more publicity (Berger, Jonah, & Schwartz, 2011). In our paper, for some of the characteristics that lead to a low recommendation movement (i.e., a product that is not attractive for short term and with low exposure), it is expected that there is a negative relationship between recommendation and firm revenue growth added by customer value (i.e., CLV). Because of this, the question arises about the real value of customers known as promoters. A negative relationship is expected between the recommendation intention and the actual customer value of those identified as promoters. , This gives rise to the following two hypotheses:
H2: Customer value (current business volume) negatively affects recommendation intention.
H3: Customer Lifetime Value (CLV)
negatively affects recommendation intention.
4
Method
221 Rev. Bras. Gest. Neg. São Paulo v.20 n.2 apr-jun. 2018 p.210-231
The influence of customer value on word of mouth: a study of the financial services company in Brazil
outsourced data collection firm that carried out phone call interviews, preserving anonymity and preventing interference from the financial firm. After removing incomplete responses, our data collection effort yielded 768 complete customer responses, equivalent to a 77% response rate. We removed responses with CRV and CLV values way above the boxplot upper limit (upper limit = 3rd quartile + 1.5 x interquartile range) to avoid distortions in the multiple regression analysis.
We followed three steps in the data collection procedure. First, the intention to recommend was measured for each customer, based on a question with a scale ranging from 0 to 10. To test hypotheses 2 and 3, a sample of 553 customers who answered that they recommended and provided the score for recommendation intention was used. The other two data collection steps were used to test hypothesis 1. In the second step, a consumer’s recommendation behavior was mapped, using a specific question about effective recommendation (yes or no answer), in which 345 customers replied that they recommended the firm’s product. Finally, in the third step the respondents who claimed to have recommended the product provided the full names of the people to whom the product was indicated. In this final stage, 109 customers gave 205 names of people who were impacted by their recommendations. In total, 153 full individual names who received a recommendation were elicited in this step, averaging 1.4 names per respondent customer. Then, we identified the referred names in the firm’s records, so that we could calculate the CLV for each referred name and compute the 109 respondent customers’ CRV.
4.1
CLV measurement
The CLV measure was based on the basic principles of Customer Lifetime Value (Venkatesan & Kumar, 2004) plus two additions. First, we developed a specific survival variable, aiming to capture the customer’s tendency to continue buying from the firm. We sought to identify a survival probability of each customer for
the next 24 months. Second, we used information on customer revenue only, simplifying the measurement with no bias. CLV thus captures customer performance effectively and it is an important indicator for assessing customer recommendation activity.
The survival model, the first addition to the CLV calculation procedure, accounts for the estimation of a customer’s tendency to remain as a customer for the next 24 months. The survival model analyzes the historical behavior of customers and, as a result, identifies the main factors that affect their permanence or exit. The factors are replicated in the total customer database to identify behavioral profiles and the likelihood of each customer maintaining their retirement plan active in the next 24-month period. For its construction, the model took into consideration: (1) an analysis of the past behavior of the active plans with more than 6 months at the end of the year of data collection, and (2) withdrawal behavior followed by cancellation of a plan in the next year.
222
Rev. Bras. Gest. Neg. São Paulo v.20 n.2 apr-jun. 2018 p.210-231 Sandro Bonfim da Costa / Danny Pimentel Claro / Adriana Bruscato Bortoluzzo
Finally, the CLV includes the cross revenue collected for each customer, multiplied by his or her probability of surviving as the firm’s customer:
CLVi= Si(t) × Revenue
where, i denotes the i-th customer, S(t) is the survival function in month t, and Revenue is the expected revenue from the customer’s retirement plans for a maximum period of 24 months.
4.2 CRV measurement
Measuring CRV is more complex than measuring CLV, which may in part explain its low level of use by firms. However, it is important to use CRV to address the gap in the financial measurement of word of mouth. Our procedure for calculating CRV makes additions to simplify the original measure proposed by Kumar et al. (2010). This offers the possibility of firms in different industries employing this measure, especially those in service industries. In the survey questionnaire we identified the
respondent customers who gave the complete names of individuals to whom they recommended the product and purchased plans. Subsequently, these names were identified in the firm’s customer records. Based on an identification of those referred who actually acquired plans, it was possible to develop the measure to estimate the CRV of the customer who referred. In this case, the CRV was calculated as the sum of the CLVs of the referrals identified for the i-th customer, that is:
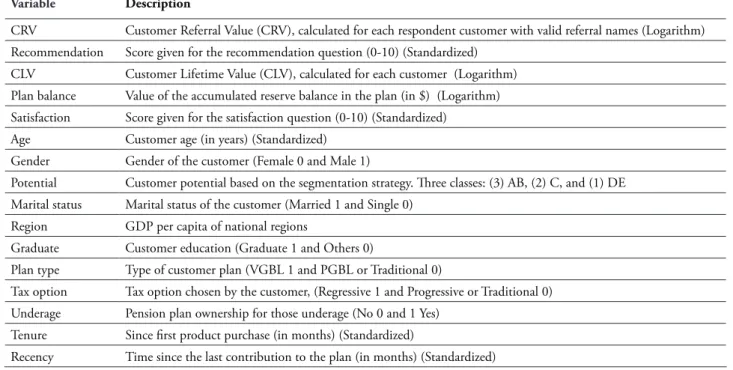
At the end of this process, it was possible to differentiate recommendation intention, represented by the recommendation question with a score ranging from 0 and 10, and the actual recommendation behavior, represented by CRV. Table 2 displays the variables used in our study.
Table 2
Description of Variables
Variable Description
CRV Customer Referral Value (CRV), calculated for each respondent customer with valid referral names (Logarithm) Recommendation Score given for the recommendation question (0-10) (Standardized)
CLV Customer Lifetime Value (CLV), calculated for each customer (Logarithm) Plan balance Value of the accumulated reserve balance in the plan (in $) (Logarithm) Satisfaction Score given for the satisfaction question (0-10) (Standardized)
Age Customer age (in years) (Standardized)
Gender Gender of the customer (Female 0 and Male 1)
Potential Customer potential based on the segmentation strategy. Three classes: (3) AB, (2) C, and (1) DE Marital status Marital status of the customer (Married 1 and Single 0)
Region GDP per capita of national regions
Graduate Customer education (Graduate 1 and Others 0)
Plan type Type of customer plan (VGBL 1 and PGBL or Traditional 0)
Tax option Tax option chosen by the customer, (Regressive 1 and Progressive or Traditional 0) Underage Pension plan ownership for those underage (No 0 and 1 Yes)
Tenure Since first product purchase (in months) (Standardized)
223 Rev. Bras. Gest. Neg. São Paulo v.20 n.2 apr-jun. 2018 p.210-231
The influence of customer value on word of mouth: a study of the financial services company in Brazil
Table 3 presents the descriptive measures and the correlations between the numerical variables used in the study. It is noted that the dispersion of the CRV, CLV, and balance of the plans is very high, as expected, so a logarithmic transformation was used to stabilize the variance of these variables, as described in Table 2. It is also observed that the average recommendation and
satisfaction is high for the customers. Evaluating the correlations between the explanatory and control variables, there is only one strong correlation between CLV and balance (r = 0.811), but this is expected and is not considered high enough, according to Gujarati and Porter (2011), to lead to problems of multicollinearity in the regression model.
Table 3
Descriptive Measures and Correlations between Numerical Variables
Variable (1) (2) (3) (4) (5) (6) (7) (8)
CRV (1) 1
Recommendation (2) 0.051 1
CLV (3) 0.016 -0.036 1
Balance (4) 0.008 -0.040 0.811 1
Satisfaction (5) 0.051 0.696 -0.054 -0.038 1
Age (6) -0.008 -0.042 0.296 0.368 -0.010 1
Time (7) 0.065 -0.081 0.050 0.061 -0.072 0.059 1
Recency (8) 0.032 -0.035 0.024 0.045 -0.009 0.089 -0.016 1
Mean 151.21 8.20 2139.46 54812.84 7.94 47.64 82.83 10.69 Standard deviation 1690.18 2.47 4787.09 133653.94 2.00 13.49 59.17 53.66
5
Results
The final database included 109 customers to evaluate H1 and 553 respondents to evaluate H2 and H3, as explained in the previous section. The hypotheses were tested using ordinary least square regressions estimated using Stata software (15). A residual analysis was performed to verify the validity of the assumptions of the regression model, especially for error homoskedasticity (White test) and error normality (Jarque-Bera test). CRV models 1–3 did not present error normality; however, the sample size was considered large enough (n = 109) for the results to be robust. Also, the assumption of error homoskedasticity failed, so all standard errors presented are heteroskedasticity-robust. Finally, all the models report standardized coefficients, enabling comparison of the variables’ effect.
Table 4 reports the regression models (1–3) to evaluate the impact of CLV on CRV. The complete model (Model 1) achieves good
explanatory power (R2
adj: 0.64). The effect of
IDC2 on CRV is positive and presents statistical
significance, corroborating with hypothesis 1, which predicts the existence of a non-linear, U-shaped relationship (β = 0.05; p <0.05). In addition, a negative linear relationship between recommendation and satisfaction scores is also observed, showing that not always the highest scores attributed to these two items represent a greater number of effective indications for the firm.
224
Rev. Bras. Gest. Neg. São Paulo v.20 n.2 apr-jun. 2018 p.210-231 Sandro Bonfim da Costa / Danny Pimentel Claro / Adriana Bruscato Bortoluzzo
Table 4
Results for Hypothesis 1
Model 1 Model 2 Model 3
Customer Lifetime Value (CLV) -.37 (-2.46)** -.39 (-2.95)*** -.35 (-2.68)***
CLV2 H1 .05 (2.50)** .05 (3.04)*** .04 (2.76)***
Recommendation -.66 (-2.39)** -.69 (-2.61)** -.73 (-2.77)***
Satisfaction -.57 (-3.73)*** -.55 (-3.73)*** -.54 (-3.65)***
Age -.21 (-1.76)* -.17 (-1.57)
Gender 1.06 (6.07)*** 1.08 (6.29)*** 1.12 (6.58)***
Potential .31 (2.61)** .30 (2.66)*** .23 (2.20)**
Marital Status -.38 (-1.91)* -.36 (-1.87)* -.47 (-2.54)**
Region -.12 (-2.47)** -.12 (-2.60)** -.12 (-2.71)***
Graduate -.05 (-.25)
Plan Type .49 (2.28)** .49 (2.33)** .46 (2.22)**
Tax Option -.14 (-.76)
Underage -.87 (-3.33)*** -.95 (-4.86)*** -.96 (-4.86)***
Tenure .23 (2.02)** .25 (2.50)** .25 (2.53)**
Recency .57 (2.31)** .55 (2.29)** .46 (1.96)*
Plan Balance .22 (.62)
Constant 5.75 (12.42)*** 5.66 (13.70)*** 5.88 (15.04)***
R2 0.69 0.69 0.68
Adjusted R2 0.64 0.65 0.64
F-statistic 12.06*** 16.16*** 17.05***
Observations 109 109 109
*p<.10**p < .05; ***p < .01.
Control Variables
Note:The table reports the coefficients, t-values in parentheses.
Variables
CRV
(Customer Referral Value)
Independent Variables
Hypothesis
Hypotheses 2 and 3 were tested using ordinary least square regression for the sample containing 553 observations. The objective was to identify the relationship between recommendation intention, measured on a scale ranging from 0 to 10, and the independent variables CLV and
225 Rev. Bras. Gest. Neg. São Paulo v.20 n.2 apr-jun. 2018 p.210-231
The influence of customer value on word of mouth: a study of the financial services company in Brazil
the ones who promote the brand. Hypothesis 2 was not supported, as the effect of plan balance on recommendation is not significant, indicating that
regardless of the customer business volume, the recommendation intention is on average the same.
Table 5
Results for Hypothesis 2 and 3
Results for Hypotheses 2 and 3
Model 4 Model 5 Model 6 Model 7
Plan Balance H2 -.00 (-.03) -.00 (-.02) -.01 (-.15) -.03 (-.65)
Customer Lifetime Value (CLV) H3 -.01 (-.26) -.01 (-.28) -.01 (-2.21)** -.03 (-1.72)*
CLV2 -.00 (-.25) -.00 (-.23)
Satisfaction .29 (13.09)*** .29 (13.12)*** .29 (13.21)*** .29 (13.63)***
Age .01 (.54) .01 (.55)
Gender -.07 (-2.07)** -.07 (-2.10)** -.07 (-2.18)** -.07 (-2.37)**
Potential -.04 (-1.79)* -.04 (-1.80)* -.04 (-1.97)** -.04 (-2.13)**
Marital Status .00 (.02)
Graduate -.07 (-1.65)* -.06 (-1.64) -.06 (-1.67)*
PlanType .08 (2.05)** .08 (2.07)** .08 (2.00)** .06 (1.83)*
Tax Option -.03 (-.90) -.03 (-.90)
Underage -.01 (-.02) .00 (.13)
Tenure -.02 (-1.17) -.02 (-1.14)
Recency -.03 (-1.80)* -.03 (-1.80)* -.03 (-1.86)* -.02 (-1.76)*
Constant .50 (8.04)*** .50 (8.11)*** .50 (8.51)*** .40 (8.64)***
R2 0.29 0.29 0.29 0.28
Adjusted R2 0.27 0.27 0.27 0.27
F-statistic 14.23*** 16.48*** 21.41*** 29.92***
Observations 553 553 553 553
*p<.10; **p < .05; ***p < .01.
Control Variables
Note:The table reports the coefficients, t-values in parentheses.
Variables Hypotheses Recommendation
Independent Variables
6
Discussion and Implications
6.1 Non-linear effect of customer value
on the recommendation index
In this paper, we seek to expand the understanding of customer performance and customer referral. The results show the existence of a U-shaped effect of CLV on CRV. This finding
226
Rev. Bras. Gest. Neg. São Paulo v.20 n.2 apr-jun. 2018 p.210-231 Sandro Bonfim da Costa / Danny Pimentel Claro / Adriana Bruscato Bortoluzzo
customers to search for information, nor do they create customer involvement with key attributes of the product. On the contrary, consumers are passive recipients of information (Hidalgo et al., 2008). Moreover, previous research lacks an analysis of the effective relationship between performance and recommendation in low involvement industries. Thus, we contribute to the marketing literature by showing a U-shaped relationship between CLV and word of mouth activity, represented by CRV.
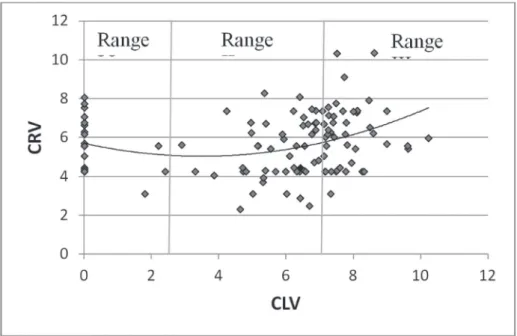
Based on our results, we further investigated our sample by identifying three typical profiles of consumers who recommended (Figure 1). A cluster analysis was performed to split the customers by CRV and CLV (in logarithms) and then the remarkable customer characteristics in each of the bands were identified. Figure 1 displays the scatter plot for CLV and CRV as well as the non-linear trend line, with an R2 equal to 0.108.
We used the hierarchical method, the Euclidian distance as a measure of dissimilarity, and the Ward method in the cluster analysis, using a dendrogram to choose the number of groups. Range I demonstrates the existence of low CLV and high CRV customers. This range is made up of customers with reduced volumes and low future potential, but with high recommendation power. It includes customers who deactivated their plans after the survey, i.e. clients with a low propensity to stay in the long term, but also with a good volume of indications. In accordance with its basic profile, this group of customers can be defined as “Catalysts”, which despite having low revenue
potential for the company (CLV), promote profitability through a consistent number of indications (CRV). Based on the result obtained through cluster analysis, it can be stated that in this group there is balance between the genders and potential segments. A significant portion of this group is represented by the retail segment. The group has higher average satisfaction and recommendation scores and greater proximity to large cities.
227 Rev. Bras. Gest. Neg. São Paulo v.20 n.2 apr-jun. 2018 p.210-231
The influence of customer value on word of mouth: a study of the financial services company in Brazil
Figure 1. Scatter plot and trend curve of CRV as a function of CRV, both in logarithms.
The mass segment customers, mostly found in Ranges I and II, belong to the group that in the Brazilian market have been called the New Middle Class. They have a lower income and, consequently, lower purchasing power and average CLV. However, in this group, especially in Range I, there is potential for significant recommendation. There are opportunities for this segment associated with the strong expansion of the Brazilian middle class. According to a study carried out by Neri (2010), the new Brazilian middle class (i) already represents about 50% of the population, compared to 32.5% in 1992, (ii) has an increasing income profile, and (iii) has a higher education level, with an average of 7.3 years in 2009, compared with 5.0 in 1992. As a result, they are highly prone to future consumption of savings and retirement plans. In addition, the expansion of this segment of the population’s access to better quality healthcare accelerates the movement already identified in Brazil towards increased life expectancy and, consequently, the need for adequate personal, professional, and financial knowledge to meet this new reality. The ultimate challenge is to correctly understand the demands and needs of this public, which has
different behavioral characteristics from the current customers of life and social security insurers, which have traditionally concentrated on higher income segments and the development of products and services adapted to their specific needs.
6.2 Negative effect of customer value on
recommendation intention
228
Rev. Bras. Gest. Neg. São Paulo v.20 n.2 apr-jun. 2018 p.210-231 Sandro Bonfim da Costa / Danny Pimentel Claro / Adriana Bruscato Bortoluzzo
and there are strongly expanding markets. The complementary pension plan in Brazil presents these characteristics, with (i) accelerated growth, (ii) a high concentration in three large banks, (iii) strong bank manager influence in the product sales process, and (iv) a low level of comparison by consumers at the time of sale. These items generate questions regarding the validity of using the NPS methodology as an indicator of customer base performance and resource allocation and relationship marketing actions.
In addition, some researchers also question the results of the research on NPS, since a large amount of recommendation intention does not materialize. This fact can generate inconsistencies when using recommendation intention as a relationship marketing tool (Kumar et al., 2010). Keiningham, Cooil, Andreassen, and Aksoy (2007) also reinforced this argument, concluding that the correlation between NPS and company revenue growth is low. It is also worth mentioning that despite presenting sustainable growth in recent years and proven value for society in the long term, the investment product is not yet a mass product and has attributes that are considered complex. Furthermore, for many people these are not considered to be products that impact on other people’s perceptions, because they are long-term products, with little tangible benefits in the short term. This perception differs from that of immediate consumption products or services, such as cars or hotels, where dissemination through word of mouth may be more intense.
7 Final Considerations and Future
Studies
Based on our study, some recommendations for customer relationship managers could be followed if the manager’s goal is to expand product sales through the word of mouth concept and track customer performance, with a focus not only on the value added by a customer individually (i.e., CLV), but also the value derived from the customer’s referrals (i.e., CRV). First, companies
can deepen their knowledge of customers with a strong propensity for effective recommendation, by mapping demographic, geographic, behavioral, and psychographic data. Second, it is possible to map, in the current customer database, individuals with a similar recommendation profile, in order to structure specific relationship actions that foster the expansion, in this consumer base, of the word of mouth process, and consequently of new business at a reduced acquisition cost in relation to the business originally generated in the banking network. Previous research has demonstrated the importance and effectiveness of actions aimed at specific customer niches with the clear goals of increasing performance or recommendation rates (Kumar et al., 2010). Third, there is also the possibility to identify consumers with this recommendation profile in the list of potential clients of the organization, with the initial aim of capturing new plans, and later applying a relationship marketing strategy that favors loyalty and expansion of the word of mouth process through these new customers.
While it addresses a significant number of customers, some limitations of this study give rise to opportunities for future studies. Carried out using the Brazilian retirement plan segment as a reference, this study reinforces the fragility of recommendation intention as an indicator that drives customer actions and increases revenue. One of the possible explanations that may have led to this result can be captured with the NPS in different industries (Reichheld, 2003). In industries with low marketing differentiation and low customer involvement (such as our focal firm), it can be seen that brand choices are made by inertia (Hidalgo et al., 2008). However, while executives often think that only consumer goods products are worthy of word of mouth, even less attractive products can get large amounts of word of mouth through advertising (Berger & Schwartz, 2011). Therefore, future studies could expand the analysis to other industries with, for instance, a more fiercely competitive profile.
229 Rev. Bras. Gest. Neg. São Paulo v.20 n.2 apr-jun. 2018 p.210-231
The influence of customer value on word of mouth: a study of the financial services company in Brazil
a single company in a single industry of the Brazilian market. Although the sample includes a representative sample of the population, future studies could deepen the theme (i) by expanding the analysis to consumers of other companies in the same industry or (ii) by extending the investigation to other industries that already use the concept of recommendation as a way of measuring the performance of the customer base. Our paper considered a performance construct (CLV) and effective recommendation (CRV), which is adherent to the services segment and based on previous studies and formulations. Depending on the needs and objectives, other studies could seek a new adaptation based on the specific characteristics of the firm or industry under analysis. Finally, in order to simplify the data collection, this study did not consider whether the referred customers would buy the product without any recommendation. This factor is one of the items considered in the process of constructing the CRV measure (Kumar et al., 2010) and could be improved in future studies.
References
Brooks, R. C. (1957). ‘Word of Mouth’ Advertising in Selling New Products. Journal of Marketing, 22(2), 154–61.
Berger, Jonah; Schwartz, Eric M. (2011).What Drives Immediate and Ongoing Word of Mouth. Journal of Marketing Research, 48, 869-880.
Berger, P. D., & Nars, N. I. (1998). Customer Lifetime Value: Marketing Models and Applications. Journal of Interactive Marketing, 12(1), 17-30.
Boulding, W., Staelin, R., Ehret, M., & Johnston, W. J. (2005). A Customer Relationship Roadmap: What Is Known, Potential Pitfalls, and Where To Go. Journal of Marketing, 69(4), 155-166.
Chang, Chun-Wei, & Olumide, I. (2016). Measuring Customer Lifetime Value: An Application in Credit Card Industry. Journal of Business Research, 1, 7-24
Dichter, E. (1966). How Word-of-Mouth
Advertising Works. Harvard Business Review, 44, 147–166.
Dick, A. S., & Basu, K. (1994). Customer Loyalty: Toward an Integrated Conceptual Framework. Journal of the Academy of Marketing Science, 22, 99-113.
Gujarati, D. N., & Porter, D. C. (2011). Econometria Básica. Porto Alegre: AMGH Editora Ltda.
Hidalgo, P.; Manzur, E.; Olavarrieta, S.; Farías, P. (2008). Customer Retention and Price Matching_ The AFPs Case. Journal of Business Research, 61(6), 691-696.
Hogan, J. E., Lemon, K. N., & Libai, B. (2004). Quantifying the Ripple: Word-of-Mouth and Advertising Effectiveness. Journal of Advertising Research, 44(3), 271-280.
Katz, E., & Lazarsfeld, P. F. (1955). Personal Influence. New York: The Free Press.
Keiningham, T. L., Cooil, B., Andreassen, T. W., & Aksoy, L. (2007). A Longitudinal Examination of Net Promoter and Firm Revenue Growth. Journal of Marketing, 71(3), 39–51.
Kotler, P., & Armstrong, G. (1996). Principles of Marketing. Prentice Hall.
Kozinets, R. V., Valck, K., Wojnicki, A. C., & Wilner, S. J. S. (2010). Networked Narratives: Understanding Word-of-Mouth Marketing in
Online Communities. Journal of Marketing,
74(2), 71–89.
Kumar, V., Petersen, J. A., & Leone, R. P. (2010). Driving Profitability by Encouraging Customer
Referrals: Who, When, and How. Journal of
Marketing, 74(5), 1–17.
Kumar, V., Petersen, J. A., & Leone, R. P. (2007).
How Valuable Is Word of Mouth? Harvard
230
Rev. Bras. Gest. Neg. São Paulo v.20 n.2 apr-jun. 2018 p.210-231 Sandro Bonfim da Costa / Danny Pimentel Claro / Adriana Bruscato Bortoluzzo
Kumar, V.; Reinartz, W. (2016). Creating Enduring Customer Value. Journal of Marketing, 80, 36-68.
Neri, M. C. (2010). A Nova Classe Média: O Lado Brilhante dos Pobres. Rio de Janeiro: FGV/CPS.
Palmatier, R. W., Dant, R. P., Grewal, D., & Evans, K. R. (2006). Factors Influencing the Effectiveness of Relationship Marketing: A Meta-Analysis. Journal of Marketing, 70(4), 136-153.
Persson, A. (2013). Profitable Customer Management: Reducing Costs by Influencing
Customer Behaviour. European Journal of
Marketing, 47, 857-876
Pfeifer, P. E., Haskins, M. E., & Conroy, R. M. (2005) Customer lifetime value, customer profitability, and the treatment of acquisition spending. Journal of Managerial Issues, 17(1), 11-25.
Reichheld, F. F. (2003). The One Number You Need. Harvard Business Review, 81(12), 46-54.
Reinartz, W. J., & Kumar, V. (2003). The Impact of Customer Relationship Characteristics
on Profitable Lifetime Duration. Journal of
Marketing, 67(1), 77-99.
Rust, R. T., Lemon, K. N., & Zeithaml, V. A. (2004). Return on Marketing: Using Customer Equity to Focus Marketing Strategy. Journal of Marketing, 68(1), p. 109–127.
Ryu, G., & Feick, L. (2007). A Penny for Your Thoughts: Referral Reward Programs and Referral Likelihood. Journal of Marketing, 71(1), p. 84–94.
Steiner, P. J. N., Schlemer, C. B., & Pádua, F. P. Jr. (2005). Um estudo sobre o arrependimento de adolescentes proprietários de aparelho celular na cidade de Curitiba. Revista Eletrônica de Ciência Administrativa (RECADM), 4(2), 1-15.
Valenzuela, L., Torres, E., Hidalgo, P., & Farías, P. (2014). Salesperson CLV Orientation’s Effect on Performance. Journal of Business Research, 67(4), 550-557.
Venkatesan, R., & Kumar, V. (2004). A Customer Lifetime Value Framework for Customer Selection and Resource Allocation Strategy. Journal of Marketing, 68(4), 106–125.
Villanueva, J., Yoo, S., & Hanssens, D. M. (2008). The Impact of Marketing-Induced Versus Word-of-Mouth Customer Acquisition on Customer Equity Growth. Journal of Marketing Research, 45(1), 48-59.
Westbrook, R. A. (1987). Product/Consumption – Based Affective Responses and Postpurchase Processes. Journal of Marketing, 24(3), 258–270.
231 Rev. Bras. Gest. Neg. São Paulo v.20 n.2 apr-jun. 2018 p.210-231
The influence of customer value on word of mouth: a study of the financial services company in Brazil
About the Authors:
1. Sandro Bonfim da Costa, Professional Masters in Business Administration, Insper, Brazil. E-mail: Sandro_bonfim@hotmail.com
ORCID
0000-0002-2163-3427
2. Danny Pimentel Claro, PhD in Business, Wageningen University, Netherlands. E-mail: dannypc@insper.edu.br
ORCID
0000-0002-8387-0938
3. Adriana Bruscato Bortoluzzo, Doctor of Statistics, Universidade de São Paulo, Brazil. E-mail: adrianab@insper.edu.br
ORCID
0000-0003-2872-031X
Contribution of each author:
Contribution Sandro Bonfim da Costa
Danny Pimentel Claro
Adriana Bruscato Bortoluzzo
1. Definition of research problem √ √
2. Development of hypotheses or research questions (empirical
studies) √ √
3. Development of theoretical propositions (theoretical Work) √ √
4. Theoretical foundation/Literature review √ √
5. Definition of methodological procedures √ √ √
6. Data collection √
7. Statistical analysis √ √ √
8. Analysis and interpretation of data √ √ √
9. Critical revision of the manuscript √ √ √