UNIVERSIDADE DE LISBOA
FACULDADE DE CIÊNCIAS
DEPARTAMENTO DE BIOLOGIA VEGETAL
Analysis of the contribution of alternative splicing to glioma
subtype definition
Maria Teresa Proença Mendes Maia
Mestrado em Bioinformática e Biologia Computacional
Especialização em Biologia Computacional
Dissertação orientada por:
Nuno Morais, Instituto de Medicina Molecular, Faculdade de Medicina da Universidade de Lisboa
Lisete Sousa, Faculdade de Ciências, Universidade de Lisboa
i
R
ESUMO
Gliomas são tumores cerebrais que têm origem em dois tipos de células: os astrócitos e os ologodendrócitos, os quais formam uma estrutura de suporte para os neurónios. Os gliomas são responsáveis por cerca de 80 % dos casos malignos de tumor cerebral.
A classificação de gliomas fundou-se durante muito tempo em parâmetros histológicos, tais como o tipo histológico ou o estádio do tumor, uma medida do seu grau de malignidade, baseada na aparência e comportamento das células. A realização de estudos de larga escala fazendo uso das novas tecnologias ómicas, tem permitido melhorar os sistemas de classificação clássicos, através da identificação de assinaturas moleculares subjacentes aos diferentes subtipos tumorais. No caso de gliomas, uma publicação recente fez a descrição de um sistema de classificação robusto, baseado num painel de 1300 marcadores de metilação de DNA, aplicável a tumores dos estádios de 2 a 4, em que são definidos seis subtipos (LGm1 a LGm6) que formam grupos prognóstico bastante homogéneos (Ceccarelli et al., 2016).
O splicing é um mecanismo de processamento pós-transcricional através do qual certos segmentos de uma molécula de pre-RNA mensageiro (pre-mRNA): os intrões, são eliminados, resultando num mRNA maduro constituído por segmentos chamados exões que codifica para uma proteína (ou produto génico). É um processo químico levado a cabo por um complexo macromolecular modular, que se designa por spliceossoma. O splicing alternativo consiste na produção de mais do que um tipo de mRNA maduro a partir do mesmo gene através da retenção ou eliminação seletiva de um exão/intrão, dito alternativo ou regulado. Este processo contribui para a geração de diversidade funcional de produtos génicos e é regulado de forma específica em cada tecido e estádio de desenvolvimento, sendo que alterações aos seus padrões normais estão descritos como podendo promover ou apoiar o processo de tumorigénese.
A quantificação de splicing alternativo pode ser feita usando uma medida que se designa por index da percentagem de splicing ou PSI, e que corresponde à proporção de transcritos que incluem um exão regulado em relação ao total de transcritos de um gene.
O presente projeto de tese visa analisar a contribuição da regulação de splicing alternativo para a definição da classificação dos gliomas de estádios 2 a 4, tendo como objeto de estudo o conjunto de dados de uma coorte de 674 casos de glioma depositado no portal TCGA (The Cancer Genome Atlas). Por forma a avaliar a existência de uma assinatura molecular própria ou associada aos subtipos de glioma estabelecidos, utilizou-se análise multivariada dos dados de quantificação de splicing alternativo, mas também de expressão génica. Utilizando análise de componentes principais (PCA), o
splicing alternativo mostrou capturar diversidade biológica de forma muito semelhante à expressão
génica. A componente principal associada aos dois níveis de dados transcriptómicos de maior relevância representou um gradiente de malignidade tumoral. O splicing alternativo demonstrou ser informativo relativamente à distinção dos subtipos LGm2, LGm3 e LGm4/5, enquanto os subtipos LGm1 e LGm6 revelaram uma grande heterogeneidade.
Análise de expressão génica e splicing alternativo diferencial ao longo dos subtipos LGm permitiu identificar um grupo de 5970 genes e 1762 eventos de splicing associados à definição desses subtipos. De forma importante, 183 genes e 105 eventos de splicing com regulação diferencial afetam genes cujas mutações têm implicação causal em cancro demonstrada. Por fim, 41 fatores de
ii
IGF2BP2 e IGF2BP3 apresentando os resultados mais significativos, nomeadamente uma expressão elevada em LGm1,4,5 e 6, os subtipos associado a um pior prognóstico.
Análise de enriquecimento funcional realizada com a informação de regulação diferencial da expressão génica e splicing alternativo entre subtipos LGm revelou funções bilógicas distintas por cada processo. Enquanto os genes com alterações de expressão entre grupos de metilação de DNA se relacionaram com funções como resposta imune, proliferação, sobrevivência e adesão celulares, genes tendo o seu splicing alternativo alterado involveram sobretudo o processamento de RNA, síntese proteica e também apoptose.
O valor do splicing alternativo e da expressão génica para o prognóstico em gliomas foi avaliado usado modelos de regressão de Cox para a sobrevida do paciente em função de diferentes fatores de risco. Um teste inicial sobre a capacidade da componente principal associada à malignidade para explicar a evolução do tempo de sobrevida do doente confirmou a superioridade desta dimensão dos dados de transcriptómica relativamente à variável estádio do tumor no que diz respeito a essa previsão. Subsequente análise de eventos de splicing e genes individuais como preditores de prognóstico resultou na descoberta de tantos quantos 11794 genes e 6657 eventos de splicing. Porém, apenas um gene e dois eventos de splicing alternativo foram capazes de melhorar a estimativa da evolução do doente relativamente a um modelo já contendo subtipos LGm, estádio do tumor e idade do doente, três covariáveis relevantes descritas na literatura. Os dois eventos em questão apresentaram distribuições de PSIs com variãncia muito baixa, pelo que constituiriam marcadores de prognóstico de pouca qualidade, além de não parecerem ter um interesse intrínseco já que não representam a possibilidade de geração de uma transição de uma isoforma dominante para outra. Finalmente, marcadores especificamente associados aos grupos LGm foram identificados a partir da interseção do conjunto que apresentou valor prognóstico independente do estádio do tumor e da idade do doente com o conjunto com regulação diferencial entre os seis subtipos. Desta análise resultou um total de 337 eventos de splicing alternativo, 50 dos quais acrescentando informação prognóstica relativamente aos dados de expressão génica, e também 20 genes de fatores de splicing. De entre estes últimos, seis codificavam para proteínas que se ligam ao RNA (RBPs) com motivos de ligação conhecidos, pelo que o seu potencial papel regulatório foi investigado.
Uma metodologia para a descoberta de mecanismos de regulação de splicing alternativo em trans foi implementada. Concretamente, um algoritmo para a geração de mapas de regulação de splicing específicos de cada RBP foi usado, tendo como objetivo determinar as regiões regulatórias para fomento ou silenciamento do splicing de exões alternativos. A identificação da posição relativa dos alvos de regulação de cada RBP baseou-se na deteção dos eventos de splicing cujas percentagens de inclusão do exão alternativo se correlacionavam com a abundância da RBP e que efetivamente continham motivos de ligação para essa RBP nas regiões vizinhas do exão regulado. Este método foi validado para o fator de splicing bem estudado PTBP1, utilizando tanto um conjunto de dados provindo de tecidos saudáveis como com o da cohorte de glioma estudada. No entanto, a aplicação do mesmo procedimento a quatro dos seis fatores de splicing potencialmente associados com as alterações de splicing entre subtipos de glioma resultou em mapas de splicing de RNA inconsistentes entre os dois conjuntos de dados. Medidas para a melhoria desta metodologia foram identificadas e poderão ser aplicadas futuramente por forma a poder concluir sobre a relevância destas proteínas em glioma.
Este estudo permitiu identificar um número de eventos de splicing alternativo e genes expressos, nomeadamente, genes de fatores de splicing, que apresentam comportamento diferencial em termos de malignidade e subtipo epigenático de glioma e que poderão ter valor diagnóstico e
iii
terapêutico interessante. Adicionalmente, um novo método computacional para descoberta de mecanismos de regulação de splicing alternativo foi implementado, tendo permitido propor um mecanismo de ação para o fator de splicing relevante em glioma KHDRBS2.
v
A
BSTRACT
Gliomas are brain primary tumours that originate from two kinds of glial cells: astrocytes and oligodendrocytes, which make up a supportive structure for neurons.
Classification of gliomas has for long relied on histological parameters, like cell type composition and grade, a measurement of the degree of malignancy of a tumour based on cell appearance and behaviour. Large scale studies employing the new omics technologies have allowed to improve classic classification systems, through the identification of molecular signatures behind each tumour subtype. In the case of gliomas, a recent publication described a robust classification system based on DNA-methylation profiling, applicable to tumours from grades 2 to 4 and defining six subtypes (LGm1 to LGm6) forming quite homogeneous prognostic groups (Ceccarelli et al., 2016).
Alternative splicing is a post-transcriptional mechanism of regulation of gene expression that contributes to generate functional diversity of gene products through the selective elimination of certain segments of pre-messenger RNA (pre-mRNA) molecules. Alternative splicing is regulated in a tissue and developmental specific way and alterations to its normal patterns have been extensively reported to promote or help sustaining tumorigenesis.
The work presented here aimed at determining the contribution of alternative splicing to glioma subtype definition, having as a focus a cohort of 674 cases of glioma grades 2 to 4, coming from the Cancer Genome Atlas (TCGA) data portal.
Differential gene expression and differential splicing analyses across LGm subtypes allowed to identify a group of 5970 genes and 1762 events of alternative splicing whose regulation is associated with subtype definition. Importantly, among these differentially regulated markers, there were 41 splicing factor genes and 46 splicing factor gene-associated events of splicing.
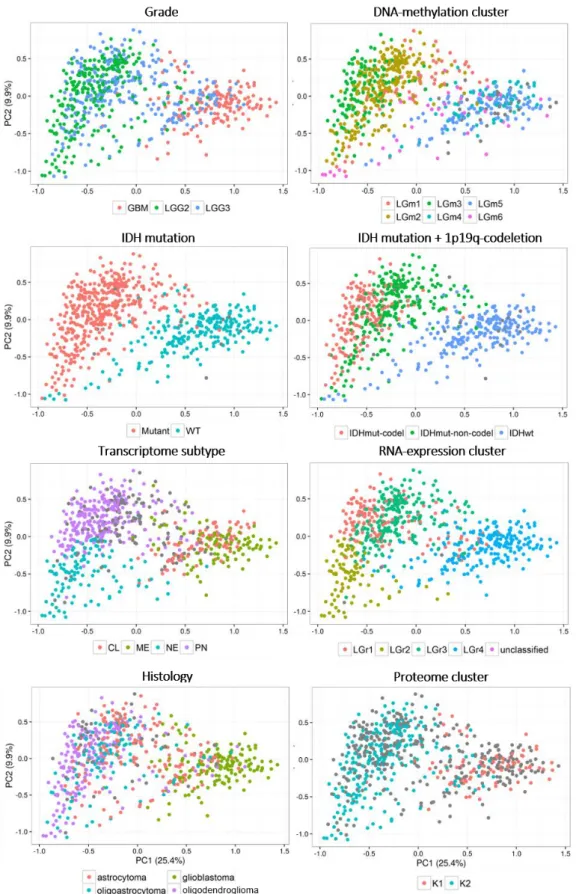
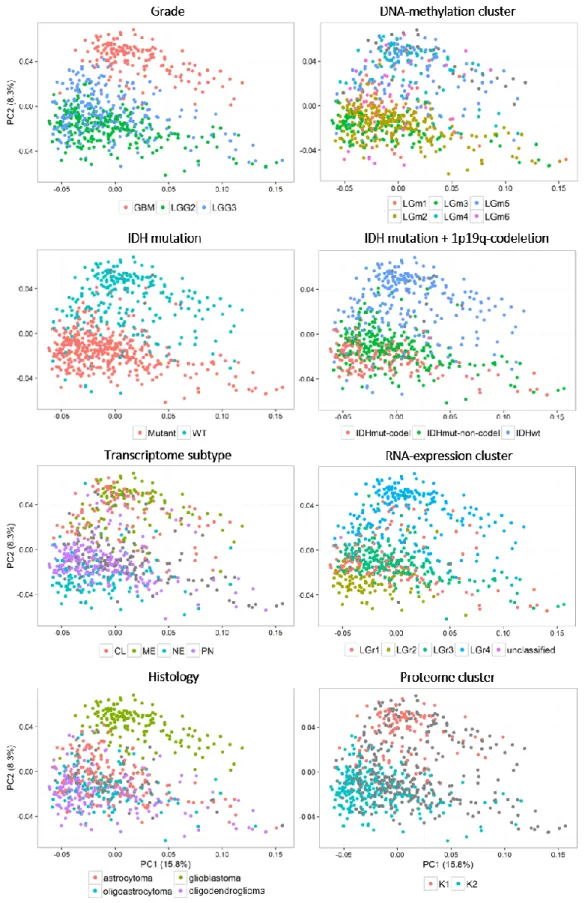
In order to enquire about the existence of particular molecular signatures in glioma, multivariate exploratory data analysis was performed on alternative splicing and also gene expression data. Alternative splicing showed to capture sample diversity in a way that was very similar to gene expression. The most revealing principal component associated with both transcriptomic data levels presented a gradient of tumour malignancy. As for the ability of alternative splicing to distinguish subtypes, it could partially separate LGm2, LGm3 and LGm4/5 groups, while LGm1 and LGm6 revealed a high heterogeneity.
The value of alternative splicing and gene expression in glioma prognosis was evaluated using Cox regression models for patient’s overall survival outcome as a function of different predictors. An initial test on the ability of the malignancy associated principle component to explain patient outcome strikingly confirmed the superiority of this dimension of transcriptomic data to make this prediction in relation to tumour grade. In turn, analysis of individual alternative splicing events and expressed genes as prognosis predictors resulted in as many as 11794 genes and 6657 events of splicing. However, only one gene and two alternative splicing events were able to improve patient survival outcome estimation relative to a model that already accounted for LGm subtype, tumour grade and patient age, three relevant covariates described in the literature. Finally, in terms of prognostic markers specifically associated with LGm groups, a total of 337 splicing events were found, 50 of which adding information in relation to gene expression, and also 20 splicing factor genes. From these latter, six encoded RNA-binding proteins (RBPs) with known RNA-binding motifs and their potential regulatory role was investigated.
vi
A methodology for the discovery of mechanisms of alternative splicing regulation in trans was implemented. Specifically, an algorithm to generate maps of splicing regulation specific of each RBP was used, aimed at determining regulatory regions for their enhancing or silencing role in splicing of alternative exons. This method was validated for the known splicing factor PTBP1, both using an RNA-seq dataset from healthy tissues and the studied glioma one. However, application of the same procedure to four of the six splicing factors potentially associated with alternative splicing changes across glioma subtypes resulted in RNA splicing maps that were inconsistent between the two datasets. Improvements to the methodology used were identified and may be applied in the future so that stronger conclusions about the relevance of these proteins in glioma can be taken.
This study allowed to outline a number of alternative splicing events and expressed genes, namely splicing factor genes, that behave differently according to glioma malignancy and epigenetic groups and that may be of interesting diagnostic and therapeutic value. Also, a novel computational method for discovery of mechanisms of regulation of alternative splicing was implemented and allowed to proposal a mechanism of action for the glioma-relevant splicing factor KHDRBS2.
vii
A
CKNOWLEDGMENTS
I would like to start by thanking Nuno for welcoming me to his lab to accomplish this final, very important part of my training as a bioinformatician. You have been a great supervisor, having made a very important contribution to this project, taught me a whole lot in statistics and quantitative methodologies, and the way to use these to tackle biological questions. Thank you as well for your contribution to this manuscript.
I would like to thank professor Lisete Sousa for accepting to co-supervise me and for always being available to offer guidance throughout this work. Your help has been precious. Thank you very much for taking so much of your time to help in the preparation of this manuscript.
I would like to thank in advance the members of the jury of my thesis defence for reading carefully this work and participating of my getting this degree.
I would like to thank my colleagues Marie, Lina, Mariana, Bárbara, Nuno, Carolina, Juan and Bernardo, who make up this fresh, creative, talented and very friendly Computational Biology team. I have enjoyed very much meeting you all and, believe me, to share the workspace, even if I ended up seating on the other side of the room. I always enjoyed our open discussions, exchange of thoughts about whatever subject and mutual support. I learned difficult concepts and interesting tricks with each of you.
I would like to thank Cláudia Faria for her invaluable insights, specially while kick-starting this project in brain tumourigenesis.
I would like to thank Ana Rita Grosso for her availability to give me guidance in some moments and for always being ready to share her knowledge with us.
I would like to thank all the people at IMM. It has been a great environment to work.
I would like to thank my friends, of whom I’m very proud and that have made such great companions along the years.
Thank you Florent, for sharing your life with me. Thank you for all your support. Your help in making me get through doubts every now and then while writing this thesis was also precious.
A big thank you to my parents and brother, who have always been so encouraging and supportive, including of my career decisions and to whom I owe very much. Thank you for being there.
ix
T
ABLE OF
C
ONTENTS
Resumo ... i Abstract ... v Acknowledgments ... vii List of Figures ... xiList of Tables ... xiii
List of Abbreviations ...xiv
1. Introduction ... 1
1.1 Glioma ... 1
1.1.1 The most pervasive CNS primary tumour ... 1
1.1.2 Cells of origin ... 2
1.1.3 Classification of Glioma ... 2
1.2 Alternative Splicing ... 5
1.2.1 Alternative Splicing and Its Regulation ... 5
1.2.2 Alternative Splicing and Its Different Forms ... 7
1.2.3 Quantification of Alternative Splicing ... 8
1.3 Alternative Splicing in Glioma ... 10
Methods ... 13
2.1 Data sets... 13
2.2 Analysis of alternative splicing data ... 14
2.2.1 PSI data matrix generation... 14
2.2.2 Preparation of working PSI matrices... 15
2.2.3 Differential alternative splicing analysis ... 15
2.3 Analysis of gene expression data ... 15
2.3.1 Preparation of working gene expression matrices ... 16
2.3.2 Differential gene expression analysis ... 16
2.4 Exploratory data analysis ... 17
2.4.1 Alternative splicing vs Gene expression correlation analysis ... 17
2.4.2 PSI variances ... 17
2.4.3 Principal Component Analysis ... 17
2.5 Functional enrichment analysis ... 18
2.6 Supervised sample classification ... 18
2.7 Survival analysis ... 19
2.7.1 Kaplan-Meier curves ... 19
x
2.7.3 Venn diagrams ... 20
2.8 study of alternative splicing regulation in trans ... 20
2.8.1 Correlations between RBP gene expression and exon inclusion levels ... 20
2.8.2 Mapping of RBP binding motifs along the genome using FIMO ... 20
2.8.3 Quantification of putative alternative splicing event targets for different RBPs ... 21
2.8.4 Definition of regulatory regions for RNA splicing map generation ... 21
2.8.5 Determination of the best correlation test and motif binding threshold parameters for generating each RNA splicing map ... 21
Results ... 23
3.1 Signatures of alternative splicing in glioma ... 23
3.1.1 Determination of the level of dependence of alternative splicing on the expression of cognate genes ... 23
3.1.2 Assessment of the extent of alternative splicing regulation/dysregulation in glioma . 24 3.1.3 A portrait of gene expression and alternative splicing in glioma ... 27
3.1.4 Functional Analysis of the gene expression and alternative splicing malignancy axes 36 3.1.5 Analysis of differential gene expression across DNA-methylation cluster subtypes .... 38
3.1.6 Analysis of differential splicing across DNA-methylation cluster subtypes ... 41
3.1.7 Functional Analysis of gene expression and alternative splicing changes in LGm subtypes 47 3.2 Investigation of the value of alternative splicing in glioma prognosis ... 50
3.2.1 Prognostic value of gene expression and alternative splicing malignancy axes ... 50
3.2.2 Prognostic value of individual genes and AS events ... 52
3.2.3 Identification of potential trans-acting regulators of splicing in different DNA-methylation subtypes ... 57
3.2.4 Identification of DNA-methylation subtype associated prognostic alternative splicing events 58 3.3 Discovery of alternative splicing regulation mechanisms in glioma ... 60
3.3.1 On the likeliness of glioma prognostic alternative splicing being mediated in trans ... 60
3.3.2 RNA splicing maps ... 63
Discussion ... 71
References ... 79
xi
L
IST OF
F
IGURES
Figure 1.1 – Distribution of Primary Brain and CNS Tumours by behaviour --- 1
Figure 1.2 – Defining features of pan-Glioma classification proposed in (Ceccarelli et al., 2016) and its relation with other established glioma classifications and clinical parameters. --- 4
Figure 1.3 – Splicing reaction and splicing regulation. --- 7
Figure 1.4 – Alternative splicing event types. --- 8
Figure 2.1 – Definition of regulatory regions for a general event of exon-skipping (SE). --- 21
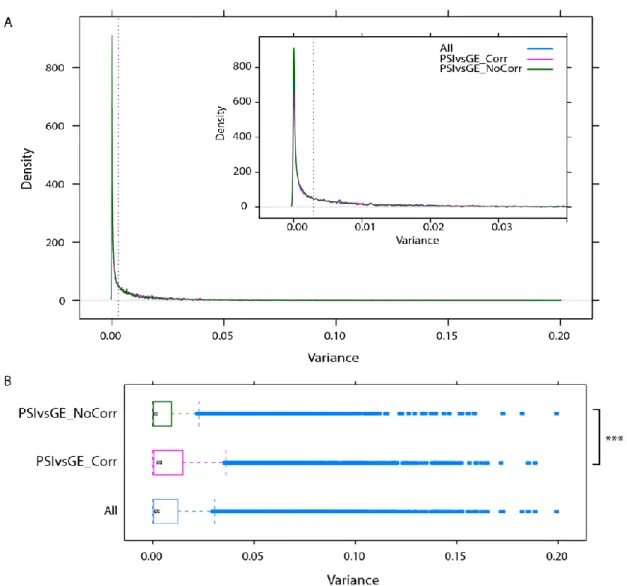
Figure 3.1 – Correlation between PSIs of AS events and levels of gene expression of cognate genes 24 Figure 3.2 – Variance of AS events measurements in the TCGA glioma cohort. --- 25
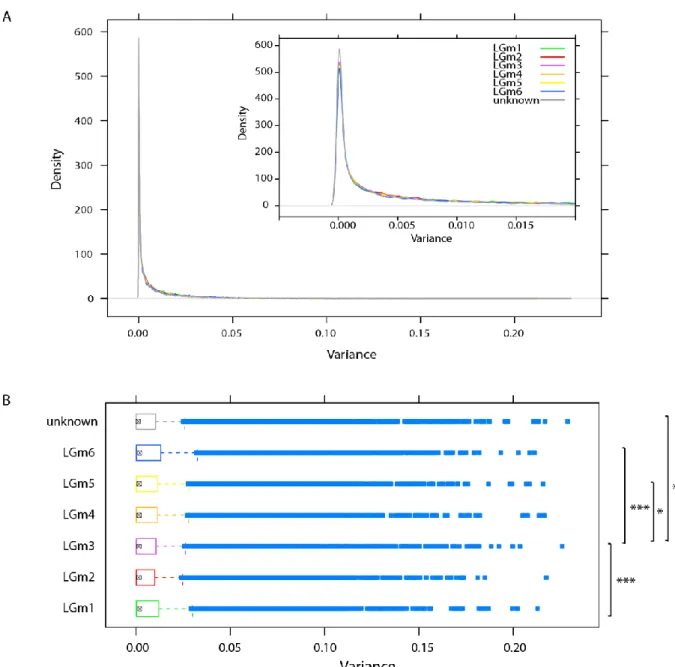
Figure 3.3 – Variance of AS events measurements in the TCGA glioma cohort. --- 26
Figure 3.4 – Variance of AS events measurements in the TCGA glioma cohort. --- 27
Figure 3.5 – Principal Component Analysis scatter plots of gene expression in glioma. --- 28
Figure 3.6 – Principal Component Analysis scatter plots of PSIs of the alternative splicing events measured in glioma. --- 29
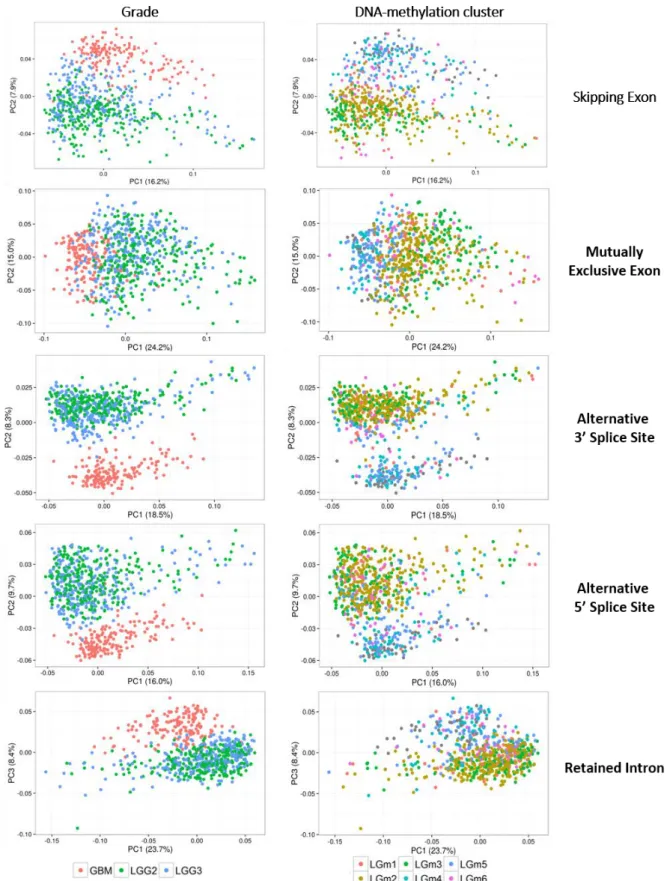
Figure 3.7 – Principal Component Analysis scatter plots of PSIs of the alternative splicing event types measured in glioma. --- 30
Figure 3.8 – Principal Component Analysis plots made on all measured AS events. --- 34
Figure 3.9 - Principal Component Analysis plots made on all measured AS events. --- 35
Figure 3.10 –Spearman’s correlation coefficients for all pairwise comparisons of samples scores of malignancy-reflecting principal components --- 36
Figure 3.11 – Functional analysis of gene expression malignancy-reflecting principal component. --- 37
Figure 3.12 – Alternative splicing events and transcribed genes with higher loadings across the malignancy axis affect different sets of genes.--- 38
Figure 3.13 - Differential expression statistics and relative expression levels of known splicing factor genes across glioma DNA-methylation subtypes. Genes that code for proteins with known RNA-binding motifs are shown in bold. --- 40
Figure 3.14 – PSI distributions for 12 alternative splicing events that appear differentially expressed across DNA-methylation subtypes --- 41
Figure 3.15 – PSI distributions of six AS events that just the criteria to be considered differentially spliced between glioma DNA-methylation clusters. --- 42
Figure 3.16 – Plots for cross-validation of two supervised classifiers produced with PAM algorithm 43 Figure 3.17 - Variance and Kruskal Wallis FDR of alternative splicing events that vary across DNA-methylation clusters. --- 44
Figure 3.18 – PSI distributions of four alternative splicing events that affect splicing factor genes. -- 46
Figure 3.19 – Biological pathways and cellular processes enriched among differentially spliced and differentially expressed genes. --- 48
Figure 3.20 – Biological pathways and cellular processes enriched among differentially spliced and differentially expressed genes. --- 49
Figure 3.21 – Survival curves for different WHO grade gliomas. . --- 50
Figure 3.22 – Distribution of concordance indexes of Cox hazards-models for individual genes and alternative splicing events with prognostic value at Cox adjusted p-value below 0.01. --- 52
Figure 3.23 – Distribution of concordance indexes of Cox proportional-hazards models for individual genes and alternative splicing events with prognostic value at Cox adjusted p-value below 0.01. ---- 56
Figure 3.24 – Prognostic splicing factors associated with LGm subtype. --- 58
Figure 3.25 - Relations between alternative splicing prognostic markers and alternatively spliced and differentially expressed genes. --- 59
xii
Figure 3.26 – Principal Component Analysis plots made on 337 prognostic AS events associated with LGm subtypes. --- 59 Figure 3.27 – Concordance between glioma TCGA and GTEx splicing factor expression to alternative splicing events PSIs correlations. --- 61 Figure 3.28 – Evidence for alternative splicing regulation by four RBPs. --- 62 Figure 3.29 – PCBP3 RNA-binding maps for the general exon-skipping (SE) alternative splicing event. --- 65 Figure 3.30 – KHDRBS2 RNA-binding maps for the general exon-skipping (SE) alternative splicing event. --- 67 Figure 3.31 – IGF2BP2 RNA-binding maps for the general skipped exon (SE) alternative splicing event. --- 68
xiii
L
IST OF
T
ABLES
Table 2.1 – Nomenclature code used for the different sample types of diffuse gliomas of the GBM
and LGG TCGA cohorts. --- 13
Table 2.2 – Clinical and Molecular Characteristics of the TCGA Sample Set. --- 14
Table 2.3 – Dimensions of PSI tables after filtering. --- 15
Table 2.4 – Description of the main Cox proportional-hazards models derived. --- 20
Table 3.1 – Number and role in cancer of genes and AS events differentially expressed across glioma DNA-methylation subtypes. --- 45
Table 3.2 – Cox proportional-hazards models for malignancy-reflecting variables. --- 51
Table 3.3 – Cox proportional hazards models for prognostic maker genes, after adjustment for DNA-methylation cluster, grade and age. --- 53
Table 3.4 – Cox proportional hazards models for prognostic maker alternative splicing events, after adjustment for gene expression, DNA-methylation cluster, grade and age. --- 54
xiv
L
IST OF
A
BBREVIATIONS
A3 – Alternative 3’ splice site A5 – Alternative 5’ splice site AF – Alternative first exon AL – Alternative last exon AS – Alternative Splicing bp – base pair
CRAN - The Comprehensive R Archive Network DAS – Differential Alternative Splicing
DGE – Differential Gene Expression GE – Gene expression
GTEx – Genotype-Tissue Expression program
KEGG – Kyoto Encyclopaedia of Genes and Genomes mRNA – messenger RNA
MX – Mutually exclusive exons PC – principal component
PCR – Polymerase Chain Reaction RI – Retained Intron
RPKM – Reads Per Kilobase per Million mapped reads SE – Skipping Exon
TCGA - The Cancer Genome Atlas projec
1
1. I
NTRODUCTION
In this thesis, the alternative splicing patterns of glioma, the central-nervous system (CNS) glial-cell derived tumour type, will be studied. The introductory text that follows will cover (1) overall background related to this type of tumour, and its classification system, (2) the theory behind alternative splicing mRNA processing, as well as the methodological approaches taken to be able to study splicing transcriptional output and, finally, (3) an overview over what is known in terms of the role of alternative splicing in gliomagenesis.
1.1 G
LIOMA1.1.1 The most pervasive CNS primary tumour
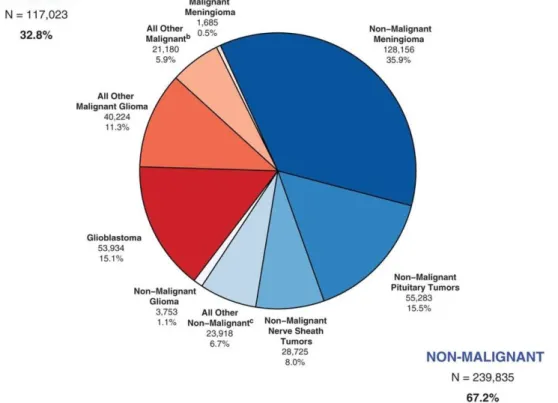
Glioma, without being the most frequent primary tumour affecting the brain, does account for about 80 % of the malignant cases. Indeed, data from the 2008-2012 report from the Central Brain Tumour Registry of the United States estimate that, from the 32.8 % of malignant cases, 15.1 % are glioblastomas, the most aggressive glioma type, and 11.3 % correspond to other malignant gliomas (Figure 1.1) (Ostrom et al., 2014). The remaining 1.1 % of gliomas are benign, i.e. have a slow pace, localized growth, which makes them not life threatening once diagnosed.
Figure 1.1 – Distribution of Primary Brain and CNS Tumours by behaviour (N = 356,858), CBTRUS 2008-2012 Statistical Report (Ostrom et al., 2014) .
2 1.1.2 Cells of origin
Cells from the glia make up a supportive structure for neurons in the brain. They can be of four essential types: astrocytes, oligodendrocytes, microglia, and ependymal cells (Snell, 2010). Astrocytes are at least as numerous as neurons and responsible for controlling ion levels and the pH at the neurological synapse, for providing nutrients to neurons (e.g. glucose and metabolic intermediates), to clear out neurotransmitters or other neuron-secreted compounds from the extracellular space, and for helping define the blood-brain barrier by means of interaction with blood-vessel endothelial cells (Nedergaard, Ransom, & Goldman, 2016). Oligodendrocytes are cells that electrically insulate neuronal processes by wrapping them around myelin sheets. These two latter cell types are also the ones that lead to glioma formation. In fact, gliomas appear as cell masses of astrocyte-like, oligodendrocyte-like or a mixture of astrocyte- and oligodendrocyte-like cells. Interestingly, these two-cell types originate from the same population of cells that also give rise to neurons, which may be called the neuroglial progenitors, and are responsible for neural/glial tissue regeneration (Modrek, Bayin, & Placantonakis, 2014).
As for the other glial cell types, which do not share a common developmental origin with the neuroglial cells, microglia are monocyte-like cells that can act like macrophages and have a neuro-protective role and ependymal cells are multi-ciliated cells that line up the brain ventricles and propel the cerebrospinal fluid.
1.1.3 Classification of Glioma
The definition of glioma subtypes is still an ongoing process, which has gained much improvement in the last years, with the contribution of studies that integrate histological and high-throughput molecular data to then relate it with patient survival data. Glioblastoma has been subjected to more thorough research before lower-grade gliomas (LGG) did and the description that follows reflects this chronological order in the evolution of glioma classifiers.
1.1.3.1 The Cancer Genome Atlas as a privileged source for cancer research
Cancer, being a complex disease, will arise as a result of genetic background and environmental exposures that are particular to the individual carrying it. As such, research on its aetiology will be complicated by the presence of “passenger” mutations or other cellular alterations carried by the individual, but that do not contribute to the development of the disease. This creates the need to carry out cancer studies in as large cohorts as possible and preferably to get access to clinical parameters that will allow not only to relate subtypes of the disease with particular cancer patient strata but also to establish a direct link between a molecular signature and the progression of the disease within an individual clinical case.
The Cancer Genome Atlas (TCGA) is a project created in 2005, as a collaboration between the US National Cancer Institute (NCI) and the US National Human Genome Research Institute (NHGRI), with the aim to create a very large source of molecular, histological and clinical data relative to more than 11000 cancer cases and 35 tumour types, all put together and made available for public use (“TCGA Home - TCGA - National Cancer Institute - Confluence Wiki,” 2016). The project had a very important impact on cancer research done worldwide, due to a very effective spread of the information. To start with, the existence of a network of researchers more directly implicated in the development of the project guaranteed the publication of the main findings gathered around multi-platform data analysis from each cancer cohort. Then, a free-access data portal was made available to the scientific
3
community (“The Cancer Genome Atlas - Data Portal,” 2016), with releases occurring even before publication. Access to this large amount of data, collected and analysed according to high quality standards, can be done at different levels or tiers, with tier 3 corresponding to access to clinical and processed data files, while tier 1, controlled access, includes access to all raw sequencing data (e.g. exome-sequencing, RNA-sequencing, bisulfite sequencing) and also additional information on patients’ genetic variants. Finally, cancer genomics online portals like cBioPortal (“cBioPortal for Cancer Genomics,” 2016) or COSMIC (“COSMIC: Catalogue of Somatic Mutations in Cancer - Home Page,” 2016) have been created or largely expanded through incorporation of TCGA data into their databases, which constitutes a very useful tool to be used by basic and applied researchers or by geneticists.
1.1.3.2 Glioma classification systems
Glioblastoma multiforme (GBM), a WHO grade IV tumour (Louis et al., 2007), is the most aggressive glioma type known, characterized by a high capacity to invade the surrounding tissue, high proliferation rates, abundant vascularization and a large amount of necrotic cells. It has also been characterized by the presence of numerous copy-number variants (CNV), mostly amplification of
EGFR, PDGFRA, CDK4, MDM2 and MDM4, amplification and or mutation of class II
phosphatidylinositol 3-kinase (PI3K) genes, deletion or mutation of PTEN, NF1, RB1, CDKN2A and
CDKN2B genes, and deletion of chromosome arm 10q (Brennan et al., 2013; Network, 2008). The
alterations described affect three main signalling pathways relevant for cancer progression: the growth factor receptor tyrosine kinase (RTK) pathway, the p53 apoptotic pathway and the retinoblastoma (Rb) cell cycle progression pathway. In 2010, another study created a GBM subtype classifier, which consisted of four groups of tumours: Proneural, Neural, Classical and Mesenchymal, carrying mutually exclusive combinations of the previously mentioned RTK-related genomic abnormalities and, importantly, alterations in gene expression coherent with those mutations (Verhaak et al., 2010). More specifically, the Classical subtype was associated with EGFR overexpression, Mesenchymal subtype with NF1 downregulation and the Proneural subtype with both PDGFRA overexpression and IDH1 downregulation. The four groups described were found to correspond to similar patient prognosis. However, an interesting observation in terms of the usefulness of this GBM classifier for clinical management of patients was made: patients carrying a Classical subtype GBM were much more responsive to aggressive chemo- and radiotherapy, having improved survival times when treated, than patients carrying the Proneural subtype, which were almost unresponsive to treatment.
A new picture about the ability to define strata of patients with clearly different prognosis emerged from studies where DNA methylation profiling was carried out. Noushmehr and collaborators found that GBM and lower grade glioma (LGG) patients carrying a mutation in the IDH1 gene had a high level of DNA methylation of their gene promoters in relation to patients carrying unaffected, wild-type copies of IDH1 (Noushmehr et al., 2010). They termed this phenowild-type of high or low CpG island methylation as glioma-CpG island methylator phenotype, or G-CIMP, and found it to be more prevalent among LGG cases, in association with better prognosis.
Yet another two subtypes of GBM tumour involving epigenetic alterations have been identified (Sturm et al., 2012), which are found only in paediatric cases, each one dealing with a mutation affecting amino acids K27 or G34 of the histone H3.3.
As for LGG (grades II and III), genomic sequencing and CNV analysis has also allowed to get a good overall picture of their associated genetic lesions. One of the works that better made this description
4
is the work of Suzuki et al. (Suzuki et al., 2015), where three main types of grade II and III gliomas are defined and which brought as main findings, on the one hand, the presence of at least one CNV in roughly all tumour samples, the most frequent of which being a co-deletion of chromosome arms 1p and 19q, and, on the other hand, frequent mutations in the following genes: IDH1, TERT promoter,
TP53, ATRX, CIC and FUBP1, with particular note going to IDH1 gene, which was estimated to be
mutated in 75 % of grade II and III gliomas. The three types of LGG consisted then of: type I, carrying mutated IDH, a 1p/19q codeletion and TERT promoter mutation, with or without CIC and FUBP1 mutations; type II LGG were also IDH-mutant, TP53-mutant and frequently carried ATRX mutations, resulting in a lower overall survival of patients in relation to type I tumours; type III LGG patients, which were the group found to have worst prognosis, closer to the one of GBM patients (29.1 % rate of 5-year survival), carried a normal copy of IDH1 and also mutations similar to the ones found in GBM, affecting e.g. EGFR, PDGFRA, PTEN, RB1 genes.
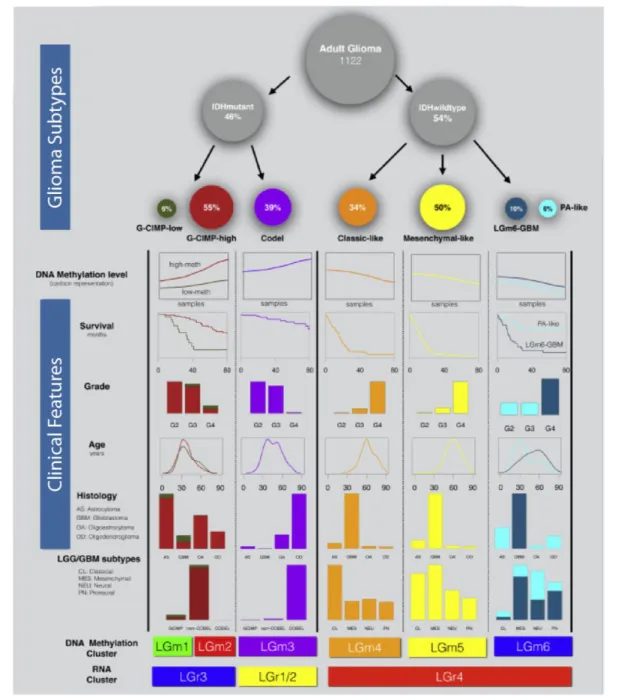
Figure 1.2 – Defining features of pan-Glioma classification proposed in (Ceccarelli et al., 2016) and its relation with other established glioma classifications and clinical parameters. Image adapted from (Ceccarelli et al., 2016).
5
Because there was a superposition of genomic lesions among GBM and LGG, it became clear the need to create a pan-glioma classifier. This was accomplished already this year, by Ceccarelli and collaborators (Ceccarelli et al., 2016), who, based on DNA-methylation profiling, were able to, with one single molecular analysis platform (bisulfide sequencing), build a pan-glioma classifier that is able to identify six main groups: LGm1 to LGm6 termed LGm DNA methylation clusters (Figure 1.2). Moreover, the authors show that this epigenetic molecular signature has prognostic value. Indeed, the authors show, using the same cohort of patients, that the power to predict patient outcome using this new DNA methylation classification, together with tumour grade and age of the patient, is superior to the one of any other classifier previously described, alone or when combined with the same two clinical variables.
A new classification of tumours affecting the CNS has been recently published by the World Health Organization (WHO), which makes use for the first time of molecular information associated to specimens, together with histological information (see Table S1 for a summary of the novel glioma classification) (Louis et al., 2016).
1.2 A
LTERNATIVES
PLICINGSplicing is one of the mechanisms of messenger RNA (mRNA) processing whereby pieces of the transcribed molecule are selectively eliminated. As a result, splicing plays fundamental roles in dictating the stability of the mRNA species produced and, most of all, in deciding which protein will be generated from the mature mRNA. In fact, splicing is known to lead, within the same organism and even in the same cell, to the production of distinct transcripts and corresponding protein products, in a process that is regulated in order to meet the cell’s needs in terms of protein composition. This concurrent generation of diverse transcript species from one gene through splicing is called alternative splicing (AS), which will be described in the following sections.
1.2.1 Alternative Splicing and Its Regulation
Splicing is a chemical reaction by which segments of the pre-mRNA that are not to be incorporated in the mature RNA, called introns, are extracted, while the remaining mRNA segments, called exons, are joined to remake a continuous RNA strand (Figure 1.3A). Each of these reactions can be called an event of splicing. It occurs through two trans-esterification reactions, the first one involving the 3’ hydroxyl group of an adenosine residue in the intron, called the branch point, and the phosphate of the guanosine residue located at the starting position of the intron: the 5’ splice site. This reaction originates the formation of a loop-like structure (lariat). A second similar reaction follows that consists on the interaction of the 3’ hydroxyl group of the exon that was displaced with the phosphate group of the 3’splice site, a reaction that results in the junction of the two exons and the release of the lariat segment, which will be targeted for degradation.
Splicing is carried out by a modular protein complex, called the spliceosome, whose composition changes dynamically and, most of all, whose catalytic protein subunits responsible for carrying out the splicing reaction only assemble after the exon boundaries, the 5’ splice site and 3’ splice site, have been located. The recognition of the 5’ and 3’ splice sites is done by the U1 and U2 small nuclear ribonucleoproteins (snRNPs), respectively, which bind those sites by RNA base-pairing. Because the sequences of the splice sites are not always the same (Figure 1.3B), these are bound as
6
efficiently as their sequence affinity for the U1/U2 snRNPs, a condition that turns them into strong or weak splice sites.
Alternative splicing occurs in all eukaryotic cells, and is known to be abundant in organisms like plants and in human, whose 90 % of genes enable the creation of more than one transcript and protein isoform each (Pan, Shai, Lee, Frey, & Blencowe, 2008; Yang et al., 2016).
This process occurs in a tissue and developmental stage specifically regulated way and relies on the frequency with which the U1/U2 snRNPs “find” the alternative exon, that is, an exon that, unlike constitutive exons, is not always included in the mature transcripts from that particular gene. Exon recognition is influenced by different factors, including RNA polymerase II transcriptional elongation rate, which is now established to be anti-correlated with splicing efficiency (de la Mata et al., 2003; Dujardin et al., 2014; Moehle, Braberg, Krogan, & Guthrie, 2014).
In addition, exon recognition, and thus splicing regulation, is carried out by cis elements, i.e. regulatory sequences located in the vicinity of the alternative exon, and by a group of trans acting regulators, which are proteins that alone or with interacting partners bind to the cis elements, to promote, or else to inhibit, the recruitment of the spliceosome machinery proteins to the alternative exon splice sites (Figure 1.3B). The cis elements are of four types: exonic splicing enhancers (ESEs), exonic splicing silencer (ESSs), intronic splicing enhancers (ISEs) and intronic splicing silencers (ISSs). The trans regulators are proteins that are classified as splicing factors and that may enter in the classification of RNA-binding proteins (RBPs) if they establish direct protein-RNA interactions. The two main families of alternative splicing trans regulators are the serine/arginine-rich proteins (SRs) and the heterogeneous nuclear ribonucleoproteins (hnRNPs). However, there are several dozens of splicing factors known, some of which are tissue-specific, whose targets events of alternative splicing have been uncovered. RBP-regulated alternative splicing events have been discovered through the study of transcript changes in gene knock-out models or RNA silencing experiments, but also by biochemical methods like cross-linking-immunoprecipitation sequencing, or CLIP-sequencing, which allow the transcriptome-wide detection of direct protein-RNA interactions. This is the case of proteins like NOVA, important during neural differentiation (Licatalosi et al., 2008), RBFOX1-3 and PTBP1, relevant during development and in adult tissues, like the brain or muscle (Y. I. Li, Sanchez-Pulido, Haerty, & Ponting, 2015)(Weyn-Vanhentenryck et al., 2014), or QK in myogenesis (Hall et al., 2013).
From these studies new ideas emerged about alternative splicing control. An important one is that alternative splicing is context dependent. Indeed, several examples showed that what determines if the splicing factor will have an activating or suppressive role on the decision to include an exon in the mature transcript is not necessarily the cis-element sequence, but rather the position where it stands (Figure 1.3C). As a result, it has now become an important goal for alternative splicing researchers to establish what is called an RNA-binding map for each RNA-binding splicing factor, which can be mainly accomplished by experimental designs that include CLIP-sequencing technology, but that has also been attempted in silico, namely through motif-enrichment approaches (Park, Jung, Rouchka, Tseng, & Xing, 2016; Paz, Kosti, Ares, Cline, & Mandel-Gutfreund, 2014). Importantly, this kind of studies have been helped by the publication of a list of RNA-binding motifs for a total of 204 RBP coding genes from 24 eukaryotic species generated by the work of Ray and collaborators (Ray et al., 2013), who through biochemical assays and computational analysis elucidated the combinations of 7-nucleotide spanning RNA nucleotides better suited for binding of each RBP.
7
Figure 1.3 – Splicing reaction and splicing regulation. (A) Two-step pre-mRNA splicing reaction or event of splicing. (B) Splice site choice is regulated through cis-acting splicing regulatory elements (SREs) and trans-acting splicing factors. Based on their relative locations and activities, SREs can be classified as exonic or intronic splicing enhancers and silencers (ESEs, ISEs, ESSs or ISSs). These sequences recruit splicing factors to promote or inhibit recognition of nearby splice sites. Common splicing factors include SR proteins and hnRNPs, which assist U2 and U1 snRNPs during spliceosomal assembly. (C) Characterized examples of context-dependent alternative splicing regulation by SREs and four splicing factors. B and C panels of this figure are adapted from (Matera & Wang, 2014).)
1.2.2 Alternative Splicing and Its Different Forms
Different types of alternative splicing events have been described, according to the relative position the included or excluded regulated exon has in relation to the competing splice sites and also the way it is annotated itself (Figure 1.4). The seven possible alternative splicing event types are: (1) skipped exon (SE), which involves an exon flanked as usual by two introns (a “cassette” exon); (2) mutually exclusive exons (MX), where a choice is made to retain either one of two “cassette” exons; (3) retained intron (RI), the possibility that the spliceosome reads-through an intron, thereby keeping it in the final transcript; (4) alternative 5’ splice site (A5), in which there is competition for spliceosome recruitment between two 5’ splice sites of an intron; (5) alternative 3’ splice site (A3), equivalent to the 5’ splice site case in which either of two competing 3’ splice sites will be used; (6) alternative first exon (AF) that involves the inclusion of one out of two concurrent first exons; and (7) alternative last exon (AL), related to the inclusion of one out of two concurrent last exons. The AF type of alternative splicing is usually not directly linked to spliceosome regulation, since the choice of
8
the first exon incorporation into a transcript is made through alternative transcription initiation sites.
1.2.3 Quantification of Alternative Splicing
Alternative splicing quantification can be done using as measure a relative ratio of the levels of transcripts that include a regulated exon over the levels of transcripts that do and do not include it. In this form, alternative splicing quantification assesses the rate of selection by the spliceosome of a pair of splice sites over an alternative pair.
Alternative splicing can be measured from relative abundances of transcript isoforms obtained through single gene transcripts PCR, or through high-throughput, multi-gene encompassing methodologies, like expression microarrays and RNA-sequencing. RNA-sequencing technology offers great advantages over nucleotide probe hybridization techniques because, by giving access to the actual mRNA sequence, it allows to distinguish very similar transcripts, including new ones, apart from easily providing accurate measurements of mRNA species abundance across a larger range of expression.
1.2.3.1 A note on next-generation sequencing transcriptomics
The designation next-generation sequencing refers to a group of technologies of nucleotide sequencing, namely of DNA, which, from millions of different DNA species (molecules) that are attached to a solid phase structure and physically compartmentalized, allow to follow this same number of sequencing reactions individually.
Figure 1.4 – Alternative splicing event types. White-and light rose-filled boxes represent alternative exons. InN the cases of A3 and A5 event types, the alternative white segment of the transcript forms a larger exon with the flanking exon fragment. Scheme is adapted from (Alamancos et al., 2014).
9
Next-generation RNA-sequencing (RNA-seq) is usually run on DNA molecules that have their complementary sequences, called complementary DNA or cDNA, and which are produced by an enzyme called reverse transcriptase that from the RNA molecule template synthesizes the corresponding DNA molecule. The initial step of an RNA-seq experiment thus consists of, from a population of total RNA or mRNA from a biological sample, produce an equivalent copy of cDNA molecules.
The most commonly used next generation sequencing technique, commercialized by the company IlluminaTM, is based on the sequencing by synthesis principle, and is going to be briefly described. It starts with a step of fragmentation of RNA molecules into pieces of similar sizes, under 1000 bp long, identifying all fragments from the sample with a nucleotide sequence that includes a sample barcode, oligonucleotide primer sequences and an adapter to promote the attachment of the DNA fragments to the solid state sequencing unit. This pool of DNA fragments coming from one sample is then amplified by PCR, after which it is called a sequencing library. This library is then hybridized to a flat surface called a flow cell that contains millions of binding sites for the attachment of unique DNA fragments. DNA sequencing is finally carried out in aqueous phase, using DNA polymerase enzymes and each of the four DNA nucleotides tagged with a particular fluorophore. These nucleotides have a chemical group that prevents more than one nucleotide to be added to the nascent synthesized DNA molecule at a time. Therefore, the addition of each nucleotide is followed in a controlled way by capturing a fluorescence signal, then the chemical group is released and the DNA synthesis resumed with addition of new fluorophore-tagged nucleotides.
The sequencing results come in a file that contains nucleotide sequences of each of the molecules synthesized in the flow cell, each of which will make a sequencing read, and can then be used for downstream analysis. Namely, using specialized software to carry out this analysis, reads coming from an original mRNA sample can be aligned to a reference genome, and these data can be used for quantification of exons, introns, transcripts and genes in the original sample. Quantified features are presented in individual files and are called raw counts (i.e. the raw number of reads mapping to a feature).
1.2.3.2 The Percent Splicing index
The above mentioned alternative splicing metric that expresses the relative frequencies at which the spliceosome efficiently splices an alternative exon in order to incorporate it in the mature mRNA molecule takes the name of percent splicing index, percent-spliced in, PSI or ψ (Venables et al., 2008; E. T. Wang et al., 2008). The general formula of PSI calculation for an event of alternative splicing affecting one gene, and given a group I of transcript isoforms that include the stipulated alternative exon and a group E of transcripts in which this exon is not spliced, is as follows:
𝑃𝑆𝐼 = ∑𝑖𝜖𝐼𝑁𝑢𝑚𝑏𝑒𝑟 𝐼𝑛𝑐𝑙𝑢𝑠𝑖𝑣𝑒 𝑇𝑟𝑎𝑛𝑠𝑐𝑟𝑖𝑝𝑡𝑖 ∑𝑛𝜖𝐼∪𝐸𝑁𝑢𝑚𝑏𝑒𝑟 𝑇𝑟𝑎𝑛𝑠𝑐𝑟𝑖𝑝𝑡𝑛 ,
and takes values from 0 to 1.
While using RNA-seq data, the way transcript numbers are estimated varies according to the software algorithms and options used. The transcripts considered may come from a previous reference annotation of the genome or else assembly of new transcript isoforms may be allowed during the analysis. Not only that, PSI values can in practice also be calculated from numbers of sequencing reads that span the exon-exon junctions involved in the alternative splicing event, or the reads that span both the exon-exon junctions and the alternative exon individually. This way of computing PSIs is called event-centric, in contrast to the isoform-centric that departs from counts
10
relative to the whole transcript isoform. The work presented here makes use of the isoform-centric approach.
1.3 A
LTERNATIVES
PLICING ING
LIOMAAlterations of alternative splicing patterns have been extensively reported to promote or help sustaining tumourigenesis. In 2007, a first publication showed how a change in the expression of a splicing factor could cause malignant transformation (Karni et al., 2007). In this work it was shown that fibroblasts overexpressing SRSF1 protein induced tumour formation through transplantation in a mouse model, with that overexpression producing switches in the relative abundances of oncogenic and tumour suppressive transcript isoforms that explained the malignant behaviour. More recently, already with the use of RNA-seq data, namely coming from the large cohorts of the TCGA project, pan-cancer studies have documented the existence of alternative splicing patterns that are cancer- and also cancer-type specific (Danan-Gotthold et al., 2015; Sebestyén, Zawisza, & Eyras, 2015; Tsai, Dominguez, Gomez, & Wang, 2015).
There are already descriptions of recurrent alternative splicing alterations in glioma, mainly in glioblastoma. In terms of known splicing factors implicated in this disease, there are PTBP1, PTBP2, A2BP1 (RBFOX1) and MBNL1. Although only PTBP1, and not PTBP2, gene expression alterations have been detected in tumour samples or glioma cell lines, it was shown by Cheung and collaborators that the down-regulation of these proteins in glioma cell lines had an onco-suppressive effect, reducing cell division rhythms and cell migration with a contrasting increase in cell adhesion (Cheung et al., 2009). Microarray expression analysis revealed that PTBP1 expression reduction promoted the inclusion of exon 3 of the RTN4 gene, thus leading to the expression a protein that reduced cell proliferation. In another study a new important target of PTBP1 splicing regulation was discovered: the tumour suppressor annexin 7 gene (ANX7) (Ferrarese et al., 2014). Once again, an alternative exon silencing role for PTBP1 was found in glioblastoma cells, where the inclusion of ANX7 exon 6 transcripts was suppressed resulting in decreased targeting of the EGFR growth factor receptor for degradation. Another well-studied example of the impact of splicing factors in glioma is that of the A2BP1 protein. Usually expressed in differentiated cells from the neuronal lineage, this protein was found to be downregulated in glioblastoma, resulting in a compromised terminal differentiation and acquisition of tumorigenic properties of neural stem cells (Hu et al., 2013). In this work, TPM1, a cytoskeletal remodelling protein, was found to be a crucial target of A2BP1, whose lack of splicing contributed to the malignant transformation.
Then, many other examples of splicing events that specifically affect glioma have been studied, some of which will be described. Growth factor receptor FGFR1 gene codes for two protein isoforms, and this latter one missing exon 3 that encodes an extra NH2 extracellular loop that leads to a higher affinity towards the ligand and thereby to increased GBM cell growth (Yamada, Yamaguchi, Brown, Berger, & Morrison, 1999). FGFR1 was found to be upregulated in glioblastoma, with concomitant switch of the prevalent FGFR1 isoform to the form (Yamaguchi, Saya, Bruner, & Morrison, 1994). Another growth factor receptor, EGFR, which is the most mutated gene in glioblastoma and usually appears overexpressed in this tumour, has been shown to have splice site mutations for exons 2 and 22, although these mutations are not among the most frequent (Brennan et al., 2013).
A final interesting example of a gene whose alternative splicing ratios greatly impact on glioma patient prognostic outcome prediction is the Reversion-inducing Cystein-rich protein with Kazal
11
motifs (RECK) gene. Until recently, only one protein isoform for this gene was known, with tumour
invasion, angiogenesis and metastasis suppressive properties, through the downregulation of the extracellular matrix degrading metalloproteinases MMP-9, MMP2 and MMP14. A recent study (Trombetta-Lima et al., 2015) has shown the existence of two novel isoforms for RECK: RECK-B and RECK-I. Furthermore, this study shows that patients with their high-grade gliomas having higher ratios of the RECK transcript that encodes the canonical isoform are associated with a better overall survival. Experiments performed in vitro showed directly the oncogenic function of the RECK-B non-canonical isoform, whose predominant expression in glioma cell lines promoted anchorage-independent cell growth.
This thesis project aims at analysing the contribution of alternative splicing regulation to the definition of glioma grades 2 to 4. It will have as a focus the glioblastoma (GBM) and low-grade glioma (LGG) RNA-seq data sets from the TCGA portal.
Three main subjects will be approached. Firstly, an evaluation about whether a signature of alternative splicing that is exclusive of this layer of mRNA processing exists or rather if it is associated with the already defined glioma subtypes will be made.
Then, the prognostic value of alternative splicing in glioma will be assessed and, specifically, genes and events of alternative splicing that make good glioma prognostic markers will be identified, particularly in terms of adding prognostic value to the already known glioma clinical and molecular risk factors.
Finally, an attempt to identify potential mechanisms of alternative splicing regulation in trans, underlying the patterns of alternative splicing in the different samples analysed, will be made.
13
M
ETHODS
2.1 D
ATA SETSClinical (patient- and biospecimen-related) and transcriptomic data used in this manuscript were retrieved from the data portals of TCGA (“The Cancer Genome Atlas - Data Portal,” 2016) and GTEx (“GTEx Portal,” 2016).
Patient and Biospecimen data files from the two glioma TCGA cohorts – Glioblastoma multiforme (GBM) and Low Grade Glioma (LGG) – included patient clinical registry information, as well as follow- -up data, and detailed information about sample quality, processing and full code nomenclature to enable correct assignment of gene expression data files to tumour case. As dictated by the sample management protocols of the project, all samples entering the cohorts contained at least 70 % tumour nuclei and not more than 50 % necrosis. Samples were subjected to histological classification, including WHO grade. A description of the nomenclature used to refer to the different histological types throughout this work is made in Table 2.1.
Table 2.1 – Nomenclature code used for the different sample types of diffuse gliomas of the GBM and LGG TCGA cohorts.
Official Designation This
manuscript’s Designation
Acronym Histology ICH id* WHO grade
Diffuse Astrocytoma Low-grade glioma grade 2
LGG2 9400/3 II
Anaplastic astrocytoma Low-grade glioma grade 3
LGG3 9401/3 III
Glioblastoma Glioblastoma multiforme
GBM 9440/3 IV
Diffuse Oligodendroglioma Low-grade glioma grade 2
LGG2 9450/3 II
Anaplastic oligodendroglioma Low-grade glioma grade 3
LGG3 9451/3 III
Oligoastrocytoma Low-grade glioma grade 3
LGG3 9382/3 II/III
* Morphology code coming from the International Classification of Diseases for Oncology.
In turn, a summary of clinical and molecular characteristics of glioma samples is shown in Table 2.2. RNA-seq expression data of level 3 from the same glioma cohorts referred above, processed and released by TCGA version 2 pipeline (“RNASeq Version 2 - TCGA - National Cancer Institute - Confluence Wiki,” 2016), was acquired on 14/09/2015. That pipeline includes mapping of sequencing reads to the TCGA, UCSC-nomenclature based, annotation (https://tcga-data.nci.nih.gov/docs/GAF/GAF.hg19.June2011.bundle/outputs/TCGA.hg19.June2011.gaf) of the hg19 human genome assembly, using MapSplice (K. Wang et al., 2010) and quantification of expression using RSEM (B. Li & Dewey, 2011). Tables with raw gene and isoform counts, as well as normalized TPM (Transcripts per million ((B. Li, Ruotti, Stewart, Thomson, & Dewey, 2010)) for genes and isoforms, were used in different analyses.
Data associated with GTEx tissue donor subjects and biospecimens consisted of sample tissue identity and subject and sample tissue identifiers. Samples used were a total of 8555, relative to 31 different tissues from the human body, coming from 573 donors (Lonsdale et al., 2013).
14
Similar to what was previously described for TCGA transcriptomics data acquisition, RNA-sequencing expression data from the GTEx project was obtained as tables with raw and normalized (RPKM) read counts for genes and isoforms, on 06/01/2016 (project’s data release version 6). The pipeline used for RNA-sequencing analysis included sequencing read mapping to a modified version of Gencode
v12 annotation of the hg19 genome assembly:
http://www.broadinstitute.org/cancer/cga/tools/rnaseqc/examples/gencode.v12.annotation.patche d_contigs.gtf.gz using TopHat (Trapnell, Pachter, & Salzberg, 2009) and quantification of known transcripts through the Flux Capacitor method (“GTEx Quantifications - Flux Capacitor - Confluence,” 2016; Montgomery et al., 2010).
Table 2.2 – Clinical and Molecular Characteristics of the TCGA Sample Set.
Features Total Cases (N = 674) Publication Cohort 674 (700 samples) LGG 514 (Suzuki et al., 2015) GBM 160 (Brennan et al., 2013) WHO Grade II 250 III 264 IV 160 DNA methylation Cluster Subtype LGm1 52 LGm2 253 LGm3 123 LGm4 68 LGm5 104 LGm6 40 Unknown 34 Primary-Recurrence Availability Sample Pair Available 20
Sample Pair Not Available
654
2.2 A
NALYSIS OF ALTERNATIVE SPLICING DATA 2.2.1 PSI data matrix generationPercent splicing-index estimates were calculated with SUPPA (Alamancos, Pagès, Trincado, Bellora, & Eyras, 2014) for alternative splicing events of the SE, MX, RI, A3, A5, AF and AL types by performing the ratio of the sum of the levels of a gene’s isoforms that include the regulated exon (or intron) over the sum of the levels of all the isoforms from the same gene. The alternative splicing events considered are generated by the program from the genome annotation provided and accounting for all splicing possibilities among the event types referred above. The definition of the regulated exon is done according to particular rules, specified in the software’s paper.
A table of transcript isoforms quantified in TPM for the 700 GBM and LGG RNA-seq samples was assembled from individual patient files and used as input together with a TCGA genome annotation
15
gtf file. The two command lines of the software, generateEvents and psiPerEvent, were run with default parameters, as described in https://bitbucket.org/regulatorygenomicsupf/suppa/src.
2.2.2 Preparation of working PSI matrices
Resulting PSI tables were filtered for missing values, in order to eliminate very rare alternative splicing events and samples with generalized poorer quality of PSI quantification. A first filter removed alternative splicing events missing PSI calculations for more than 80 % of the samples, while a second applied filter excluded samples with missing values for more than 40 % of the AS events. Dimensions of PSI matrices for individual event types, as well as for a merged matrix containing all event types after missing values-filtering, are shown in Table 2.3.
As a final step of PSI matrix preparation, duplicated samples pertaining to the same patient were removed (with the criterion of keeping as far as possible primary tumour samples only, rather than tumour recurrences), which resulted in a final PSI table containing 17151 alternative splicing events and 659 samples.
Table 2.3 – Dimensions of PSI tables after filtering.
Alternative Splicing Event Type
SE MX RI A3 A5 AF AL All
events
Events (N) 10700 118 713 2093 1740 1553 234 17151
Samples (N) 694 693 698 693 699 694 700 686
2.2.3 Differential alternative splicing analysis
Analysis of differential alternative splicing regulation across LGm subtypes was performed using the non-parametric Kruskal-Wallis statistical test for the equality of medians. This test can be applied when distributions of the variable under study are not normal, which is the case for PSI values (Rosner, 2011).
A PSI matrix containing all 17151 alternative splicing events quantified for the 627 samples with known, LGm group was used (Ceccarelli et al., 2016). The Kruskal-Wallis test was applied through function kruskal.test, the Kruskal-Wallis test implementation from the R package stats, and, each alternative splicing event has been tested using a list of six PSI vectors, one per LGm group. Adjustment for multiple hypotheses testing was performed by the Benjamini & Hochberg False Discovery Rate (FDR) correction (Benjamini & Hochberg, 1995), using the function p.adjust from the R package base, and both Kruskal-Wallis test statistic and FDR values were kept for downstream analyses.
For the selection of alternative splicing events showing a minimum PSI median difference between groups of 0.1, all 15 combinations of median differences between the six LGm groups were calculated for each of the 17151 alternative splicing events and, finally, events were selected if they had any of these differences reaching an absolute value of 0.1.
2.3 A
NALYSIS OF GENE EXPRESSION DATAExploratory and differential gene expression analyses were performed using functions from Bioconductor packages edgeR (“edgeR: a Bioconductor package for differential expression analysis