Article
, Vol. 30, No. 1, 140-148, 2019Printed in Brazil - ©2019 Sociedade Brasileira de Química
*e-mail: [email protected]
Sample Preparation Applied to Analysis of Proteins in
Cowpea Seeds (
Vigna
unguiculata
(L.) Walp.)
ThábataL.A.B.Nascimento,aTiagoL.S.Coelho,bCíceroA.LopesJúnior,a,b SamuelA.A.SousaaandHerbertS.Barbosa *,a
aGrupo de Estudo em Bioanalítica (GEBIO), Departamento de Química,
Universidade Federal do Piauí (UFPI), 64049-550 Teresina-PI, Brazil
bGrupo de Instrumentação Analítica e Preparo de Amostra (GRIAPA), Departamento de Química,
Universidade Federal do Piauí (UFPI), 64049-550 Teresina-PI, Brazil
In this study, 20 different protocols for protein extraction of cowpea seeds in natura were evaluated taking into account four parameters: cell disruption method, time, temperature and solvent. Factorial design experiments were executed to determine the effects on the total protein content of extracts. The total protein content was determined and the results were in the range of 8.75 ± 1.3 and 86.6 ± 6.9 mg g-1. The richest protein extracts were obtained using Tris-HCl buffer
at 50 °C for 20 min for each assessed cell disruption method. However, the results using water were similar to buffer according to t-test at the 95% confidence level. Six protocols demonstrated higher extraction efficiency. Comparative proteomic study using size exclusion chromatography coupled to diode array detector (SEC-DAD) revealed that the one protocol extracted simultaneously high and low molecular mass biomolecules. In fact, the effect of microwave radiation promoted an increased solubility of biomolecules in water. The analysis of chromatographic profiles for principal component analysis (PCA) highlights the greater efficiency of extraction with the application of this protocol. Therefore, our study showed that the optimum condition for extraction of cowpea seed protein consists of water assisted by microwave radiation at 50 °C for 20 min.
Keywords: cowpea seeds, sample preparation, protein extraction, HPLC
Introduction
Studies involving biomolecules require considerable careful analyst during analysis, mainly due to the characteristics of these biomolecules in the biological environment under study.1 Different life science areas such as genomics, proteomics, metabolomics, among others, show that studies of biomolecules are extremely important to understand a wide range of biological systems.2,3 In each of these areas, the first step in the analytical process corresponds to where sample preparation step must be done with extreme care so that the results obtained are adequate to the purpose of the study, generating appropriate conclusions. Thus, the choice of methodology for preparation of samples for protein analysis should consider relationship between extraction efficiency and maintaining the integrity of the analyte. The preparation of samples aimed at the analysis of proteins were developed
in a few steps, starting with cell disruption performed by manual maceration,3-5 or by employing alternative strategies such as microwave or ultrasonic energy radiation.6-8
Currently, proteomic studies in plants have shown considerable interest for part of the academic community. They are based on numerous studies which have a decisive participation of analytical techniques, contributing to the research and elucidation of various aspects of important metabolic processes of biological systems, among others.9,10 In this context, the proteins stand out for its participation in several events in the biological system, where the analysis of possible changes in their expressions has been the main focus of the studies involving proteomics of plants, since they provide valuable information about the status of the biological system as can be observed in the literature.11-13 Therefore, the choice of the sample preparation procedure becomes a fundamental stage of the analytical process and the proper optimization of this step is crucial to the results obtained,
Sample Preparation Applied to Analysis of Proteins in
Cowpea Seeds (
Vigna
unguiculata
(L.) Walp.)
since they demonstrate the biological variation and not the presence of systematic errors in the analysis.
In view of the great importance of proteins engaged in the daily diet of the human population, a variety of cowpea (Vigna unguiculata (L.) Walp.) was selected as sample for the development of this work, especially by their nutritional characteristics and being one of the main sources of protein for human consumption. Cowpea is one of the most important crops in the North and Northeast regions of Brazil and is expanding in the Central-West Region of the country. Cowpea is highly present in family productive arrangements and has been incorporated into the systems of production of small, medium and large companies in recent years. In addition to being an excellent source of protein (23-25%, on average), cowpea contains all essential amino acids, carbohydrates (62%, on average), vitamins, minerals and low amount of fat (oil content of 2% on average).14,15 Thus, proteomic studies can be an important tool to evaluate the different physiological conditions that influence plant growth, such as oxidative and water stress in the proteomic profile of the seeds.16,17
For this work, it was carried out the optimization of sample preparation procedure for extracting proteins from seeds of cowpea. Twenty protein extraction procedures (P1-P20) were evaluated considering solvent, time extraction, temperature and cell disruption method. In all protocols, total protein concentrations were evaluated, and the extracts obtained through the more efficient extraction methods were analyzed using size exclusion chromatography coupled to diode array detector (SEC-DAD) to observe potential changes in proteomic profiles from the comparison of chromatograms obtained for different extracts.
Experimental
Reagents and samples
All reagents used for extraction, quantification and analysis by HPLC such as Tris-base, potassium chloride (KCl), dithiothreitol (DTT), phenylmethanesulfonyl fluoride (PMSF) and sodium dodecyl sulfate (SDS) were purchased from Sigma-Aldrich (St. Louis, USA). All solutions were prepared with purified water (≥ 18.2 MΩ cm using a Milli-Q system of purification, Burlington, USA).
The seed sample of cowpea (Vigna unguiculata (L.) Walp.) used in this study was a cultivar Guariba, which was kindly provided by Prof Dr Maurisrael de Moura Rocha, from the Brazilian agricultural research corporation (Embrapa Meio Norte).
Protein extraction protocols
For the procedure of proteins extraction, 0.6 g of cowpea seeds were frozen in liquid nitrogen, ground with mortar and pestle. To the granular material obtained, it was added 10 mL of petroleum ether and agitated manually for 10 min to remove the oil present in the seed. This procedure was carried out three times and an appropriate volume of extraction buffer was added.
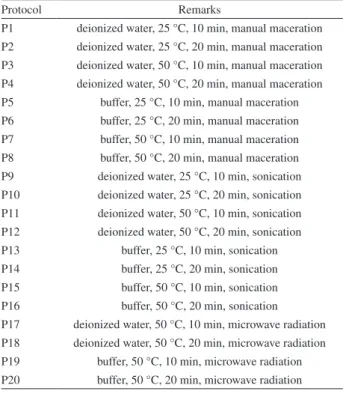
For extraction, four parameters were assessed: solvent extraction (deionized water and Tris-HCl, containing KCl, DTT, PMSF and SDS); extraction time (10 and 20 min); temperature (25 and 50 °C) and cell disruption procedure (manual maceration, ultrasonic and microwave radiation) resulting in a total of 20 extraction protocols (Table 1). For each extraction procedure, 10 mL of solvent were used (water or buffer solution). The buffer was prepared at the following concentrations: 50 mmol L-1 Tris-HCl, pH 8.8; 1.5 mmol L-1 KCl; 10 mmol L-1 dithiothreitol (DTT); 1.0 mmol L-1 PMSF and 0.1% m/v sodium dodecyl sulfate (SDS). Ultrasound equipment (USC-1600, Unique, Indaiatuba, Brazil) and microwave oven (Anton Paar MW3000, Graz, Austria) were used from P9 to P16 and from P16 to P20, respectively. In the process of microwave radiation, the temperature was varied, since the purpose of this procedure was to verify the influence of the heating generated by microwave radiation in the extraction of proteins.
Table1. Protein extraction protocols
Protocol Remarks
Taking into account the classification proposed by Osborne,18 the proteins extracted from protocols P1 to P4, P9 to P12, P17 and P18 can be correlated with the class of albumins proteins (soluble in water). All other protocols used may be correlated with the class of globulins (soluble salts).
After each procedure, the remaining insoluble material was removed by centrifugation (Bio-Spin-R, BioAgency, São Paulo, Brazil) during 10 min at 10,000 × g (4 °C). Supernatant solutions were stored in Falcon tubes and frozen at –18 °C.
Total protein concentration
After the completion of each protocol, the total protein concentration was determined by the Bradford method using bovine serum albumin (BSA) as standard solution.19 The analyses were performed on a spectrophotometer (Femto, 600 plus model, São Paulo, Brazil) and all measures were carried out in triplicate. For the solubilization of default and dilution of the samples obtained, 50 mmol L-1 Tris-HCl was used as a solvent before each measurement.
Experimental design
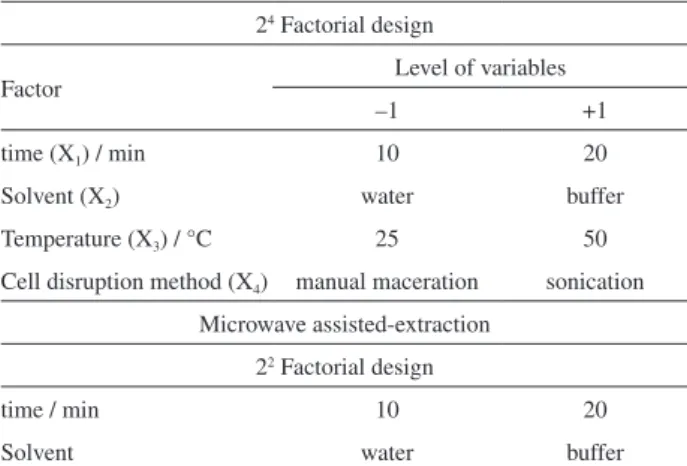
A full 24 factorial experimental design was used to evaluate the significance of the effects and interactions of the variables on the content of proteins. The evaluated variables were: time, solvent, temperature and cell disruption method (Table 2). The 16 assays (corresponding to P1-P16 protocols in Table 1) performed in triplicate were accomplished in a random fashion at different days. The monitored response (total content of proteins) was attained by the Bradford method, by using albumin as standard.19 Also microwave energy was evaluated as cell disruption method. The factorial design 22 given in Table 2 was used to conduct the experiments corresponding to P17-P20
protocols presented in Table 1. The parameters of the empiric models obtained were evaluated by means of the analysis of variance (ANOVA).
Separation and analysis of proteins using exclusion chromatography
To obtain the proteomic profiles of the protocols, a chromatographic system was carried out. It consisted of a high-efficiency liquid chromatograph (1260 infinity Series, Agilent Technologies, Waldbronn, Germany) equipped with a quaternary pump, degasser, autosampler, fractions and collector-type diode array detector (DAD).
The separation of the compounds was performed in a SuperdexTM 10 200/300 GL (GE Healthcare Bio-Sciences AB, Uppsala, Sweden) size exclusion column (10 mm × 300 mm × 5 µm), with optimum fractionation range of 10-600 kDa. Aliquots of 50 µL of extracts were injected into the SEC column and chromatographic run was isocratically made using 50 mmol L-1 ammonium acetate (pH 7.2) buffer as eluent at 0.5 mL min-1 during 70 min. The UV detector was set at λ = 280 nm for recording the signals. The column calibration was performed using the following protein standards: thyroglobulin (669 kDa); ferritin (440 kDa); aldolase (158 kDa) and conalbumin (75 kDa). Before the data, it has been built up a calibration graph of the logarithm of the molar mass of proteins according to their elution volumes, obtaining equation 1 (r = 0.98), employed for the estimation of the molar masses of compounds identified in the fractions eluted.
y = 10–0.1514x+4.101 (1)
In equation 1, y represents the molar mass of protein and
x indicates the retention volume obtained experimentally. The prediction of the molecular weight of the compounds detected in the eluates of protein extracts of the seeds of biofortified cowpea was held from the interpolation of the value obtained for the elution volume in equation 1. The compounds that showed elution volume before the mass deletion of the separation were classified as high molecular mass compounds, while low molecular weight compounds were those which eluted after mass exclusion range separation column. It is noteworthy that all the separations were carried out in duplicate.
Principal component analysis (PCA)
The chromatogram profiles for the extraction protocols P4, P8, P10, P16, P18 and P20 (all performed in duplicate) were organized into an X array of dimension 12 × 10500,
Table2. Variables (and symbols) and levels of the factorial design used
24 Factorial design
Factor Level of variables
–1 +1
time (X1) / min 10 20
Solvent (X2) water buffer
Temperature (X3) / °C 25 50
Cell disruption method (X4) manual maceration sonication
Microwave assisted-extraction
22 Factorial design
time / min 10 20
i.e., 12 samples and 10500 variables (retention times in a range of 0 to 70 min). The array was mean centered and then applied to principal component analysis (PCA). The PCA corresponds to projection technique, in which an array is projected on a subspace of reduced dimension, defined by principal components, where differences and similarities between the samples become more evident. Therefore, the PCA carries out a decomposition of the data matrix into two smaller arrays: an array of scores, which describes the relationships between the samples, and an array of loadings, that describes the relationship between the variables, plus an array of residuals. The patterns in the samples or variables can be seen through graphs of scores or loadings of a principal component versus another.20
Results and Discussion
Total protein concentration
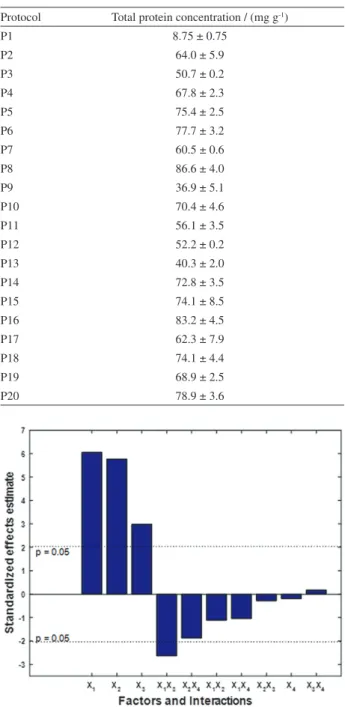
A full 24 factorial experimental design was used to evaluate the extraction protocols P1 to P16, in order to assess the significance of the effects and their interactions: (X1) time extraction; (X2) solvent; (X3) temperature; and (X4) cell disruption method as in Table 2. The levels of total protein were defined as dependent variable. The results of total concentrations of the protein in cowpea seed are shown in Table 3. The analytical curves carried out employing the Bradford method presented linear correlation coefficients (R) with values that ranged from 0.9895 to 0.9918.
The Pareto chart shown in Figure 1 summarizes the significance of the factor effects on the protein content. According to the results, time, solvent and temperature factors were significant, besides the interaction between temperature and time. ANOVA of the empiric model showed that the explained variance was 71.2% (determination coefficient (R2) = 0.712) of the data set. The magnitude of the effects indicate that protein contents increase with higher levels of time, solvent and temperature. Thus, comparing the extraction solvent in the same cell disruption procedure, a 28% increase in the amount of extracted proteins were observed by comparing P4 and P8, 59% from P12 and P16. According to the t-test, the protocols are significantly different to a confidence level of 95%. These results demonstrate a greater efficiency using the buffer Tris-HCl as a solvent on extraction process of protein from cowpea seeds.
Considering the effect of temperature, it was observed an improvement in the process of extraction of proteins when the factor was increased from 25 to 50 °C for most protocols. In comparison, considering the same extraction solvent used, there was an increase of ca. 5 times between
the protocols P1 and P3, 52% between P9 and P11 and 84% between P13 and P15. In addition, in accordance with the
t-test, the comparison of the protocols P1 to P3, P9 with P11 and P13 with P15 showed significantly different results to a confidence level of 95%, highlighting the influence of temperature on the extraction efficiency. Thus, one can consider that the temperature increase was shown to be a variable that influences positively on protein extraction of
Figure 1. Pareto chart for the standardized effects estimate in 24 experimental design (the symbols are presented in Table 2; X
iXj stands
for the interaction between factors i and j).
Table3. Total protein concentration ± standard error of the mean (n = 3) determined by the method of Bradford from different extraction protocols (defined by the Table 1)
Protocol Total protein concentration / (mg g-1)
P1 8.75 ± 0.75
P2 64.0 ± 5.9
P3 50.7 ± 0.2
P4 67.8 ± 2.3
P5 75.4 ± 2.5
P6 77.7 ± 3.2
P7 60.5 ± 0.6
P8 86.6 ± 4.0
P9 36.9 ± 5.1
P10 70.4 ± 4.6
P11 56.1 ± 3.5
P12 52.2 ± 0.2
P13 40.3 ± 2.0
P14 72.8 ± 3.5
P15 74.1 ± 8.5
P16 83.2 ± 4.5
P17 62.3 ± 7.9
P18 74.1 ± 4.4
P19 68.9 ± 2.5
arrays of samples, as in the case of cowpea seed, which has considerable content of fatty acids and lipids.15,21
In relation to the time of extraction, the results showed that for the most protocols evaluated, those made during 20 min were more efficient in extracting cowpea protein when compared the ones undergoing 10 min of treatment. In this sense, the extraction time of 20 min was adopted for protein extraction of cowpea. Although the effect of interaction between temperature and time factors has been significant, its level is less relevant compared to the individual effect of the factors (see Figure 1). Thus, the interaction effect on the extraction process was neglected.
The factor of cellular disruption method presented no significant effect. Then, microwave assisted-extraction (MAE) was evaluated because it has been an interesting alternative compared to conventional solid-liquid extraction methods applied for extracting proteins from plant materials.22-25 The interaction of microwave energy with the solvent causes dipole rotation and ionic migration, resulting in heating. This effect of increasing the temperature facilitates the solvent permeation in the cells promoting the disruption of the cell wall and extraction of the target compounds.26 The polar solvents are more sensitive to the microwave field effect.27,28 Therefore, MAE was evaluated following the 22 factorial design, which corresponds to the extraction protocols P17-20 described in Table 1. The mean value of the triplicate of the protein content determinations in the extracts are given in Table 3. Note that extracts with higher protein content were obtained in the extraction condition using Tris buffer for 20 min. However, ANOVA revealed that the effects of time and solvent factors as well as their interactions were not significant.
Comparing the different cell disruption methods, having the buffer as the best solvent for extraction of proteins, the maceration manual presented the most extracts protein levels in relation to the ultrasonic power and microwave radiation. For this result, a 4% reduction in the amount of extracted proteins was observed by comparing protocols P8 and P16 and 9% among the protocols P8 and P20. Taking into consideration the t-test, comparisons of P8 with P16 and P8 with P20 demonstrated that there are no significant differences (confidence level of 95%), showing that the use of ultrasonic and microwave radiation energy are interesting alternatives for protein extraction. Studies published in the literature using ultrasonic energy and microwave radiation in the extraction of proteins in seeds of plants are still few and demonstrates the need for further investigation of these analytical strategies.
The factorial design revealed the significance of the factors on the protein extraction process of cowpea bean seeds. The richest protein extracts were obtained using
solvent Tris-HCl buffer at 50 °C for 20 min for each assessed cell disruption method. However, the results using water as solvent were similar to the Tris-HCl buffer according to
t-test at the 95% confidence level. In order to find optimum extraction protocol, it was performed a comparative study using high-performance liquid chromatography (HPLC). The protocols selected were based on the best results of total proteins for each cell disruption method, considering manual maceration (protocols P4 and P8), ultrasonic energy (protocols P10 and P16) and microwave radiation (protocols P18 and P20).
Evaluation of biomolecules by HPLC-UV
The factorial design involving the extraction protocols showed the significantly effective factors on the total protein content of the extracts obtained from cowpea seeds. For some protocols extraction it was found high level of protein. Thus, SEC-DAD was used to investigate the effect of the variables on the molecules present in the obtained protein extracts aiming to find an optimal unambiguous extraction condition.
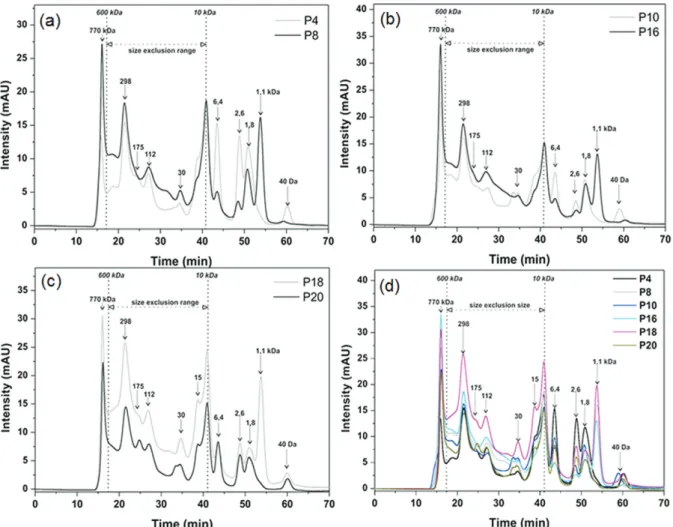
For the comparative study using SEC-DAD, the protocols P4, P8, P10, P16, P18 and P20 were selected. The concentration was previously normalized to the value of 800 mg L-1. The biomolecules were separated according to their size by SEC and simultaneously detected by UV at λ = 280 nm. The results obtained are shown in Figures 2a-d. The elution time of 70 min allowed elution of all biomolecules. The mobile phase used (0.05 mol L-1 Tris-HCl, pH 7.2) was satisfactory being effective in the solubilization and elution of the proteins through the column matrix. The column calibration was performed with the protein standards. The obtained mathematical model (equation 1) was used to estimate the molecular mass of the compounds detected in the extracts and the exclusion range of the separation column (10-600 kDa) corresponding to the retention time range of 17.5 to 41 min. The column size exclusion range was the reference for classifying the biomolecules detected as high mass, which presented a signal before 600 kDa, and low mass, which presented a signal after 10 kDa. Molecules with molecular mass greater than 10 kDa may have been influenced by secondary mechanisms (e.g. ion exchange) during separation.29
compounds of molecular mass greater than 10 kDa. In contrast, in the chromatograms of P4 it was detected more intense signals for compounds of molecular masses less than 10 kDa, except the 1.1 kDa biomolecule, which was only identified in a high-intensity signal in extracts of P8 protocol. In fact, the results show that the molecules of high molecular mass are more efficiently extracted using the protocol P8, while those of low molecular mass, the P4 protocol showed to be more adequate.
Approximately 80 to 90% of the proteins present in the plant seeds are globulins, which have the function of amino acid storage.30 The signals at 175 and 298 kDa can be assigned to 11S globulin. Bojórquez-Velázquez et al.31 identified 11S globulin in chia seeds with a molecular mass of 150 to 300 kDa, which has four monomeric units of 53.5, 52, 51.1 and 49.5 kDa, each unit consisting of a basic and an acid subunit bound by a disulfide bond.
Figure 2b presents the results obtained for extracts of cowpea seeds from extractions assisted by ultrasonic radiation at 50 °C for 20 min using as extractor: water (P10) or buffer (P16). According to the intensities of the signals
observed in the chromatograms extracts, the protocol P16 favors the extraction of compounds of molecular mass higher than 10 kDa, while P10 is more effective for the extraction of biomolecules of low molecular mass. However, the 1.1 kDa biomolecule was detected only for the extracts obtained using the P16 protocol. These data revealed that the extraction of biomolecules from seeds of cowpea based on ultrasonic energy using extractors (water or buffer) are complementary.
The results obtained in microwave assisted extraction at 50 °C for 20 min using water (P18) or buffer (P20) can be seen in Figure 2c. All the signals detected in the chromatogram of P18 were higher than P20. Also, only P18 protocol showed effective extraction for the biomolecule of 1.1 kDa, where the chromatogram shows an intense signal (see Figure 2c). The combination of water, thermal energy and microwave energy improved extraction of the hydrophilic molecules in the molecular mass range of 1.1 to 770 kDa of the bean seeds compared to the use of buffer. The SEC-DAD analyzes discriminate the results obtained by the Bradford method (Table 3), as
no significant difference was found between the protein content of extracts P18 and P20, according to the t-test, at 95% confidence level.
For comparison, Figure 2d shows the SEC-DAD profiles of extracts obtained by manual maceration, ultrasonic energy and microwave radiation at 50 °C for 20 min with water extractor or buffer. According to the results, P18 protocol was the most efficient for protein extraction in cowpea seeds, which chromatographic profile of the extract showed more intense signals for most biomolecules compared to the other extraction protocols.
The extractions assisted by manual maceration and ultrasonic energy showed similar results (see Figures 2a, 2b and 2d). The P8 and P16 protocols, using buffer as extractor, were more efficient for the extraction of the compounds of molecular masses higher than 10 kDa, while the application of P4 and P10 (extractor: water) protocols showed to be more effective for the capture of compounds of low molecular masses. The analysis of the extracts obtained using microwave radiation showed that the protocol P18 (water as extractor) demonstrated a high extraction capacity of all biomolecules (high and low molecular mass). The microwave radiation improves the extractability of the water since the biomolecule of 1.1 kDa showed an intense signal in the extract obtained using P18 protocol, which had been observed only in the protocols using buffer extractor medium, P8 and P16, combined with the friction or ultrasonic energy.
No significant differences were found between the total protein levels found in the different extracts obtained with the application of the different protocols according to the
t-test, at the 95% confidence level (Table 3). The SEC-DAD analysis revealed that P18 protocol is the optimal extraction condition for the cowpea seed proteins compared to the other protocols proposed in this study. Fabre et al.32 also evaluated the effect of microwave radiation, ultrasonic radiation and manual agitation on the extraction of flaxseed mucilage using water as extractor. In contrast to our study, microwave assisted extraction showed lower efficiency. In fact, extraction based on ultrasound radiation presented better performance.
Principal component analysis (PCA)
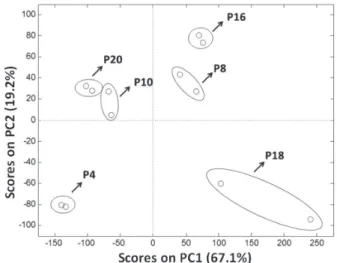
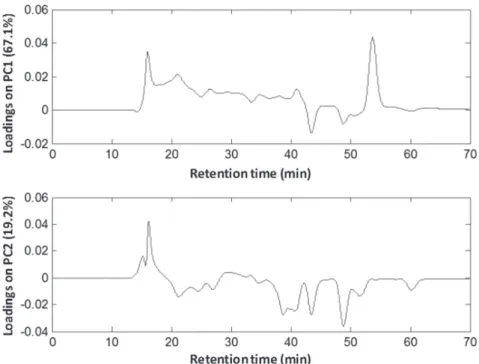
PCA was performed on the chromatographic profiles matrix obtained from the extracts relative to P4, P8, P10, P16, P18 and P20 protocols. Figure 3 shows the scores plot obtained from the projection of the samples onto first and second principal components, explaining 86.3% of total variance. Also, the variable loadings at the same components are presented in Figure 4 at retention time scale.
It can be seen in Figure 3 that the samples relative to P4 and P8 protocols obtained by employing manual maceration assistance, but with distinct solvent extractor, are distinguished by the principal components, being the former with negative and the latter with positive score values, at both components. The loading plot in Figure 3 highlights the signals close to 15 and 55 min as positive values associated to compounds of molecular weight from 770 to 1.1 kDa, respectively. The compound with greater molecular weight is more abundant in the extracts of P8 when comparing to those from P4. On the other hand, the compound with lower molecular weight is absent in the extracts of P4 (Figure 3). In PC2, the variables related to the compounds with molecular weight lower than 10 kDa (between 40 and 50 min) have negative loading values, explaining the negative score values of P4 protocol samples, since these signals are more intense in these ones, as discussed above.
The chromatographic profiles of extracts obtained with P16 protocol are similar to those from P8 protocol in the subspace spanned by PC1 and PC2, which is related to the extraction of compounds with 770 and 1.1 kDa molecular weight. In fact, this can be noted in Figure 2, where the signals from these compounds are highlighted in the mentioned chromatographic profiles. By comparing P16 and P10 extracts, both using sonication as assistance, it can be seen that despite the greater predominance of compounds with lower molecular weight in P10 ones, it is absent the signal relative to 1.1 kDa molecular weight compound (Figure 4). As a result, these extracts have negative score values in PC1. Additionally, there is an intense signal of the 770 kDa molecular weight compound with a positive loading value in PC2, associated to the positive score value for the P10 extracts in the same component. Similarly to
P10 extracts, P20 ones present positive score values in PC2 and negative score values in PC1, as a consequence of the 1.1 kDa compound signal absence and the intense signal for the 770 kDa molecular weight compound.
P18 protocol extracts are highlighted in Figure 3 score plot showing positive values in PC1 and negative values in PC2. These extracts, likewise the P20 protocol extracts, were obtained with microwave radiation assistance, but using deionized water as extractor. By analyzing the loading plot in the subspace spanned by PC1 and PC2, it can be noted that the distribution of P18 protocol extracts is mainly due to the higher intensity of the signals associated to compounds with molecular weight of 770 and 1.1 kDa, with positive loading values in PC1, and to the signals relative to compounds with molecular weight between 600 and 10 kDa, with positive and negative loading values in PC1 and PC2, respectively.
The results demonstrated by PCA corroborate those discussed above for chromatographic profiles of the extracts, where it was pointed out the superior efficiency of extraction for the P18 protocol.
Conclusions
The main objective of this work was efficiently achieved, demonstrating the importance in the evaluation of sample preparation procedures when the objective is focused on protein extraction for proteomic studies in plants. The extraction solvent, cell disruption method
and temperature were decisive parameters to preserve the structure of the proteins after extraction and increase the extraction efficiency. In this study, it was also observed that the alternative strategies for cell rupture, such as ultrasonic energy extraction and microwave radiation, were efficient in the extraction of proteins in cowpea seeds, highlighting the P18 protocol that extracts the proteins of the bean using water as solvent extractor assisted by microwave radiation at 50 °C for 20 min.
Acknowledgments
The authors thank the Fundação de Amparo à Pesquisa do Estado do Piauí (FAPEPI, process No. 008/2016, grant 301269/2015-7), the Conselho Nacional de Desenvolvimento Científico e Tecnológico (CNPq, Brasília, Brazil) and the Coordenação de Aperfeiçoamento de Pessoal de Nível Superior (CAPES, Brasília, Brazil) for financial support and fellowships.
References
1. Borges, K. B.; Figueiredo, E. C.; Queiroz, M. E. C.; Preparo de Amostras para Análise de Compostos Orgânicos, 1a ed.; LTC: Rio de Janeiro, Brasil, 2015.
2. Barbosa, H. S.; Arruda, S. C. C.; Azevedo, R. A.; Arruda, M. A. Z.; Anal. Bioanal. Chem. 2012, 54, 299.
3. Oliveira, S. R.; Menegario, A. A.; Arruda, M. A. Z.; Metallomics
2014, 6, 1832.
4. Barbosa, H. S.; Souza, D. L. Q.; Koolen, H. H. F.; Gozzo, F. C.; Arruda, M. A. Z.; Anal. Methods 2013, 5, 116.
5. Safi, C.; Ursu, A. V.; Laroche, C.; Zebib, B.; Merah, O.; Pontalier, P. Y.; Vaca-Garcia, C.; Algal Res. 2014, 3, 61. 6. Dhanani, T.; Singh, R.; Shah, S.; Kumari, P.; Kumar, S.; Green
Chem. Lett. Rev.2015, 8, 43.
7. Drochioiu, G.; Ciobanu, C. I.; Bancila, S.; Ion, L.; Petre, B. A.; Andries, C.; Gradinaru, R. V.; Murariu, M.; Ultrason. Sonochem. 2016, 29, 93.
8. Tu, G. L.; Bui, T. H. N.; Tran, T. T. T.; Ton, N. M. N.; Le, V. V. M.; Food Technol. Biotechnol.2015, 53, 479.
9. Arruda, S. C. C.; Barbosa, H. S.; Azevedo, R. A.; Arruda, M. A. Z.; Analyst 2011, 136, 4119.
10. Sanchez-Lucas, R.; Mehta, A.; Valledor, L.; Cabello-Hurtado, F.; Romero-Rodriguez, M. C.; Simova-Stoilova, L.; Demir, S.; Rodriguez-de-Francisco, L. E.; Maldonado-Alconada, A. M.; Jorrin-Prieto, A. L.; Jorrin-Novo, J. V.; Proteomics 2016, 16, 866.
11. Kolenc, Z.; Vodnik, D.; Mandelc, S.; Javornik, B.; Kastelec, D.; Cerenak, A.; Plant Physiol. Biochem. 2016, 105, 67. 12. Vidal, N.; Barbosa, H.; Jacob, S.; Arruda, M.; Food Chem. 2015,
180, 288.
13. Wanick, R. C.; Barbosa, H. S.; Frazão, L. R.; Santelli, R. E.; Arruda, M. A. Z.; Coutinho, C. C.; Anal. Bioanal. Chem. 2013,
405, 7661.
14. Freitas, R. M. O.; Torres, S. B.; Nogueira, N. W.; Leal, C. C. P.; Farias, R. M.; Pesqui. Agropecu. Trop. 2013, 43, 370. 15. Frota, K. M. G.; Soares, R. A. M.; Areas, J. A. G.; Cienc. Tecnol.
Aliment. 2008, 28, 470.
16. Garcia-Cristobal, J.; Garcia-Villaraco, A.; Ramos, B.; Gutierrez-Manero, J.; Lucas, J. A.; J. Plant Physiol. 2015, 188, 72. 17. Guo, S.; Shan, S.; Jin, X.; Lei, Z.; Li, Z.; Zhao, L.; An, Q.;
Zhang, W.; J. Agric. Food Chem. 2015, 63, 150.
18. Osborne, T. B.; The Vegetable Proteins, 2nd ed.; Longmans Green: London, 1924.
19. Bradford, M. M.; Anal. Biochem.1976, 72, 248. 20. Bro, R.; Smilde, A. K.; Anal. Methods 2014, 6, 2812. 21. Castellón, R. E. R.; Araújo, F. M. M. C.; Ramos, M. V.; Andrade
Neto, M.; Freire Filho, F. R.; Grangeiro, T. B.; Cavada, B. S.;
Rev. Bras. Eng. Agric. Ambient. 2003, 7, 149.
22. Dycka, F.; Bobal, P.; Mazanec, K.; Babalova, J.; Electrophoresis
2012, 33, 288.
23. Galesio, M.; Vieira, D. V.; Rial-Otero, R.; Lodeiro, C.; Moura, I.; Capelo, J. L.; J. Proteome Res. 2008, 7, 2097.
24. Xu, G.; Chen, X.; Hu, J.; Yang, P.; Yang, D.; Wei, L.; Analyst
2012, 137, 2757.
25. Yu, Y.; Xie, L.; Gunawardena, H. P.; Khatun, J.; Maier, C.; Spitzer, W.; Leerkes, M.; Giddings, M. C.; Chen, X.; Anal. Chem. 2012, 84, 9008.
26. Shin, S.; Lee, A.; Lee, S.; Lee, K. J.; Kwon, J.; Yoon, M. Y.; Hong, J.; Lee, D.; Lee, G. H.; Kim, J.; Anal. Biochem. 2010,
407, 281.
27. Afiuni-Zadeh, S.; Guo, X. H.; Azimi, G.; Lankmayr, E.; Talanta
2011, 85, 1835.
28. Kabaha, K.; Taralp, A.; Cakmak, I.; Ozturk, L.; J. Agric. Food Chem. 2011, 59, 2958.
29. Koplík, R.; Borková, M.; Bicanová, B.; Polák, J.; Mestek, O.; Komínková, J.; Food Chem. 2006, 99, 158.
30. Chua, A. C. N.; Hsiao, E. S. L.; Yang, Y. C.; Lin, L. J.; Chou, W. M.; Tzen, J. T. C.; Biosci., Biotechnol., Biochem. 2008, 72, 506.
31. Bojórquez-Velázquez, E.; Lino-López, G. J.; Huerta-Ocampo, J. A.; Barrera-Pacheco, A.; Barba de la Rosa, A. P.; Moreno, A.; Mancilla-Margalli, N. A.; Osuna-Castro, J. A.; Food Chem.
2016, 192, 203.
32. Fabre, J. F.; Lacroux, E.; Valentin, R.; Mouloungui, Z.; Ind. Crops Prod. 2015, 65, 354.
Submitted: June 1, 2018 Published online: August 22, 2018