Repositório ISCTE-IUL
Deposited in Repositório ISCTE-IUL:
2017-12-20
Deposited version:
Post-print
Peer-review status of attached file:
Peer-reviewed
Citation for published item:
Jalali, S. M. J., Mahdizadeh, E., Mahmoudi, M. R. & Moro, S. (2018). Analytical assessment process of E-learning domain research between 1980 and 2014. International Journal of Management in
Education. 12 (1), 43-56
Further information on publisher's website:
10.1504/IJMIE.2018.10008710
Publisher's copyright statement:
This is the peer reviewed version of the following article: Jalali, S. M. J., Mahdizadeh, E., Mahmoudi, M. R. & Moro, S. (2018). Analytical assessment process of E-learning domain research between 1980 and 2014. International Journal of Management in Education. 12 (1), 43-56, which has been
published in final form at https://dx.doi.org/10.1504/IJMIE.2018.10008710. This article may be used for non-commercial purposes in accordance with the Publisher's Terms and Conditions for
self-archiving.
Use policy
Creative Commons CC BY 4.0
The full-text may be used and/or reproduced, and given to third parties in any format or medium, without prior permission or charge, for personal research or study, educational, or not-for-profit purposes provided that:
• a full bibliographic reference is made to the original source • a link is made to the metadata record in the Repository • the full-text is not changed in any way
The full-text must not be sold in any format or medium without the formal permission of the copyright holders.
Serviços de Informação e Documentação, Instituto Universitário de Lisboa (ISCTE-IUL) Av. das Forças Armadas, Edifício II, 1649-026 Lisboa Portugal
Phone: +(351) 217 903 024 | e-mail: [email protected] https://repositorio.iscte-iul.pt
Analytical Assessment Process of
E-learning; Research Domain between
1980 and 2014
Abstract:
Applying some methods to reduce the time and expenditures of training is inevitable in existing circumstances. Many educational organizations have realized the importance of Electronic Learning (E-learning) and tried to use this approach in leveraging their academic classes. As research in E-learning domain has become one of the most important and interesting subjects, observation in emerging and fading trends of E-learning is a need for the scholars and industry professionals who are interested to study and work in the field. This paper has triggered the investigation and depicting of scientific trends in E-learning by using two scientometric methods named burst detection and clustering analysis. By applying two mentioned methods, the hot topics were identified in the field of E-learning.
Keywords:
E-learning, Burst Detection Algorithm; Scientometrics, Text Mining.
1.
Introduction
Although modern methods of teaching would never replace with traditional methods, presenting courses in a mere traditional way would not be completed unless along with some new technologies; as it facilitates knowledge transfer [1]. Modern technologies and globalization have created dramatic changes in all aspects of human life. Development in new knowledge and skills helps to apply information. Therefore, new knowledge of “quick and available tutorial” leads to new types of training [2]. In recent years, E-learning has experienced an increasing trend as an acceptable solution for effective and swift learning. E-learning has been defined as the use of internet technology to enhance the quality and quantity of learning [3]. E-learning has been defined as a part of educational process at different levels of education from primary to higher education as well
and can even be used in corporation environments in order to integrate entire staffs and reduce the time and expenses of training [4]. The benefits of this educational system increase the number of training programs in different fields (medical, management, engineering, medicine, information technology, electronics and telecommunications) [5]. On the other hand, all high expenditure of E-learning software, high initial capital and a lot of time to enter the market, lead to emergence of some approaches that attempt to reduce the disadvantages of e-earning through the combination of E-learning into other technologies. Among all these technologies cloud computing [6] and using mobile phone [7] have been used more than others to train. That is why research trends identification is a great help for researchers in this field to recognize emerging trends and choose the subject of future research as time goes on. In the following text it has been tried to review and analyze the published articles in the field of electronic learning in the most prestigious academic database in the world, Web of Science (WoS), by two methods called burst detection and clustering analysis to identify the hot topics in E-learning domain.
2.
Literature Review
Due tothe benefits and barriers associated with electronic learning in corporations, a lot of research have investigated these challenges, combining E-learning with other technologies and the growth of these technologies. These technologies are as follows: Training on social networks [8-11], E-learning implementation on cloud computing infrastructure [12-15] and Education via mobile phone [2, 16-20] which is a ubiquitous learning way[13, 21].
Chen and Lien [22] used an author co-citation analysis (ACA) which is an analytical method for identifying the intellectual structure of specific knowledge domains through the relationship between two similar authors, analyzed intellectual structure of E-learning from the perspective of management information systems (MIS). Lin and Hu [23] aimed to provide visualization of trends and research fronts in E-learning research from 2002 to 2013 through selecting five core journals from SSCI (British Journal of Educational Technology, Computers & Education, Education Technology & Society, International Journal of Computer-Supported Collaborative Learning, and Australasian Journal of Educational Technology). Harande and Ladan [24] studied development of E-learning literature in Nigeria; 1964-2008. They compiled a number of journal articles from ERIC database. Navalur, Balasubramani and Kumar [25] used Web of science Citation database for retrieving the publications' output in
E-learning during 2000-2011, which were 3070 publications. Chiang, Kuo and Yang [26] found that the quantity of recent research on learning is expanding remarkably; most research papers on learning are generated by multiple authorship; and applications of E-learning have most found in research areas such as Education & Educational Research, Information Science & Library Science, and Computer Science/Interdisciplinary Applications. Martin et al. [27] analyzed the technologies most likely to impact education in the near future, by looking at technology metatrends from 2004 to 2014. Maurer and Khan [28] analyzed five Social Science Citation Index (SSCI) journals (Journal of Computer Assisted Learning, Computers & Education, British Journal of Educational Technology, Innovations in Education and Teaching International and Educational Technology Research and Development) and two conferences (Educational Multimedia, Hypermedia & Telecommunications and IEEE International Conference on Advanced Learning Technologies). Cheng et al. [29] identified six research themes as result in the E-learning, which categorized into four dimensions: 1- integration of knowledge management with E-learning 2- E-learning for continuing education and professional development, 3- use of social media for E-learning and 4- E-learning in the healthcare sector. Kalmykova, Pustylnik and Razinkina [30] formed the model of information streams for the purpose of the choice of an optimal variant of network interaction when forming educational trajectories is offered. Aparicio, Bacao and Oliveira [31] identified 22 related E-learning terms used in literature and organized these concepts in a chronological way and then identified new concepts trends in E-learning and compared their publication growth rate with E-E-learning growth rate from 2010 to 2013.
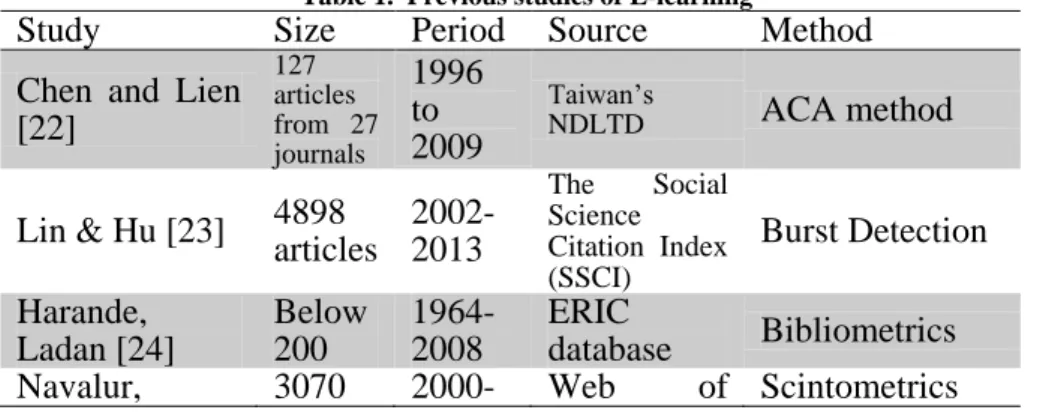
The table below summarizes studies have used this method in E-learning process:
Table 1. Previous studies of E-learning
Study Size Period Source Method
Chen and Lien [22] 127 articles from 27 journals 1996 to 2009 Taiwan’s NDLTD ACA method Lin & Hu [23] 4898 articles 2002-2013 The Social Science Citation Index (SSCI) Burst Detection Harande, Ladan [24] Below 200 1964-2008 ERIC database Bibliometrics Navalur, 3070 2000- Web of Scintometrics
Balasubramani , Kumar [25] 2011 science Chiang, Kuo, Yang [26] 1944 1967-2009 SSCI Bibliometric Martin et al. [27] NG 2004- 2014 Google Scholar Bibliometric Maurer, Khan [28] 7759 2003- 2008 5 SSCI journals & 2 conferences Scientometric Cheng et al.[29] 324 2000- 2012 Scopus Bibliometric Aparicio et al. [31] NG totally 1960- 2013 ISI, Google Scholar, ACM, Scopus and AIS Bibliometric
Generally, the application of bibliometrics methods can be seen conspicuously in so many disciplines and subject areas like e-business [32], informetics [33], Thesaurus construction [34], E-Government [35], and health information [36, 37]. Hasanagas, Styliadis and Papadopoulou [38] developed E-learning system in environmental science management is a challenging task in the area of forest and general rural development policy. They discussed the development of a GIS-based model which includes region-based scientometrics, regarding policy field communication by using VISONE software to recognize the most “important” in a network and is going to be applicable in E-learning for various target groups (e.g. students who are specialized in forest policy and rural policy analysis, lobbyists, policy makers). Breznik [39] used the social analysis to identify the most important research institutions in Slovenia, and reveal clusters of research organizations which collaborate.
In this article scientometrics method is used to assess investigations that has been done in this field. Scientometrics is an authentic research method that can be used to depict part of the information [40]. This algorithm is a quantitative method which can be used for an extensive study of academic publications [41]. Scientometrics objectives include: Providing a pictorial and graphical output to create a broad perspective in specific domain as well as structural details of this scope and its outstanding features by scrutinizing a large number of papers [40]. Considering too amount of information available in the scientific sphere, providing picture of
changes trend in academic disciplines enhance the information communication [42]. This article seeks to examine the issue of how E-learning course has changed between 1980 and 2014. To analyze the trends Burst Detection algorithm is used and data based on keywords, titles is categorized separately and both most and least are discussed. This study is used the VOSViewer [43] and Sci2 [44] applications. In this regard, upon presentation of clustering and burst detection algorithm, the results of the analysis are presented during the period.
3.
Methodology
After accessing to Web of Science (WoS) core collection database, we have extracted the related papers to the field of E-learning. Next, we applied the Burst detection as well as clustering algorithm. We visualized both algorithms using visualization techniques by applying on the keywords and titles of E-learning papers. In the results section, we measured and visualized the outputs of the burst detection and clustering algorithms. The steps of the methodology that has been used in the paper is in figure 1.
Figure 1. The methodology of current study Access to WoS Extract related papers Burst Detection Clustering Conclusion
1.3. Data Gathering
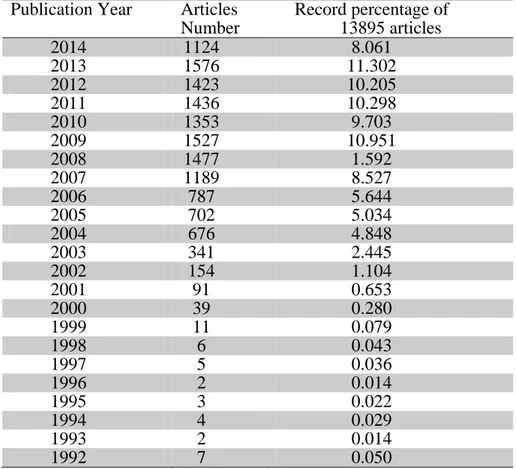
The data used in this study, has been gathered from Web of Science (WoS). The word "E-learning" was applied on WoS search engine between 1980 and 2014 and 13895 articles were retrieved. A summary of the collected data is presented in the table 2.
Table 2. Year of publication, articles number and percentage of E-learning term in the WoS
Publication Year Articles Number Record percentage of 13895 articles 2014 1124 8.061 2013 1576 11.302 2012 1423 10.205 2011 1436 10.298 2010 1353 9.703 2009 1527 10.951 2008 1477 1.592 2007 1189 8.527 2006 787 5.644 2005 702 5.034 2004 676 4.848 2003 341 2.445 2002 154 1.104 2001 91 0.653 2000 39 0.280 1999 11 0.079 1998 6 0.043 1997 5 0.036 1996 2 0.014 1995 3 0.022 1994 4 0.029 1993 2 0.014 1992 7 0.050
What is observed from the above table, indicating that E-learning has experienced a significant increase in 2007 and 2008 and in the years leading up to 2014 has taken a downward trend. Current research has experienced the following methodology in figure 1.
2.3. Results
2.3.1 Burst Detection
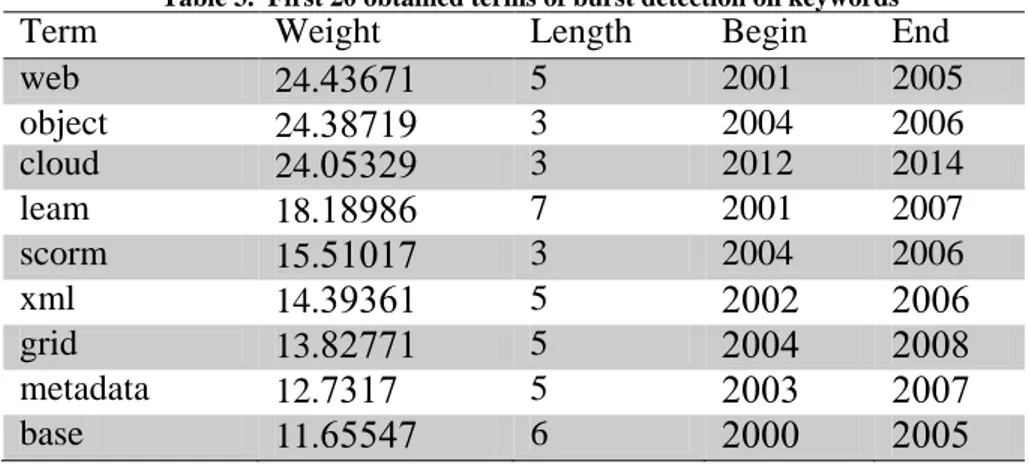
The Burst Detection algorithm has been used for detecting the scientific emerging trends [45, 46], and was first used in 2003 by Kleinberg [47]. Keywords and titles of scientific papers are the important components of scientific papers that can express the theme of scientific trends. It should be noted that because of not adding any values to output results, we did not consider the term “E-learning” to neither of the steps of the analysis section. The results of burst detection algorithms are applied on the field of E-learning in the network of 20 keywords and titles as it is shown in Tables 3 and 4, respectively.
Table 3. First 20 obtained terms of burst detection on keywords
Term Weight Length Begin End
web 24.769:4 5 2001 2005 object 24.6;:4< 3 2004 2006 cloud 24.9865< 3 2012 2014 leam 18.4;<;9 7 2001 2007 scorm 15.8494: 3 2004 2006 xml 14.6<694 5 5995 5999 grid 13.;5::4 5 5997 599; metadata 12.:64: 5 5996 599: base 11.9887: 6 5999 5998
internet 11.796<9 6 5994 5999 standard 9.<76:;< 5 5996 599: innov 9.:7;<85 2 5949 5944 smart 7.;59694 2 5946 5947 scienc 7.95994< 1 5944 5944 im 7.69<875 5 5997 599; servic 7.69999; 3 5996 5998 lom 7.55<544 5 5998 599< media 6.95855; 1 5945 5945 multimedia 6.4:9:48 6 5994 5999 organis 6.495<4< 3 5998 599:
Table 3 listed all of the top 20 emerging issues, sorted by their weights with respect to keywords. As it is indicated, the word web includes the highest repetition and subsequently has enjoyed the most weight among other keywords. Other top keywords are object, cloud, leam, scorm, xml, grid and metadata, addressing the important technologies and methods for constructing fundamentals of E-learning platforms.
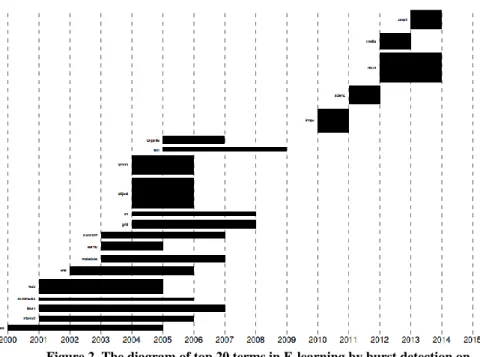
Besides, by taking a closer look at other top keywords, we can conclude that new technologies such as cloud computing (understood from the term cloud) is in an upswing technology in the field of E-learning. The other keywords such as standard, smart, media and multimedia paid to important characteristics of E-learning domain. For instance, multimedia has been effectively utilized in E-learning and its advantages for classroom learning are well designed. Figure 2 shows graphical view of the output of burst detection algorithm on the E-learning keywords, obtained from table 3. The horizontal axis indicates the time span of keywords and the vertical axis indicates the weights of keywords. This figure also indicates that start of important E-learning articles is from the year 2000 by looking at the keywords of the articles.
Figure 2. The diagram of top 20 terms in E-learning by burst detection on keywords
Also, in table four, the burst detection algorithm has been performed on the network of the titles of the E-learning articles.
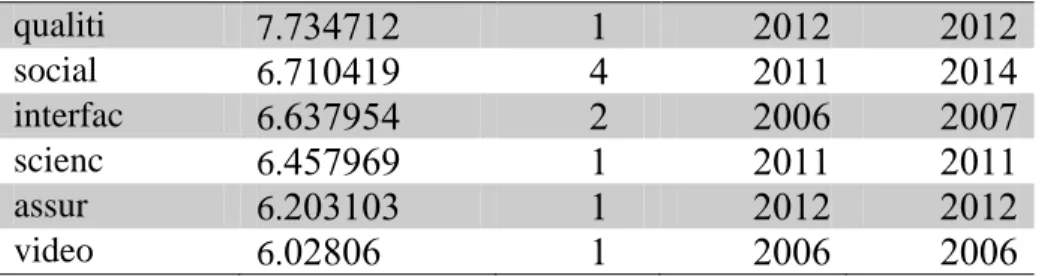
Table 4. First 20 obtained terms of burst detection on keywords
Term Weight Length Begin End
cloud 30.:977; 6 5945 5947 web 19.99;65 7 5995 5998 grid 16.97;79 8 5997 599; agent 15.47: 8 5995 5999 metadata 11.;9;:7 : 5994 599: higher 10.99765 4 5949 5949 servic 10.54794 6 5996 5998 distribut 9.<9;7:7 9 5994 5999 semant 9.999575 5 5998 5999 trial 8.9878: 6 5945 5947 scorm 8.84:;68 6 5997 5999 onlin 8.79:5<7 4 5947 5947 librari 7.<:<65: 7 5996 5999 xml 7.;565<7 8 5994 5998
qualiti 7.:67:45 4 5945 5945 social 6.:4974< 7 5944 5947 interfac 6.96:<87 5 5999 599: scienc 6.78:<9< 4 5944 5944 assur 6.596496 4 5945 5945 video 6.95;99 4 5999 5999
As the table above indicates, cloud technologies have a remarkable place among other titles of E-learning articles. We can also infer that the terms such as web, grid, agent, metadata, servic, distribut and semant enjoyed the most weights among other titles. For instance, these terms show the importance of technological advances and applications of semantic web, web 2.0 and Distribution systems in E- learning area.
Figure 3 illustrates the table 4 by applying title terms of E-learning in a time-span from 2001 to 2015. This figure also indicates that beginning of important E-learning articles is from the year 2001.
Figure 3. The diagram of top 20 terms in E-learning by burst detection on titles
The figure above also shows words such as metadata, agent, librari and interface have lasted for seven, five, four and two years respectively. On the other hand, the terms such as, cloud, social, online and trial are the hot topics because they ended in the year 2014.
4. Clustering
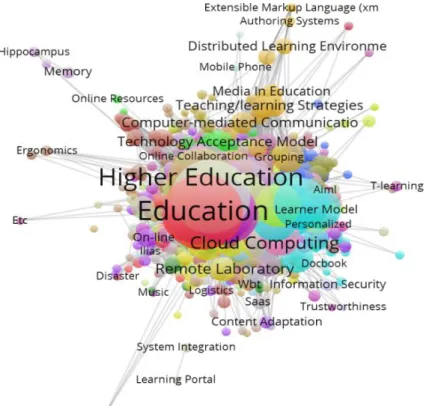
Clustering analysis is a powerful and useful tool for analysis of information flow [48]. Clustering Method is used for searching scientific literature, scientific issues, identifying leading researchers and classic papers, the birth of a new scientific process, track the evolution of each discipline, recognizing the "points of growth", analysis and improvement of scientific activities in scientific historical research communities. We applied clustering algorithm on the network of keywords and titles, indicated in table 5 and table 6, respectively. Besides, the clustering network of keywords and titles of E-learning articles have been visualized in the figure 4 and 5, respectively. A summary of the results of clustered keywords has been shown in the table 5. We indicated the most significant clusters and their related keywords in the table 5.
Table 5. Clustering table frequent keywords
Cluster Keywords
Cluster 1 Education, information,
knowledge, training
Cluster 2 behaviorpolicy,
benchmarking Cluster 3
learning model, learning activity, machine learning, neural network, text mining, web mining Cluster 4
cloud, education technology, education tool,learning systems, remote learning,virtual laboratory، Among 23 top words, we clustered them into four groups. Words such as Education at the first cluster, behavior in the second cluster, machine learning, neural network, text mining in the third cluster and cloud, remote learning in the fourth cluster are recognized as outstanding keywords among other keywords .
Figure 4 shows a schematic view of table 5. It should be noted that the keywords with the same color are considered in a same cluster.
Figure 4. Clustering based on keywords
Cluster 1 covers the subjects such as Education, information, knowledge, training; which are the basic and fundamental subjects in E-learning area. Cluster 2 devotes to behavioral aspects of E-learning area. Cluster 2 is devoted to learning approaches in E-learning domain such as text mining and web mining. Cluster 4 indicates significant tools for providing the structure of E-learning frameworks.
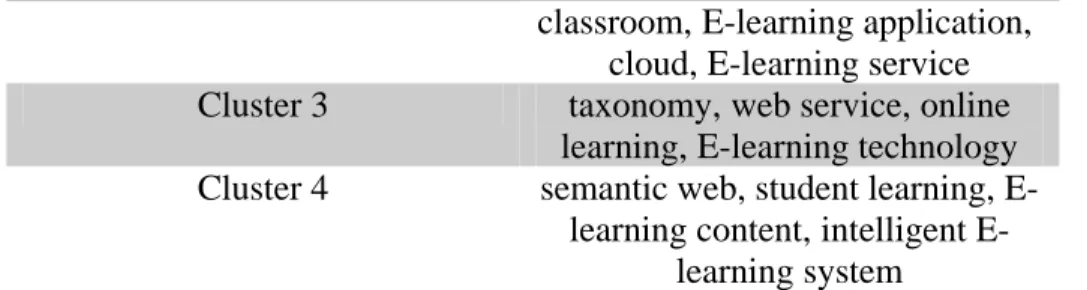
We also applied clustering techniques to titles of E-learning articles which top frequent keywords have been clustered in table 6.
Table 6. Clustering table frequent titles
Cluster Titles
Cluster 1 data mining,mobile learning, social software,mobile technology Cluster 2 virtual university,virtual
classroom,E-learning application, cloud,E-learning service Cluster 3 taxonomy, web service,online
learning, E-learning technology Cluster 4 semantic web, student learning,
E-learning content,intelligent E-learning system
For showing the important clusters, we selected 15 top terms. Cluster 1 indicates the learning process and the technologies for constructing a successful E-learning platform. Cluster 2 indicates the basic platforms and services such as virtual classes and E-learning applications. Cluster 3 contains the words such as taxonomy which is a base for providing the online learning classes. The terms such as semantic web and learning contents in cluster 4 represents the importance of these terms in intelligent E-learning systems.
We also visualized the whole clustered network of titles of E-learning domain in figure 5.
5. Conclusion
In this study, we applied scinetometrics methods such as clustering and burst detection over titles and keywords of E-learning domain. The results of burst detection algorithm, represent the emergence and disappearance themes through academic studies in the field of E-learning. By applying clustering analysis, it was inferred that the main current research directions in the field and by segmenting them into number of clusters, the important hot topics were identified. The findings indicated the current research direction for the scholars who were willing to understand the emerging and fading themes in the field of E-learning. The results also make evidence using remote access to E-learning frameworks. Web of Science database were used in this study. It is suggested that in the future research, more data from several databases such as Scopus and ProQuest databases have been studied and the results were compared with the current study.
References 1
. Furió, D., et al., Mobile learning vs. traditional classroom lessons: a comparative
study. Journal of Computer Assisted Learning, 2015. 31(3): p. 189-201.
2
. Milošević, I., et al., The effects of the intended behavior of students in the use of
M-learning. Computers in Human Behavior, 2015. 51: p. 207-215.
3
. Mayes, T. and S. de Freitas, JISC e-learning models desk study. Stage 2: Review of e-learning theories, frameworks and models, 2004.
4
. Welsh, E.T., et al., E-learning: emerging uses, empirical results and future
directions. International Journal of Training and Development, 2003. 7(4): p.
245-258.
5
. Stănescu, M. and N. Muşat, Quality Analysis Model of the E-learning Training
System for Sports Occupations. Procedia-Social and Behavioral Sciences .2115 ,
181
: p. 1351-1356.
6
. Kihara, T. and D. Gichoya. Use of cloud computing platform for e-learning in
institutions of higher learning in Kenya. in IST-Africa Conference Proceedings, 2014. 2014. IEEE.
7
. Joo, Y.J., K.Y. Lim, and E. Lim, Investigating the structural relationship among
perceived innovation attributes, intention to use and actual use of mobile learning in an online university in South Korea. Australasian Journal of Educational
Technology, 2014. 30(4.)
8
. Cela, K.L., M.Á. Sicilia, and S. Sánchez, Social network analysis in E-learning
environments: A preliminary systematic review. Educational Psychology Review,
2014. 27(1): p. 219-246.
9
. Li, X., K. Ganeshan, and G. Xu. The role of Social Networking Sites in
e-learning. in Frontiers in Education Conference (FIE), 2012. 2012. IEEE.
11
. Rennie, F. and T.M. Morrison, E-learning and social networking handbook:
Resources for higher education2013: Routledge.
11
. Wang and Du, Mobile Social Network Sites as innovative pedagogical tools:
factors andmechanism affecting students’ continuance intention on use. Journal
of Computers in Education, 2014. 1(4): p. 353-370.
12
. Cucinotta, T., et al., Virtualised e-Learning on the IRMOS real-time Cloud. Service Oriented Computing and Applications, 2012. 6(2 :)p. 151-166.
13
. Despotović-Zrakić, M., et al., Scaffolding environment for adaptive e-learning
through cloud computing. Journal of Educational Technology & Society, 2013.
16(3): p. 301-314.
14
. Fernández, A., et al., E-learning and educational data mining in cloud
computing: an overview. International Journal of Learning Technology, 2014.
9(1): p. 25-52.
15
. Gamalel-Din, S., R. Salama, and M. Al-Sowaiel. An Expert Consultant for
Cloudifying E-Learning Environments. in Future Internet of Things and Cloud
(FiCloud), 2014 International Conference on. 2014. IEEE.
16
. Althunibat, A., Determining the factors influencing students’ intention to use
m-learning in Jordan higher education. Computers in Human Behavior, 2015. 52:
p. 65-71.
17
. Andreicheva, L. and R .Latypov, Design of E-learning System: M-learning
Component. Procedia-Social and Behavioral Sciences, 2015. 191: p. 628-633.
18
. Eggermont, S., P.M. Bloemendaal, and J.M. van Baalen, E-learning any time
any place anywhere on mobile devices. Perspectives onmedical education, 2013. 2(2): p. 95-98.
19
. Nedungadi, P. and R. Raman, A new approach to personalization: integrating
e-learning and m-e-learning. Educational Technology Research and Development,
21
. Zamfiroiu, A. and C. Sbora, Statistical Analysis of the Behavior for Mobile
E-learning. Procedia Economics and Finance, 2014. 10: p. 237-243.
21
. Shih, J.L., H.C. Chu, and G.J. Hwang, An investigation of attitudes of students
and teachers about participating in a context‐aware ubiquitous learning activity.
British Journal of Educational Technology, 2011. 42(3): p. 373-394.
22
. Chen, L.-C. and Y.-H. Lien, Using author co-citation analysis to examine the
intellectual structure of e-learning: A MIS perspective. Scientometrics, 2011.
89 :)3(p. 867-886.
23
. Lin, X.-F. and Q. Hu. Trends in E-Learning Research from 2002-2013: A
Co-citation Analysis. in Advanced Learning Technologies (ICALT), 2015 IEEE 15th International Conference on. 2015. IEEE.
24
. Harande, Y.I. and B.F. Ladan, A Bibliometrics Study on E-Learning Literature
of Nigeria. Journal of Education and Human Development, 2013. 2(2): p. 31.
25
. Navalur, S.A., R. Balasubramani, and P.A. Kumar, Mapping of Global
Research Performance in E-learning: A Scintometrics Analysis. Journal of
Advances in Library and Information Science, 2012. 1(3): p. 130-137.
26
. Chiang, J.K., C.-W. Kuo, and Y.-H. Yang, A bibliometric study of e-learning
literature on SSCI database, in Entertainment for Education. Digital Techniques and Systems2010, Springer .p. 145-155.
27
. Martin, S., et al., New technology trends in education: Seven years of forecasts
and convergence. Computers & Education, 2011. 57(3): p. 1893-1906.
28
. Maurer, H. and M. Salman Khan, Research trends in the field of e-learning
from 2003 to 2008: A scientometric and content analysis for selected journals and conferences using visualization. Interactive Technology and Smart Education,
2010. 7(1): p. 5-18.
29
. Cheng, B., et al., Research on e-learning in the workplace 2000–2012: a
bibliometric analysis of the literature. Educational Research Review, 2014. 11:
p. 56-72.
31
. Kalmykova, S.V., P.N. Pustylnik, and E.M. Razinkina. Role Scientometric
Researches’ Results in Management of Forming the Educational Trajectories in the Electronic Educational Environment. in International Conference on Interactive Collaborative Learning. 2016. Springer.
31
. Aparicio, M., F. Bacao, and T. Oliveira, Trends in the e-Learning Ecosystem: A
32
. Mahdizadeh, E. and S.M.J. Jalali, The investigation of e-business trend by using
social network analysis technique between 1980 and 2015. journal of
information technology management, 2016. in press.
33
. Bar‐Ilan, J., The Web as an information source on informetrics? A content
analysis. Journalof the American Society for Information Science, 2000. 51(5): p. 432-443.
34
. Lykke Nielsen, M., A framework for work task based thesaurus design. Journal of documentation, 2001. 57(6): p. 774-797.
35
. JafarJalali, S.M. Visualizing e-government emerging and fading themes using
SNA techniques. in Commerce in Developing Countries: with focus on e-Tourism (ECDC), 2016 10th International Conference on. 2016. IEEE.
36
. García-Lacalle, J., V. Pina, and S. Royo, The unpromising quality and evolution
of Spanishpublic hospital web sites. Online Information Review, 2011. 35(1): p.
86-112.
37
. Bowler, L., W.-Y. Hong, and D. He, The visibility of health web portals for teens:
a hyperlink analysis. Online Information Review, 2011. 35(3): p. 443-470.
38
. Hasanagas ,N.D., A.D. Styliadis, and E.I. Papadopoulou, Environmental Policy
and Science Management: Using a Scientometric-specific GIS for E-learning Purposes. International Journal of Computers Communications & Control,
2010. 5(2): p. 171-178.
39
. Breznik, K., Using social network analysis to identify innovation clusters. International Journal of Innovation and Learning, 2016. 19(3): p. 272-285.
41
. Hook, P.A. and K. Börner, Educational knowledge domain visualizations: tools
to navigate, understand, and internalize the structure of scholarly knowledge and expertise, in New directions in cognitive information retrieval2005, Springer. p.
187-208.
41
. Chen, Y., S. Fang, and K. Börner, Mapping the development of scientometrics:
2002–2008. Journal of Library Science inChina, 2011. 3: p. 131-146.
42
. Börner, K., Visualization: Picturing science. Nature, 2012. 487(7408): p. 430-431.
43
. van Eck, N. and L. Waltman, Software survey: VOSviewer, a computer program
for bibliometric mapping. Scientometrics, 2009. 84(2): p. 52.538-3
44
Strategies, 2009.
45
. Guo, Weingart, and Borner, Mixed-indicators model for identifying emerging
research areas. Scientometrics, 2011. 89(1): p. 421–435.
46
. Swar and Khan ,Mapping ICT knowledge infrastructure in South Asia.
Scientometrics, 2014. 99(1): p. 117–137.
47
. Kleinberg, J., Bursty and hierarchical structure in streams. Data Mining and Knowledge Discovery, 2003. 7(4): p. 373-397.
48
. Marshakova, I., Bibliographiccoupling system based on references.