ISSN 1982-4327 (online version)
Psychological Evaluation
1This paper is part of the master dissertation of the first author, under the advice of the second author, defended in the Graduate Program in
Psychology at the University of Lisbon.
2Correspondence address: Universidade de Lisboa. Faculdade de Psicologia. Alameda da Universidade, Lisboa, Portugal. 1649-013. E-mail:
marcia.c.laranjeira@gmail.com
Portuguese Version of Teacher Feedback Scale: A Preliminary Study¹
Márcia Laranjeira² Universidade de Lisboa,
Lisboa, Portugal
Maria Odília Teixeira Universidade de Lisboa,
Lisboa, Portugal
Abstract: Teacher feedback in the classroom has a powerful influence on pupils’ performance and motivation. The study aims to analyze psychometric properties of the Portuguese version of the Teacher Feedback Scale (TFS) in a sample of 228 children in the 4th grade of schooling. Exploratory factor analysis shows similarities with the original version, and the differences observed were based on the children’s cognitive development characteristics and cultural specificities of the two samples. The relationship between teacher feedback and students’ motivational variables was confirmed, such as the preference that the children expressed for the school subjects. The possibility to make some changes in the items is contemplated, in order to increase validity and reliability of the measure. The data highlight the potential of using the TFS in schools, which could contribute towards clarifying the teachers’ role in the formation of pupils’ self-concept.
Keywords: persuasion, teacher-student interaction, test validity, test reliability, self-concept
Versão Portuguesa da Escala de Feedback do Professor: Um Estudo Preliminar
Resumo: O feedback do professor na sala de aula constitui uma poderosa influência no desempenho e na motivação dos alunos. O
estudo tem como objetivo analisar as características psicométricas da versão Portuguesa da Escala de Feedback do Professor (TFS) em uma amostra de 228 crianças do 4º ano de escolaridade. A análise fatorial exploratória demonstrou semelhanças com a versão original, e as diferenças observadas decorreram das características de desenvolvimento cognitivo das crianças e de especificidades culturais das duas amostras. Foi confirmada a relação entre o feedback do professor e variáveis motivacionais dos estudantes, como
a preferência pelas disciplinas escolares. Almejam-se mudanças em alguns itens, de modo a aumentar a validade e consistência da medida. Os dados salientam o potencial de utilização do instrumento nas escolas, com vista a clarificar o papel do professor na formação do autoconceito das crianças.
Palavras-chave: persuasão, interação professor-aluno, validade do teste, precisão do teste, autoconceito
Versión Portuguesa de la Escala de Feedback del Profesor: Un Estudio Preliminar
Resumen: El feedback del profesor en la sala de clase constituye una poderosa influencia en el desempeño y en la motivación de los alumnos. El estudio tiene como objetivo analizar las características psicométricas de la versión Portuguesa de la Escala de Feedback del Profesor (TFS) en una muestra de 228 niños del 4º año de escolaridad. El análisis factorial exploratorio demuestra semejanzas con la versión original, y las diferencias observadas son decurrentes de las características de desarrollo cognitivo de los niños e de las especificidades culturales de las dos muestras. Fue confirmada la relación entre el feedback del profesor y variables motivacionales de los estudiantes, como la preferencia por las disciplinas escolares. Se contempla la posibilidad de realizar alteraciones en algunos ítems de modo a aumentar la validez y consistencia de la medida. Los datos destacan el potencial de la utilización del instrumento en las escuelas con vista a clarificar el papel del profesor en la formación del autoconceito de los niños.
Palabras clave: persuasión, interacción profesor-estudiante, validación del test, precisión del test, autoimagen
In the learning context, the teachers’ contribution in the formation of pupils’ self-concept as an active learner is particularly significant, especially in earlier years of development (Seligman, 1994). During childhood, teachers
provide the building blocks of knowledge and contribute towards the development of attitudes regarding learning. According to the social cognitive perspective (Bandura, 1997), social persuasion is a source of information that serves as the foundation for academic self-efficacy. This assumption has been empirically demonstrated by studies that show a strong association between persuasion and students’ self-efficacy beliefs (Arslan, 2012; Butz & Usher, 2015; Joët, Usher & Bressoux, 2011; Phan, 2012a, 2012b). Persuasion is
also a strong predictor of achievement, namely in mathematics
Pajares (2008), based on their previous research, suggested that girls’ academic efficacy are more strongly informed by the messages they receive from significant others. However, not all studies have confirmed the evidence of gender differences in the effect of the efficacy sources (Kiran & Sungur, 2012). Among the different types of social persuasion that influence the perception that children build of themselves, teacher feedback is a significant one (Usher & Pajares, 2008); it gives pupils the nature and degree of development of their abilities, as well as transmits expectations about what is expected regarding the result of the learning process. The investigation in this field shows that a positive feedback is associated with a positive student self-concept (Chen, Thompson, Kromrey, & Chang, 2011). On the other hand, criticism is linked with a more negative perception of student-teacher relationship (Skipper & Douglas, 2015). In educational context, positive feedback seems to be more frequent than negative (Voerman, Meijer, Korthagen, & Simons, 2012).
Among the different kinds of feedback described in the
literature, Pintrich and Schunk (2002) highlight attribution’s feedback, which associates a pupil’s performance with different causes. This kind of feedback is comprised of messages that attribute success to effort or ability and it has an important influence on self-efficacy and performance (Schunk, 1982, 1983). However, in the cognitive differentiation process, the distinction between effort and ability can only be made around
the age of 9. In this stage of development, children begin to
distinguish these two concepts and give more importance to ability in the explanation of their results (Nicholls, 1979).
Based on the assumption that teachers’ feedback constitutes a source of efficacy information, it should be taken into account its potential influence on the development of students’ interests, since Socio-cognitive Career Theory (SCCT) (Lent, Brown & Hackett, 1994) supports that interests develop over time as a result of self-efficacy beliefs. During childhood, children are involved in some adaptive career behaviors, like developing subject-specific academic skills, extracurricular skills and provisional vocational aspirations. All of these behaviors are influenced by their efficacy beliefs (Lent & Brown, 2013).
The recognition that teachers’ answers in the classroom influences pupils’ learning, performance, and motivation (Hattie & Timperley, 2007) means that it is essential to
implement these concepts in the context of intervention in
educational psychology. Further, it is important to develop actions that lead to teachers’ awareness of strategies that can shape students’ behaviors and attitudes, creating students who are confident of their abilities and helping them to
achieve and exceed their goals (Schartel, 2012).
Consistent with this line of thought, Burnett (2002) developed
the Teacher Feedback Scale (TFS) to assess perceptions of
teacher feedback. This scale includes attribution’s feedback,
praise, and negative feedback. Research with TFS has pointed towards the existence of direct and mediated relationships
between feedback and student-teacher relationship (Burnett,
2002), as well as the perception of the classroom environment
and student interest in the subject (Burnett, 2003).
This preliminary study intends to analyze the psychometric properties of the Portuguese version of the
Teacher Feedback Scale (TFS). The degree of reliability and
validity of both its internal structure and its relationship with academic and motivational variables, such as the children’s preferences for the school subjects, was measured. Results from this study can expand our knowledge about the effects
of feedback in an academic, social, and vocational context,
namely in the first years of schooling.
Method
Participants
The convenience sample was comprised of 228 4th grade
pupils (56% girls) aged between 9 and 11 (most = 9). The data was collected from state (35%) and private (65%) schools in and around Lisbon in the 2014/2015 school year. The favorite subject of 48% of the children was Nature Study, 30% preferred Mathematic, and 22% chose Portuguese language. The inclusion
criterion in the sample was the enrollment in the 4th grade,
since children have a single teacher at this level of education in Portugal. It is supposed that children in this grade already have competence to fully understand the content of the items.
Instrument
The Teacher Feedback Scale (TFS) aims to assess the
pupils’ perception about the feedback they got from their teachers in learning situations (Burnett, 2002). The tool originally contained 34 items, divided into eight subscales: praise (e.g. Well done!), negative feedback (e.g. That’s a silly thing to do), two feedback scales focused on abilities, one for reading (e.g. You have good reading ability) and one for mathematic (e.g. You seem very talented in mathematic), two feedback subscales focused on the effort put into these two areas (e.g. You are working really hard in reading/ mathematic), and two other negative feedback subscales, again for reading (e.g. Come on, you can read better than that) and mathematics (e.g. That’s not good enough, please do those sums again). For each item, children had to indicate the frequency in which they perceived they were getting each
type of teacher feedback, and choose one of three options: 2 - Often; 1- Sometimes; or 0 - Never. In samples of children
aged between 7 and 12, the Cronbach alpha coefficients ranged between 0.78 and 0.88 (Burnett, 2002, 2003), which
indicates high internal consistency.
Apart from the TFS, the participants also answered a
demographic data questionnaire, which contained questions about gender, age and favorite academic subject.
Procedure
Data collection. The TFS author was contacted in order
with the two translations compared to create the final, most accurate version. There was a pilot study to assess how well the items were understood and determine the average time to complete the questionnaire, which was estimated to take about 10 minutes.
Each school was contacted to get formal authorization and the informed consent was sent to the guardians. Furthermore, the investigation was explained to children and their verbal agreement was required. The questionnaires
were administered collectively in the classroomby one of the
researchers. Only one child voluntarily dropped out of the study during the application process.
Data analysis. The descriptive statistics were estimated
to evaluate the characteristics of the distributions of the results of the items and subscales, as well as the assumptions of proximity to the normal distribution of this sample’s data. Exploratory factor analysis was conducted by the principal
component approach and the internal consistency assessed
using Cronbach’s alpha coefficient. Parametric tests, namely
test t and Anova (one-way) followed by pos-hoc tests (LSD)
for multiple comparison of means.
Ethical Considerations
This study was approved by the Ethics Committee of Faculty of Psychology of the University of Lisbon on January 23, 2015.
Results
Exploratory Factor Analysis
The factor analysis, conducted using the principal components approach and, according to the Kaiser extraction criteria, identified a seven-factor structure, explaining about 61% of the variance. However, considering the Scree Plot and the theoretical definition
of the scales, the analysis was restricted by imposing a
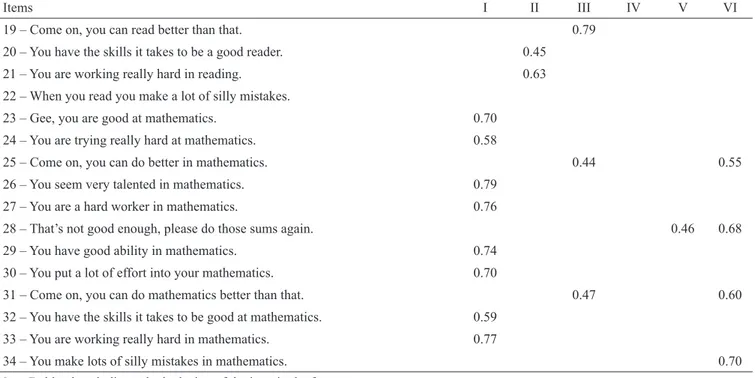
six-factor solution. Table 1 shows a summary of the rotated matrix,
considering the factor weights higher than 0.40. Only one item
(12) was included with a weight slightly lower than 0.40. Factor I explained 23% of the variance and is defined by the items that comprise the feedback subscales focused on mathematics ability and effort (23, 24, 26, 27, 29, 30, 32 and 33). Factor II contains the items about reading, of effort and ability feedback subscales (11, 12, 14, 15, 17, 18, 20 and 21), explaining 15% of the variance. Factor III is responsible for 8% of the variance and encompasses two of the five items that belong to the general negative feedback subscale (2 and 4), along with the four that make up the reading negative feedback subscale (13, 16, 19 and 22). Factor IV explains about 5% of the variance and corresponds to the praise subscale (1, 3, 5, 7 and 9). Factor V encompasses three of the five general negative feedback subscale (6, 8 and 10) and explains 4% of the variance. Finally, Factor VI corresponds to the mathematics negative feedback subscale (25, 28, 31 and 34) and accounts for 4% of the variance too.
Table 1
Summary of the Factorial Matrix Rotated by Varimax
Items I II III IV V VI
1 – Keep up the good work. 0.47
2 – Come on, you can do better. 0.65
3 – That’s really good work. 0.73
4 – Do that again, please. 0.43
5 – Lovely work. 0.64
6 – That’s very untidy work. 0.82
7 – Well done! 0.71
8 – That was a silly thing to do. 0.77
9 – Excellent work, well done. 0.61
10 – That’s not good enough. 0.46
11 – Gee, you are a good reader. 0.69
12 – You are trying really hard at reading. 0.37
13 – Come on, you can do better in reading. 0.80
14 – You seem very talented in reading. 0.78
15 – You are a hard worker in reading. 0.72
16 – That’s not good enough, please read it again. 0.52
17 – You have good reading ability. 0.71
18 – You put a lot of effort in your reading. 0.70
Items I II III IV V VI
19 – Come on, you can read better than that. 0.79
20 – You have the skills it takes to be a good reader. 0.45 21 – You are working really hard in reading. 0.63 22 – When you read you make a lot of silly mistakes.
23 – Gee, you are good at mathematics. 0.70 24 – You are trying really hard at mathematics. 0.58
25 – Come on, you can do better in mathematics. 0.44 0.55
26 – You seem very talented in mathematics. 0.79 27 – You are a hard worker in mathematics. 0.76
28 – That’s not good enough, please do those sums again. 0.46 0.68 29 – You have good ability in mathematics. 0.74
30 – You put a lot of effort into your mathematics. 0.70
31 – Come on, you can do mathematics better than that. 0.47 0.60 32 – You have the skills it takes to be good at mathematics. 0.59
33 – You are working really hard in mathematics. 0.77
34 – You make lots of silly mistakes in mathematics. 0.70
Note. Bold values indicate the inclusion of the item in the factor.
continuation...
Comparing these results with those obtained in the
original version, it can be seen that factors IV and VI keep
the same structure, corresponding to praise and mathematics negative feedback, respectively. However, there were a few important differences between these results and those obtained by Burnett (2002). Firstly, in the Portuguese sample, factors I and II group together the subscales regarding the feedback focused on effort and feedback focused on ability,
for mathematics and reading, respectively. Secondly, factor
III, which corresponds to the subscale of negative feedback in reading, also includes two items of general negative
feedback. Note that this factor also has a considerable
saturation of two negative items in mathematics. Therefore, the general negative feedback subscale (factor V) was reduced to three of the five original items. Considering the content of the items, the data suggests that Portuguese
children perceive two different kinds of negative feedback.
One of them includes an incentive component (Factor III), when the teacher’s feedback reflects an expectation that the
child is able to improve his or her performance. The other
kind includes only criticism, as is the case of items that
compose Factor V.
Item Distribution
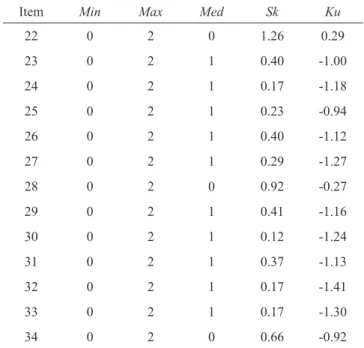
Table 2 presents some descriptive statistics of the
items: minimum (Min), maximum (Max), median (Med), the skewness (Sk) and the kurtosis (Ku). The items have a
distribution close to the normal range, and there was a variety
of responses among the three alternatives. These indicators
confirm that all items are sensitive to individual differences.
Table 2
Items Descriptive Statistics
Item Min Max Med Sk Ku
1 0 2 1 -0.26 -0.64
2 0 2 1 -0.27 -0.86
3 0 2 1 -0.39 -0.66
4 0 2 1 0.46 -0.86
5 0 2 1 0.01 -1.00
6 0 2 0 0.87 -0.65
7 0 2 1 -0.36 -0.66
8 0 2 0 0.90 -0.51
9 0 2 1 -0.08 -0.78
10 0 2 1 0.60 -0.66
11 0 2 1 0.12 -1.00
12 0 2 1 0.28 -1.11
13 0 2 1 0.52 -0.95
14 0 2 1 0.21 -0.98
15 0 2 1 0.24 -1.24
16 0 2 0 1.30 0.67
17 0 2 1 0.24 -1.13
18 0 2 1 0.16 -1.19
19 0 2 0 0.72 -0.70
20 0 2 1 0.52 -1.03
21 0 2 1 0.52 -1.01
Item Min Max Med Sk Ku
22 0 2 0 1.26 0.29
23 0 2 1 0.40 -1.00
24 0 2 1 0.17 -1.18
25 0 2 1 0.23 -0.94
26 0 2 1 0.40 -1.12
27 0 2 1 0.29 -1.27
28 0 2 0 0.92 -0.27
29 0 2 1 0.41 -1.16
30 0 2 1 0.12 -1.24
31 0 2 1 0.37 -1.13
32 0 2 1 0.17 -1.41
33 0 2 1 0.17 -1.30
34 0 2 0 0.66 -0.92
continuation... Reliability
The Cronbach’s alphas range between 0.74 and 0.89 (Table 3). These values are similar to those found in the original studies (Burnett, 2002, 2003). Also the correlations item-total range between 0.34 and 0.67 for praise, 0.49 and 0.63 for general negative feedback, 0.37 and 0.67 for effort-ability feedback in reading, 0.35 and 0.64 for
negative feedback in reading, 0.59 and 0.72 for
effort-ability feedback in mathematics, and 0.48 and 0.63 for negative feedback in mathematics. These results indicate good consistency in the measure.
Subscales Distribution
Table 3 presents the descriptive statistics of the subscales: the minimum (Min), the maximum (Max), the average (M), the standard deviation (SD), the skewness (Sk) and the
kurtosis (Ku). All show the sensitivity of the instrument to
catch individual differences and ability to indicate that the results have a distribution close to the normal.
Table 3
Scales Descriptive Statistics
Subscales Α Min Max M SD Sk Ku
Praise (5 items) 0.78 0 10 6.03 2.36 -0.16 -0.45
Negative feedback (3 items) 0.74 0 6 1.74 1.71 0.91 -0.14
Effort-ability in reading (8 items) 0.85 0 16 6.65 4.11 0.16 -0.79 Negative feedback in reading (6 items) 0.74 0 11 4.00 2.68 0.43 -0.66 Effort-ability in mathematics (8 items) 0.89 0 16 6.78 4.54 0.14 -0.93
Negative feedback in mathematics (4 items) 0.76 0 8 2.80 2.17 0.39 -0.79
Group Differences
The results of t-tests show statistical significance in the
difference between boys and girls on the results of the general
negative feedback (Mboys = 2.28, SD = 1.77; Mgirls = 1.33, SD = 1.56; t = 4.19; p<.001), negative feedback in reading (Mboys= 4.65, SD = 2.78; Mgirls = 3.50, SD = 2.49; t = 3.18; p< .05), and effort-ability feedback at mathematics (Mboys= 7.76, SD = 4.84; Mgirls = 5.99, SD = 4.15; t = 2.90; p <.05). In these
scales, means are significantly higher for boys.
In the One-way Anova results, the effect of preference for the three main school subjects in the Portuguese elementary school system is significant in the effort-ability feedback at
mathematics (F(2;189) = 18.540; p <.001; η2
p = 0.165; π = 1)
and in the negative feedback at mathematics (F(2;193) = 3.188; p <.05; η2
p = 0.032; π = 0.605). The size of the effects varies
between medium and low, respectively, but the test potential is high in the first case and adequate in the second. The multiple
comparison (LSD test) showed that children who prefer mathematics have the perception that they receive, on average,
more effort and ability feedback in this subject (M = 9.59; SD =
4.45) than those who prefer Portuguese (M = 5.66; SD = 4.49; p < .001) or nature study (M = 5.62; SD = 3.72; p < .001). On the other hand, the mean of negative feedback at mathematics
is higher for pupils who prefer nature study (M = 3.02; SD
= 2.27), compared with those who prefer mathematics (M =
2.16; SD = 1.94; p< .05).
Discussion
In this first study exploring the Portuguese TFS with 4th
differentiation of the causes of attribution of ability, effort, task difficulty and luck, along with the determination of their consequences, only begins by the age of 12 (Faria,
2000). On the other hand, they are different of the theory
proposed by Nicholls (1979) on his attribution’s development
perspective, which stated that children between 9 and 11 years
can distinguish the concepts of effort and ability. Secondly,
in this sample, children perceive the content of some of the negative items, as a form of incentive. This happens when
a teacher’s criticism is associated with the expectation that the student can perform better (e.g. “Come on, you can do better”). In fact, Pintrich and Schunk (2002) already suggested that the impact of criticism on pupil’s motivation depends on whether the incentive message is incorporated or not. Such evidences may be linked to cultural factors, since the efficacy information transmitted by social persuasion can be construed and evaluated differently across cultures (Ahn, Usher, Butz, & Bong, 2016). In this sense, the way teachers organize their feedback patterns can also have a cultural specificity. In order to reduce the content ambiguity of some items formulated by the negative and to increase the consistency of the measure in the Portuguese version, the items 2 and 4 should be reformulated. In these items, the idea that the student could do better (e.g. “2 - Come on, you can do better”) can be replaced by statements without the incentive component (e.g. This is
not well done). This will allow researchers to analyze the implications of negative feedback on variables related with
students’ self-representations and learning.
In the results, differences emerge between the mean results for boys and girls, with boys perceiving more
general negative feedback, negative feedback in reading, and effort-ability feedback in mathematics than girls.
This discrepancy may warrant further research, since it is possible that these differences are a reflection of teachers’ bias in favor of boys, as Sadker (1999) suggested. Moreover, this result confirms a previous study which demonstrates a greater perception of social persuasion in mathematics by the boys (Joët et al., 2011).
Considering the preference for school subjects, the data supports Burnett’s study (2003) and are in line with
socio-cognitive model of development of interests (Lent et al., 1994). Children who perceive positive feedback of their effort and ability in mathematics tend to be more interested
in this subject. On the other hand, when the mathematics feedback is negative, the children refocus their interest towards other areas, such as nature study. The feedback on
reading ability and effort does not seem to be associated with
a preference for Portuguese, and this may be because reading
is transversal to all areas of learning.
Despite the limitations of the sample, the data set confirms the potential of TFS to assess children’s perception regarding
the feedback they get from teachers. The relationship between feedback and motivational dimensions in the school context
should also be underscored. The use of this measure could help to clarify the role of feedback in variables such as
self-concept and motivation, along with the characteristics of the
children’s learning process. The results point towards the need
to reformulate the content of some items, in order to eliminate any ambiguity. The subscale of general negative feedback also requires new items, removing the incentive component to give more focus to the negative one and ensure its internal consistency.
Data of this research show that educational intervention must begin early and must include, not only the children, but also the educators, such as teachers and parents. In addition, on intervention context in schools, TFS could contribute to increase teachers’ awareness about their powerful influence on student’s learning and motivation. It would also be interesting to explore the differential effects that encouragement or criticism perceptions can have. Future validation studies should include new criterion variables regarding learning and self-concept, such as achievement and academic self-efficacy.
References
Ahn, H. S., Usher, E. L., Butz, A., & Bong, M. (2016). Cultural differences in the understanding of modeling and feedback as sources of self-efficacy information.
British Journal of Educational Psychology, 86(1),
112-136. doi:10.1111/bjep.12093
Arslan, A. (2012). Predictive power of the sources of primary school students’ self-efficacy beliefs on their self-efficacy beliefs for learning and performance.
Educational Sciences: Theory & Practice, 12(3),
1915-1920. Retrieved from http://www.kuyeb.com/pdf/ en/8fa574f6cfbffd00ea03be43a1ed0970lanen.pdf Bandura, A. (1997). Self-efficacy: The exercise of control.
New York, NY: Worth.
Burnett, P. C. (2002). Teacher praise and feedback and students’ perceptions of the classroom environment. Educational Psychology: An International Journal of Experimental Educational Psychology, 22(1), 1-16. doi:10.1080/01443410120101215
Burnett, P. C. (2003). The impact of teacher feedback on student
self-talk and self-concept in reading and mathematics. Journal of Classroom Interaction, 38(1), 11-16.
Butz, A. R., & Usher, E. L. (2015).Salient sources of early adolescents’ self-efficacy in two domains. Contemporary Educational Psychology, 42, 49-61.doi:10.1016/j. cedpsych.2015.04.001
Chen, Y.-H., Thompson, M. S., Kromrey, J. D., & Chang, G. H. (2011). Relations of student perceptions of teacher oral feedback with teacher expectancies and student
self-concept. Journal of Experimental Education, 79(4), 452-477. doi:10.1080/00220973.2010.547888
Faria, L. (2000). Aspectos desenvolvimentais das
atribuições e dimensões causais: Estudos no contexto português [Developmental aspects of attributions and causal dimensions: Studies in the Portuguese context].
Hattie, J., & Timperley, H. (2007). The power of feedback.
Review of Educational Research, 77(1), 81-112.
doi:10.3102/003465430298487
Joët, G., Usher, E. L., & Bressoux, P. (2011). Sources of self-efficacy: An investigation of elementary school students
in France. Journal of Educational Psychology, 103(3),
649-663. doi:10.1037/a0024048
Kiran, D., & Sungur, S. (2012). Middle school students’ science self-efficacy and its sources: Examination of gender
difference. Journal of Science Education and Technology, 21(5), 619-630. doi:10.1007/s10956-011-9351-y
Lent, R. W., & Brown, S. D. (2013). Social cognitive model of career self-management: Toward a unifying view of
adaptive career behavior across the life span. Journal of Counseling Psychology, 60(4), 557-568. doi:10.1037/
a0033446
Lent, R. W., Brown, S. D., & Hackett, G. (1994). Toward a unifying social cognitive theory of career and academic
interest, choice, and performance. Journal of Vocational Behavior, 45(1), 79-122. doi:10.1006/jvbe.1994.1027
Nicholls, J. G. (1979). Development of perception of own attainment and causal attribution for success and failure
in reading. Journal of Educational Psychology, 71(1), 94-99.
Phan, H. P. (2012a). The development of English and mathematics self-efficacy: A latent growth curve analysis.
The Journal of Educational Research, 105(3), 196-209.
doi:10.1080/00220671.2011.552132
Phan, H. P. (2012b). Relations between informational sources, self-efficacy and academic achievement: A
developmental approach. Educational Psychology, 32(1),
81-105. doi:10.1080/01443410.2011.625612
Pintrich, P. R., & Schunk, D. H. (2002). Motivation in education: Theory, research, and applications (2nd ed.).
Upper Saddle River, NJ: Merrill Prentice Hall.
Sadker, D. (1999). Gender equity: Still knocking at the
classroom door. Educational Leadership, 56(7),
22-26. Retrieved from http://www.sadker.org/PDF/ GenderEquity.pdf
Schartel, S. A. (2012). Giving feedback – An integral part of education. Best Practice & Research Clinical Anesthesiology, 26(1), 77-87. doi:10.1016/j. bpa.2012.02.003
Schunk, D. H. (1982).Effects of effort attributional feedback on children’s perceived self-efficacy and achievement.
Journal of Educational Psychology, 74(4), 548-556.
Retrieved from https://libres.uncg.edu/ir/uncg/f/D_ Schunk_Effects_1982.pdf
Schunk, D. H. (1983). Ability versus effort attributional feedback: Differential effects on self-efficacy and
achievement. Journal of Educational Psychology, 75(6),
848-856. doi:10.1037/0022-0663.75.6.848
Seligman, L. (1994). Developmental career counseling and assessment (2nded.). Thousand Oaks, CA: Sage.
Skipper, Y., & Douglas, K. (2015). The influence of teacher feedback on children’s perceptions of student–teacher
relationships. British Journal of Educational Psychology, 85(3), 276-288. doi:10.1111/bjep.12070
Usher, E. L., & Pajares, F. (2008). Sources of self-efficacy in school: Critical review of the literature and future
directions. Review of Educational Research, 78(4),
751-796. doi:10.3102/0034654308321456
Voerman, L., Meijer, P. C., Korthagen, F. A. J., & Simons, R. J. (2012). Types and frequencies of feedback interventions in classroom interaction in secondary education. Teaching and Teacher Education, 28(8), 1107-1115. doi:10.1016/j.
tate.2012.06.006
Yurt, E. (2014).The predictive power of self-efficacy sources
for mathematics achievement. Education and Science, 39(176), 159-169. doi:10.15390/EB.2014.3443
Márcia Laranjeira is a Ph.D. candidate of the Graduate
Program in Psychology of the Faculdade de Psicologia at the
Universidade de Lisboa.
Maria Odília Teixeira is a professor of the Faculdade de Psicologia at the Universidade de Lisboa.
Received: Mar. 28, 2016 1st Revision: Aug. 02, 2016 Approved: Oct. 25, 2016
How to cite this article:
Laranjeira, M., & Teixeira, M. O. (2018). Portuguese
version of teacher feedback scale: A preliminary