i
Raimundo Maximino Martins Diz
Licenciado em Biologia
Functional genomic analysis of heat
stress in Vitis vinifera
Dissertação para obtenção do Grau de Mestre em Genética Molecular e Biomedicina
Orientador: Helena Sofia de Campos Pereira,
Investigadora, Instituto Superior de Agronomia
Júri:
Presidente: Prof. Doutor(a) José Paulo Nunes de Sousa Sampaio Orientadora: Prof. Doutor(a) Helena Sofia de Campos Pereira Arguente: Prof. Doutor(a) Jörg Dieter Becker
ii
i “We are just an advanced breed of monkeys on a minor planet of a very average star. But we can understand the Universe. That makes us something very special.”
― Stephen Hawking
iii
Functional genomic analysis of heat stress in
Vitis vinifera
Copyright 2014 Raimundo Diz, FCT/UNL, UNL
v
Acknowledgments
First and foremost I would like to express my gratefulness to my supervisor, Sofia Pereira. I am forever thankful for the guidance, the support and help in all stages of this thesis. The encouragement in the lab work and knowledge given during all this past year was invaluable. For that and much more, was a pleasure and a lifetime experience.
My sincere thanks go to all the members of the Departamento de Genética from I.S.A., for their always joyful spirit and predisposition to help in the innumerous cases during this last year. A special word of appreciation to the director and soul of this department, Wanda Viegas, for all knowledge and motivation shared.
vii
Abstract
Grapevine (Vitis vinifera) is one of most agro-economically important fruit crops worldwide, with a special relevance in Portugal where over 300 varieties are used for wine
production. Due to global warming, temperature stress is currently a serious issue affecting crop
production especially in temperate climates. Mobile genetic elements such as retrotransposons
have been shown to be involved in environmental stress induced genetic and epigenetic
modifications. In this study, sequences related to Grapevine Retrotransposon 1 (Gret1) were utilized to determine heat induced genomic and transcriptomic modifications in Touriga
Nacional, a traditional Portuguese grapevine variety. For this purpose, growing canes were
treated to 42 oC for four hours and leaf genomic DNA and RNA was utilized for various techniques to observe possible genomic alterations and variation in transcription levels of
coding and non-coding sequences between non-treated plants and treated plants immediately
after heat stress (HS-0 h) or after a 24 hour recovery period (HS-24 h). Heat stress was found to
induce a significant decrease in Gret1 related sequences in HS-24 h leaves, indicating an effect of heat stress on genomic structure. In order to identify putative heat induced DNA
modifications, genome wide approaches such as Amplified Fragment Length Polymorphism
were utilized. This resulted in the identification of a polymorphic DNA fragment in HS-0 h and
HS-24 h leaves whose sequence mapped to a genomic region flanking a house keeping gene
(NADH) that is represented in multiple copies in the Vitis vinifera genome. Heat stress was also found to affect the transcript levels of various non-coding and gene coding sequences.
Accordingly, quantitative real time PCR results established that Gret1 related sequences are up regulated immediately after heat stress whereas the level of transcript of genes involved in
identification and repair of double strand breaks are significantly down regulated in HS-0 h
plants. Taken together, the results of this work demonstrated heat stress affects both genomic
integrity and transcription levels.
ix
Resumo
A videira (Vitis vinifera) é um das culturas de fruto com mais relevância económica a nível mundial, com especial relevância para Portugal, onde existem mais de 300 castas
especificas para a produção de vinho. Devido ao aquecimento global, altas temperaturas têm
provocado um grande défice na produção agrícola, com especial relevância para regiões em
climas temperados. Elementos genéticos móveis, como os retrotransposões têm sido
correlacionados a alterações genéticas e epigenéticas, provocadas por stresses ambientais. Neste
estudo, foram utilizadas sequencias relacionadas com o Grapevine Retrotransposon 1 (Gret1) para determinar se o stress térmico provoca alterações a nível da estabilidade genómica e
transcrição. Para este objetivo, estacas já desenvolvidas de Touriga Nacional, umas das mais
tradicionais castas portuguesas, foram submetidas a um stress térmico durante 4 horas a 42 oC, para posterior analise a nível de transcrição e estabilidade genómica em regiões codificante e
não-codificantes, utilizando para isso DNA e RNA extraído de folhas recolhidas logo a seguir
ao stress térmico (HS-0 h) ou após um período de recuperação de 24 horas (HS-24 h). Foi
demonstrado que o stress térmico leva a um decréscimo significativo de sequências relacionadas
com o Gret1 a HS-24 h, indicando assim, que este tipo de stress leva a alterações na estrutura do genoma. Para tentar identificar onde é que estas alterações ocorreram, foi realizado um
Amplified Fragment Length Polymorphism. Os resultados obtidos permitiram identificar uma
sequencia de DNA polimórfica que é altamente repetitiva no genoma de Vitis vinifera e encontra-se na vizinhança de um gene (NADH), nos tratamentos HS-0 h e HS-24 h. Foi também
demonstrado que o stress térmico influencia o nível de transcrição de várias zonas codificantes e
não-codificantes do genoma. PCR quantitativo em tempo real demonstrou que existe um
aumento na expressão imediatamente a seguir ao stress térmico, para sequências relacionadas
com o Gret1. Por outro lado, foi também possível observar uma diminuição da expressão de genes envolvidos na identificação e reparação de quebras duplas no DNA, para o tratamento
HS-0 h. Concluindo, os resultados fornecidos por este trabalho, demonstram que o stress
térmico afeta tanto a estabilidade genómica como a transcrição.
xi
Table of Contents
Copyright ... iii
Acknowledgments ... v
Abstract ... vii
Resumo ... ix
List of Figures ... xiii
List of Tables ... xv
1 - Introduction ... 1
2 – Materials and Methods ... 13
2.1 - Plant Material and Heat Treatments ... 13
2.1.1 - Controlled growing conditions ... 13
2.1.2 - Heat stress conditions ... 13
2.2 - DNA Extraction ... 14
2.3 - Analysis of Gret1 copy number by Real-Time PCR ... 14
2.4 - REMAP and IRAP ... 16
2.5 - Southern Blotting ... 17
2.6 - Whole Genome analysis using Amplified Fragment Length Polymorphism (AFLP) ... 17
2.6.1 - AFLP Technique ... 17
2.6.2 - Separation of AFLP fragments by Denaturing Polyacrylamide gel electrophoresis ... 19
2.6.3 - Genomic Analysis of identified AFLP Polymorphism ... 20
2.7 - RNA extraction and cDNA synthesis ... 20
2.8 - Quantitative Real Time (qRT-PCR) ... 20
2.9 - Bioinformatic Analysis ... 22
3 – Results and Discussion ... 23
xii 3.1.1 Heat stress treatments had no visible effects of on vegetative development
... 23
3.1.2- Integrity and concentration of genomic DNA ... 23
3.1.3 - Heat induced alterations in the number of Gret1 related sequences... 24
3.1.4 –IRAP and REMAP did not identify heat induced polymorphisms ... 27
3.1.5 – Southern Blotting did not detect heat induced differences in DNA methylation ... 29
3.1.6 – Amplified Fragment Length Polymorphism (AFLP) identified one DNA polymorphism between heat stressed and control plants ... 30
3.1.7 - Heat induced AFLP polymorphism ... 32
3.2 – Heat stress induced alterations on transcription ... 35
3.2.1 – Integrity and concentration of RNA ... 35
3.2.2 – Effects on transcription caused by heat stress ... 35
3.2.3- Heat stress affects transcription of non gene coding regions ... 37
3.2.4- Heat stress impairs expression of genes involved in DNA double strand break repair ... 38
4 - Conclusions ... 41
Bibliography ... 55
xiii
List of Figures
Figure 1.1 - Schematic representation of structural characteristics of retrotransposons. ... 3
Figure 1.2 –The life cycle of LTR retrotransposons ... 4
Figure 1.3 –Representation of VvmybA1a, VvmybA1b, and VvmybA1c alleles and Gret1 ... 6
Figure 1.4 –Three main DNA double-strand break (DSB) repair mechanisms in eukaryotes . 11 Figure 1.5 –Non-homologous end joining (NHEJ) DNA repair pathway ... 11
Figure 2.1.2 –Heat stress treatment ... 14
Figure 2.4 –IRAP and REMAP PCR ... 16
Figure 2.6.1 –Amplified Fragment Length Polymorphism (AFLP) procedure ... 18
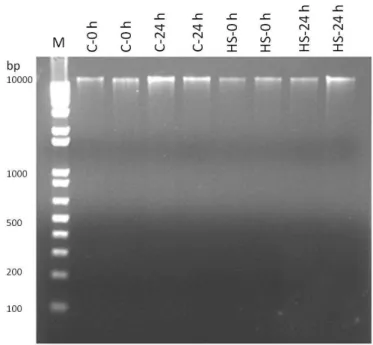
Figure 3.1.2 –Image of genomic DNA analyzed by 1 % (w/v) Agarose gel electrophoresis with molecular weight marker (M, 1 Kb+ ladder with molecular weights shown in base-pairs) from biological replicates of control and heat stressed samples ... 24
Figure 3.1.3.1 –Gret1 complete sequence (10 420 bp) with 5`-LTR and 3`-LTR (824 bp each) flanking two open reading frames for the gag and pol genes.... 24
Figure 3.1.3.3 –Representation of regression lines calculated for all biological replicates correspondent to the Control-0 hours (a and b), Control-24 hours (c and d), Heat stress-0 hours (e and f) and Heat stress-24 hours (g and h)... 25
Figure 3.1.3.4 –Graphic representation of the number of copies from each of the four Gret1 related sequences in controls and heat treated plants (HS-0 h and HS-24 h) ... 27
Figure 3.1.4 –Products from IRAP and REMAP analyzed in 1 % (w/v) Agarose gel electrophoresis, with Molecular weight marker (M, 1 Kb+ ladder), control-0 hours (C-0 h), control-24 hours (C-24 h), heat stress-0 hours (HS-0 h), heat stress-24 hours (HS-24 h) ... 28
Figure 3.1.5 - Image of Southern Blot probed with LTR2 sequence and genomic DNA digested with HpaII (sensitive to methylation) and MspI (non sensitive to methylation) with molecular weight marker (M, λ HindIII), with samples HS-24 h, C-24 h, HS-24 h, HS-0 h, C-24 h, C-0 h and C-0 h ... 29
Figure 3.1.6.1 –AFLP pre-amplification products analyzed in a 1 % (w/v) Agarose gel electrophoresis, samples include molecular weight marker (M, 1 Kb+ ladder), and pre-amplification products from controls (C-0 h and C-24 h) and both heat treatments (HS-0 h and HS-24 h) ... 30
xiv hours (HS-24 h), heat stress-0 hours (HS-0 h), control-24 hours (C-24 h), control-0 hours (C-0 h), and molecular weight marker (M, 25 bp ladder) ... 31
Figure 3.1.7.1 –Consensus sequence of gel isolated AFLP polymorphic band with the EcoRI and MseI adapters in extremities (in lowercase) ... 32
Figure 3.1.7.2 –BLAT results showing polymorphic AFLP sequence against the grapevine genome (8x) showing score, the start and end of the homology with genomic sequence, percentage identity, the location on the genome (chromosome, strand, and nucleotides) and length of homology ... 33
Figure 3.1.7.3 –Representation of primers and respective location within or flanking the AFLP –Fragment utilized to examine genomic region of AFLP identified polymorphism (a) and PCR products analyses 1.5 % (w/v) agarose gel electrophoresis with molecular weight marker (M, 1 Kb+ ladder) and samples C-0 h, C-24 h, HS-0 h and HS-24 h (b and c) ... 34
Figure 3.2.1 –Image of 1 % (w/v) agarose gel electrophoresis of RNA, with molecular weight marker (M, 1 Kb+ ladder) and samples control-0 hours (C-0 h), control-24 hours (C-24 h), heat stress-0 hours (HS-0 h), heat stress-24 hours (HS-24 h) ... 35
Figure 3.2.2 –Results of 1.5% (w/v) agarose gel electrophoresis of qRT-PCR products of Actin2, NADH and HSP90, genes for control-0 hours (C-0 h) and both heat treatments (HS-0 h and HS-24 h), and 1 Kb+ ladder (M) ... 36
Figure 3.2.3.1 - 1.5 % (w/v) agarose gel electrophoresis of qRT-PCR results of LTR1, LTR2 and LTR3 for control (C-0 h) and both heat treatments (HS-0 h and HS-24 h) show
up-regulation of Gret1 related sequences at HS-0 h. The expected molecular weight of each band is demonstrated by the molecular weight maker, 1 Kb+ ladder (M) ... 37
Figure 3.2.3.2 –Graphic representation of mean fold changes ± standard deviations of AFLP – Fragment transcript level from heat stress-0 hours (HS-0 h) and heat stress-24 hours (HS- 24h) in relation to controls ... 38
Figure 3.2.4.1 –Graphic representation of the mean fold change and respective standard deviations in transcript levels between control and heat stressed plants immediately after treatment (HS-0 h) and after a 24 hour recovery period (HS- 24h) for RAD50 (a) and XRCC4 (b) ... 39
xv
List of tables
Table 2.3 –Primers utilized in the qRT-PCR to quantify the Gret1 related sequences ... 15
Table 2.4 - Primers utilized for Gret1 based REMAP and IRAP ... 16
Table 2.8 –Primers utilized in the qRT-PCR to quantify Vitis vinifera expression ... 21
1
1 - Introduction
Global climate change and global warming are currently considered a serious problem and are
therefore given a significant amount of attention by the scientific community. It has been estimated
that average temperature increased approximately 0.5 °C during the 20th century and that it will rise
between 1.4 and 5.8 °C by the end of this century (Wang and Ye, 1995). Temperature stress has thus
become an issue for crop plants in the Mediterranean Basin, where most plants are exposed to optimal
temperatures at least at some time during their life cycle (Diffenbaugh et al., 2007). The effects of climate change on crop production are expected to significantly increase in the years to come
(reviewed in Wahid et al., 2007).
Grape, Vitis vinifera L., is an agro-economically important species cultivated worldwide with highly valued products such as fruits, juices, liquors and wines (Vivier and Pretorius, 2002). Similarly
to other crop plants, various environmental stresses affect grape development, with temperature being
the major determining factor (Cramer et al., 2011). Temperatures at midday can reach above 40 °C in several wine regions, which can threaten berry quality and economic outcomes (Schultz, 2007;
Howell, 2001). As temperature increases and water levels decrease, these problems will become more
and more relevant (Cramer et al., 2011; Van Leeuwen, 2004; Pereira et al., 2014).
A significant number of studies have investigated the morphological and physiological
responses of plants to high temperatures, mainly focusing on photosynthesis, respiration, cell
2
Vitis vinifera
L.
V. vinifera is a perennial woody vine belonging to the Vitaceae family whose domestication is believed to have occurred between seven to four thousand years B.C., in the geographical area
between the Black Sea and Iran (Châtaignier, 1995; McGovern et al., 1996; Zohary, 2004). From this region, cultivated forms of Vitis spread to the Near East, Middle East and Central Europe. As a result, these areas may have constituted secondary domestication centers (Grassi et al., 2003; Arroyo-Garcia
et al., 2006). Based on its cultivated area and economic value, grapes are one of the major fruit crops in the world. This is evident by estimates of grape production for wine making worldwide, consisting
of 69 093 293 tons of grapes which is equivalent to 39 494 901 US Dollars in 2012 (Food and
Agriculture Organization of the United Nations, FAO). Besides wine, which is its major product,
grapes are also used for liquor, fresh fruit, dried fruit and juice production. In Portugal, grapes are the
most agro-economically relevant crop with a production of 694 612 tons in 2011 (Food and
Agriculture Organization of the United Nations, FAO). There is significant genetic variability in
Portuguese grapevine, evident as more than 300 genetically distinct cultivars (Almadanim et al., 2007; Gonçalves et al., 2007) used to produce a wide array of different wines (Stevenson, 2005). The traditional Portuguese cultivar Touriga Nacional was chosen as the object of this study. Thought to
have originated in the Douro region in the North of Portugal, this traditional cultivar is used throughout the entire country (Instituto da Vinha e do Vinho, I.P.). Despite having a low yield, it’s considered to be the queen of Portuguese cultivars due to the high quality wines produced.
Retrotransposons
Mobile genetic elements (MGEs) are ubiquitous genetic units that constitute a significant
portion of most plant genomes. There are two major classes of MGEs (Alzohairy et al., 2013), class I and class II elements where transposons are considered Class II elements, and have an RNA independent “cut-and-paste” mechanism (Le et al., 2000). On the other hand, class I mobile elements, or retrotransposons, propagate by a “copy-and-paste” mechanism. Retrotransposition involves complex processes including reverse transcription and integration of a double stranded DNA copy of
the mobile element into a new site in the genome (Dombroski et al., 1994; Kumar and Bennetzen, 1999; Wicker and Keller, 2007). Due to their dynamics and mobility, it is widely accepted that this
class of mobile DNA elements have a significant role in the evolution of their host genome (Hurst and
Schilthuizen, 1998; Volff and Brosius, 2007).
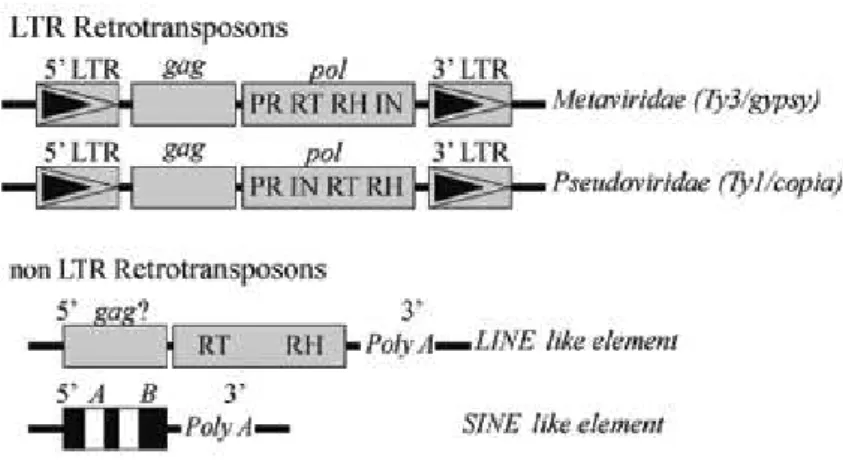
There are three types of retrotransposons, as shown in Figure 1.1 (Fávaro et al., 2005). These are; long interspreded elements (LINEs), short interspreded elements (SINEs) and long terminal repeat
3 namely Ty3 or gypsy-like and Ty1 or copia-like, with gypsy-like retrotransposons having the closest similarity to retroviruses (Friesen et al., 2001). LTR retroelements contain the gag (group-specific antigens) and pol (encoding polymerase) genes responsible for structural and enzymatic functions related to retrotransposition flanked by two LTRs. The first gene, gag, encodes for products that associate with retrotransposon transcripts to form virus-like particles (VLPs) while the second gene,
pol, encodesfour products essential for proliferation, including aspartic protease (pr/ap-pr), reverse transcriptase (rt), ribonuclease-H (rh) and integrase (in). Copia and gypsy type elements are defined by the arrangement of the reverse transcriptase and integrase domains in their pol genes, as illustrated in Figure 1.1 (Fávaro et al., 2005).
Figure 1.1 – Schematic representation of structural characteristics of retrotransposons. Long terminal repeat (LTR) retrotransposons resemble retrovirus and have LTRs flanking internal domains for gag and pol retroviral gene products. Gypsy type elements differ from Copia type elements by the order of the Reverse Transcriptase
and Integrase domains in their pol genes. LINE and SINE non LTR-retrotranspososn lack terminal repeats and carry a poly (A) tail at their 3` ends. LINEs possess two long open reading frames (ORFs), with similarities to
gag as well as the reverse transcriptase (rt) and ribonuclease-H (rh) genes. SINEs are short elements which contain an internal RNA polymerase III promoter with bipartite structure (boxes A and B). Since SINEs do not encode RT, they rely on this enzyme from other elements for their mobilization. Image altered from Fávaro et al., 2005.
Once considered to be “junk DNA” mobile elements are now known to be an important component of genomes, affecting various processes from chromatin structure and organization to gene
expression (reviewed in, Hodgetts, 2004). In plants, contrary to animals, the most frequent types of
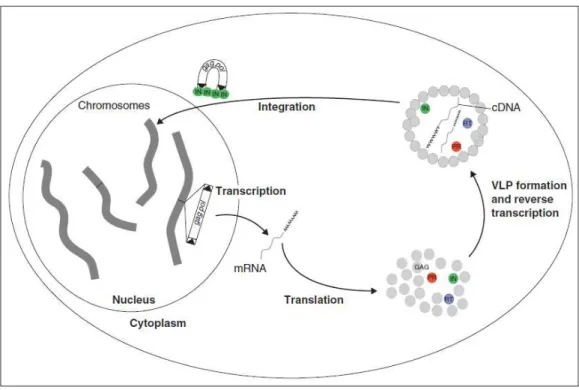
mobile DNA elements are gypsy and copia like LTR containing retrotransposons. Despite the difference in the pol gene organization of copia-like and gypsy-like LTR retrotransposons their mechanism of propagation is the same, and is illustrated in Figure 1.2 (Havecker et al., 2004). Due to their activity and mode of propagation, these types of elements have accumulated in plants genomes,
representing approximately 20 % of the rice genome, and up to 90 % of large genomes such as that of
wheat (Flavell, 1986; Jianxin et al., 2001). The molecular characterization and cytological localization of retrotransposons containing long terminal repeats (LTR) have been studied in numerous
4 question. In species with large genomes, gypsy-like and copia-like LTR retroelements are disproportionably abundant in heterochromatin, including pericentromeric and terminal
heterochromatic regions (Belyayev et al., 2001; Wong and Choo, 2004). However, there is also evidence of retroelements dispersed or clustered throughout gene rich regions (SanMiguel et al., 1996; Sandhu and Kulvinder, 2002).
Figure 1.2 – The life cycle of LTR retrotransposons. LTR retrotransposons contain LTRs at both ends of the
gag-polcoding region as shown by black triangles and propagate by a “copy and paste” mechanism. The gal-pol
coding region encodes gene products which are active in the cytoplasm as shown by circles, including INTEGRASE (IN-green), ASPARTIC PROTEASE (PR-red), REVERSE TRANSCRIPTASE (RT-blue), and glycosaminoglycan (GAG-grey). In the cytoplasm, GAG proteins form virus-like particles (VLP) where retrotransposon specific mRNAs and proteins are captured and reverse transcription of the viral mRNAs occurs to generate DNA intermediates. These DNA intermediates remain associated with INTEGRASES as they exit the VLP, are imported into the nucleus, and integrated into the genome. Image adapted from Havecker et al., 2004.
Due to their behavior and their genomic distribution, retrotransposons can be utilized as
powerful molecular tools of genetic diversity and evolution. The gag and pol regions are highly conserved, thus allowing for easy detection and analysis at the genetic as well as cytogenetic level.
LTR retrotransposons can be further explored via their LTR sequences, which are typically between
0.5 and 2 kb and are highly conserved within specific retrotransposons (Llorens et al., 2011). Considering that the exact same sequence between the 5`-LTR and 3`-LTR is an essential
characteristic for genomic insertion, sequence divergence between LTRs is often used for evolutionary
studies (Llorens et al., 2009). Other PCR based techniques that take advantage of LTR sequences are retro-element-microsatellite-polymorphism-amplified (REMAP) and
5 These two procedures have been used as molecular tools for a variety of studies in plants, such as
genetic mapping (Manninen et al., 2000), study of genetic stability in aplodiploid species (Baumel et al., 2002), creation of phylogenetic trees (Breto et al., 2001), study of genetic diversity among crops (Pereira et al., 2005), among others.
Grapevine Retrotransposon 1 (
Gret1
)
Similarly to other plant species, a significant portion of the Vitis vinifera genome can be attributable to mobile DNA elements such as retrotransposons. An early estimate based on a BAC
library constructed from the cultivar Syrah showed 41 % to be retroelement related (Tomkins et al., 2001). This is in accordance with more recent calculations obtained with whole genome sequencing
efforts, where transposable DNA elements are more abundant in grapevine than in Arabidopsis, poplar or rice (Jaillon et al., 2007; Velasco et al., 2007). In one publication, 108.5 of the estimated 504.6 Mb haploid nuclear genome is transposable element related, including class I (retrotransposons: copia,
gypsy, LINE) and class II (DNA transposons: Mutator, CACTA, hAT) (Velasco et al., 2007). The most abundant MGEs were gypsy/athila-like elements followed by copia-like elements. In a separate grapevine genome sequence, 41.4 % of the grapevine genome was estimated to be composed of
repetitive/transposable elements (Jaillon et al., 2007). Both publications indicate a large prevalence of class I mobile elements, or retrotransposons, which are distributed unevenly along the chromosomes
along with other repetitive sequences. To date, a number of retrotranspons have been characterized in
V. vinifera, including Gret1, Vine-1 and a number of Tvv1/copia-like elements (Kobayashi et al., 2004; Verriès et al., 2000; Moisy et al., 2008, respectively).
In this work, Gret1 related sequences were utilized to investigate the effects of heat stress on genomic integrity and function. This LTR retrotransposon was initially discovered as an insertion
mutation conferring white berry phenotype in grape (Figure 1.3). The skin color of the berry is
determined by the quantity and composition of anthocyanins, so that black (including red and purple)
cultivars accumulate anthocyanins in their skins, while white (including yellow and green) cultivars do
not. In Vitis, anthocyanins biosynthesis is controlled by a gene for UDP-glucose: flavonoid 3-O-glucosyltransferase (Kobayashi et al., 2002), namely VvmybA1 in V. vinifera (Kobayashi et al., 2004; Kobayashi et al., 2005). Gret1 was initially characterized as an insertion mutation of the VvmybA1
gene. These mutations, evident in the VvmybA1a and VvmybA1b alleles, contain a complete or partial
Gret1 retrotransposon upstream of the VvmybA1-coding sequence, respectively. This, in turn impedes
6 Figure 1.3 – Gret1 was initially identified as a mutation of the VvmybA gene affecting grape skin color.
VvmybA1a, VvmybA1b, and VvmybA1c alleles are shown where the VvmybA1a allele has a complete Gret1
sequence inserted upstream and VvmybA1b possesses a portion of the Gret1 LTR (box with diagonal strips). Both VvmybA1a and VvmybA1b result in no VvmybA product, resulting in plants which lack of color in grape skin (white grapes) if homozygous. Plants with one copy of the third allele, VvmybA1c have colored (red or purple) grapes. Figure altered from Kobayashi et al., 2007.
Based on its 10 422 base pairs (bp) long sequence, Gret1 can be classified as a gypsy-type retrotransposon with two 824 bp LTRs flanking an internal 8 774 bp region (Kobayashi et al., 2004). Since its discovery, the popularity of Gret1 is evident by the dozens of entries of associated sequences in the core nucleotide records, not only for V. vinifera but also for other species such as V. riparia, V. aestivalis, and V. lambrusca. Previous work done in our laboratory showed that the reverse transcriptase domain (rt) of Gret1 is highly conserved and that this element localizes to euchromatic or gene rich regions of the genome, suggesting a possible role in gene expression (Pereira et al., 2005). Furthermore, REMAP and IRAP molecular marker techniques with primers based on Gret1 LTR sequences indicated that there are differences in the genomic distribution of these retrotransposons
between cultivars but not within clones of the same cultivar (Pereira et al., 2005). Taken together, these results indicate that Gret1 can be used as a molecular tool to identify cultivars and that the genomic distribution of this retrotransposon may have a role in the phenotypes that define a cultivar.
Heat stress
As sessile organisms, plants have evolved complex adaptation and/or acclimation mechanisms
to deal with environmental stresses, including high temperatures. Depending on exposure time and
actual temperature, heat stress can be chronic, as experienced in hotter habitats, or acute, as a
consequence of seasonal or daily extreme temperatures. High temperature effects also depend on plant
tissue and developmental stage. Therefore, heat stress and its respective tolerance are not a single
occurrence, but rather a varying set of complex perturbations to the organism’s homeostasis
7
Effects of heat stress at the cell level
Heat affects a variety of structures, functions and processes at the cellular level. Considering
that proteins work at an optimal temperature range, temperature increases can alter enzyme activity
and lead to deregulation of metabolic pathways, and in extreme conditions to their denaturation.
Besides effects on the tertiary structure of individual proteins, heat stress also incurs considerable
defects on cytoskeleton structure and function. It has been shown that a slight increase in temperature
can induce reorganization of actin filaments into stress fibers (Toivola et al., 2010), whereas severe heat stress results in aggregation of filament-forming proteins and the collapse of actin and tubulin
networks (Welch and Suhan, 1985; Welch and Suhan, 1986). Golgi apparatus and endoplasmic
reticulum (ER) function is also impaired by heat, evident as a decline in the number of lysosomes and
mitochondria (Welch and Suhan, 1985). Furthermore, decreased oxidative phosphorylation combined
with the loss of mitochondria creates a drop in ATP levels during heat stress (Lambowitz et al., 1983; Patriarca and Maresca, 1990).
Heat stress also affects various nuclear and cytoplasmatic processes. The majority of RNA
splicing is strongly affected (Vogel et al., 1995) and translation machinery is compromised, resulting in incorrectly processed ribosomal RNAs and aggregates of ribosomal proteins (Welch and Suhan,
1985; see related review in this issue by Boulon et al., 2010). Heat stress has also been found to induce the formation of stress granules, which are large RNA-protein structures containing mRNAs,
translation initiation components, and other proteins related to mRNA function in the cytosol (Nover
et al., 1989; Buchan and Parker, 2009). These granules are believed to be caused by the inhibition of protein synthesis, one of the earliest metabolic responses to heat (Good and Zaaplachinski, 1994). In
addition to proteins and RNAs, high temperatures alter lipid properties. This results in cell membranes
becoming more fluid and permeable, which in turn changes ion homeostasis and decreases cytosolic
pH (Coote et al., 1991; Piper et al., 2003). Taken together, these heat induced effects can lead to cell cycle arrest and growth stagnation (Lindquist, 1980; Yost and Lindquist, 1986; Zeuthen, 1971).
Depending on the length and severity of the heat stress, the accumulation of heat effects can result in
cell death.
Although organisms have different optimal temperature ranges, they all have a highly
conserved defense mechanism to high temperature, known as the heat stress response. At the
molecular level, the most studied and known characteristic of the heat stress response is the induction
of the expression of a set of highly conserved proteins, know as heat stress proteins (HSPs) (Welch et al., 1991; Richter et al., 2010). The majority of these, such as HSP70 and HSP90, function as molecular chaperones facilitating protein folding and assembly (Gething and Sambrook, 1992; Hartl,
1996). On the other hand, other HSPs such as HSP100 belong to the AAA+ family of ATPases that are
8 Heat Stress Factors (HSFs), which are constitutively expressed in higher eukaryotes and are activated
under high temperature conditions (Sarge et al., 1993; Anckar and Sistonen, 2011).
Through transcriptional profiling or proteomic analyses, the heat stress response has been
addressed on a genome-wide level in a variety of cells and organisms (Eisen et al., 1998; Gasch et al., 2000, GuhaThakurta et al., 2002; Matsuura et al., 2010; Rohlin et al., 2005; Tabuchi et al., 2008; Liu
et al., 2012). These studies showed a conserved upregulation of 50 to 200 genes correlated to heat stress response in a variety of model organisms, such as Sacaromices cerevisiae, Caenorhabditis elegans, Archaeoglobus fulgidus and Arabidopsis thaliana (Gasch et al., 2000; Tabuchi et al., 2008). In grapes, approximately 8 % of the total leaf transcriptome was found to be responsive to heat stress
and subsequent recovery (Liu et al., 2012). In this study, there was heat induced up regulation of a large number of genes involved in essential biological pathways, including cell rescue (i.e.,
antioxidant enzymes), protein fate (i.e., HSPs), primary and secondary metabolism, transcription
factors (i.e., HSFs), signal transduction and development. Interestingly, the proportion of heat
stress-regulated genes immediately upon stress exposure was almost twice than those involved in recovery,
likely due to diverse expression kinetics of individual heat-induced genes (Liu et al., 2012). This is in accordance with previous studies showing that the expression of fast-responding genes involved in
rapidly counteracting heat induced damages can vary from those involved in recovery (Eisen et al., 1998). For example, chaperone genes encoding for heat shock proteins are among the most
substantially upregulated, becoming a major constituent of total cytosolic protein levels during heat
stress (Phipps et al., 1991). On the other hand, genes important for cell organization, DNA/ RNA repair, and some metabolic processes, tend to be expressed during the adaptation or recovery phases
(Eisen et al., 1998; Gasch et al., 2000).
Heat stress effects on retrotransposon related sequences
Due to their latent mutagenic capacity, mobile DNA elements can represent a threat to the
integrity and stability of their host genomes (Kidwell and Lisch, 2000). Plants have therefore evolved complex mechanisms of transposable element repression during their evolution. Due to their “copy and paste” mechanism of propagation, retrotransposon transcription is the first step towards retrotranspositon and is therefore highly regulated. Accordingly, a number of regulatory networks of
epigenetic silencing effective against transcriptional activity of numerous different MGEs are known.
For example, silent elements are typically associated with high levels of DNA methylation at
cytosines, and histone modifications including methylation at lysine 9 of histone H3 (H3K9me2)
(Lisch, 2009; Slotkin and Martienssen, 2007). A reinforcing loop of mobile element silencing
machinery also exists where RNA directed DNA methylation (RdDM) is lead by the expression of 24
9 Various abiotic stresses such as heat, chilling and mechanical damage have been shown to
impair LTR Retrotransposons transcriptional silencing (Cavrak et al., 2014; Hirochika, 1995; Grandbastien et al., 2005; Salazar et al., 2007). For example, a recent study demonstrated heat induced transient loss of transcriptional gene silencing in retrotransposon associated sequences in Arabidopsis
(Pecinka et al., 2010). This reduction appeared to be independent of methylation levels but rather associated with a genome wide loss of nucleosome density. More evidence of the role of
retrotransposons in stress response comes from several endogenous stress promoters sharing strong
sequence similarities with LTRs (White et al., 1994). In fact, some plant elements have cis-regulatory elements associated with plant defense response mechanism in their promoter (U3 region of LTR 5′) (Salazar et al., 2007; Cavrak et al., 2014). Since retrotransposon promoter elements are targeted by similar defense-induced transcription factors as those of plant defense genes, their transcriptional
activity can be activated by stress conditions (Casacuberta and Santiago, 2003). This is evident in heat
stress transcription activation of a Ty1/copia-type LTR Retrotransposon named ONSEN
(ATCOPIA78) in Arabidopsis (Pecinka et al., 2010; Tittel-Elmer et al., 2010). Transcription of
ONSEN-related sequences after heat stress was also observed in most species of the Brassicaceae (Ito
et al., 2013), demonstrating a conserved mechanism of activation
Besides heat induced transcriptional activation of retrotransposons, a recent publication
described heat induced retrotransposition of ONSEN (Cavrak et al., 2014). Not only was there heat activation transcription of this retrotransposon by a heat-responsive element present within its own
sequence, full length extrachromosomal DNA was found under elevated temperatures. Interestingly,
extrachromosomal ONSEN DNA was found to be capable of reintegrating into the genome, which was especially obvious in dividing cells from the meristematic tissue of the shoot. Therefore, although
retrotransposons are usually transpositionally inactive, there are few that have held their capacity to
transpose and are activated only under stress situations (Kumar and Bennetzen, 1999; Cavrak et al., 2014).
DNA damage and double-strand breaks
The genome of plants is under constant attack from endogenous and exogenous DNA
damaging factors, such as reactive radicals, radiation, and genotoxins (reviewed in, Yoshiyama et al., 2013). As described above, heat stress can cause numerous deleterious effects on the cell, thus being a
relevant source of possible DNA damage. Heat induced DNA lesions can be in the form of single
strand breaks (SSBs) and/or double strand breaks (DSBs). During the past 10 years, several research
10 more damaging as the cell has no intact strand to direct repair. DSBs can therefore lead to significant
karyotypic instability and possible cell death (Bennett et al., 1993; Bennett et al., 1996).
For damage control and subsequent repair, DSBs detection by distinct sensor proteins is
essential, with MRE11/RAD50/NBS1 (MRN) complex being the initial sensor of DSBs in both plants
and animals. Once DSBs are detected by this complex, the ATAXIA TELANGIECTASIA
MUTATED (ATM) pathway is triggered at the DSB sites (Rupnik et al., 2010). Subsequently, phosphorylation of specific targets by ATM kinase activity occurs, including Ser-139 in the
C-terminus of H2AX, which is a variant of the core histone H2A (Dickey et al., 2009). Immunocytochemically, it was shown that a single γH2AX focus corresponded to one DSB (Sedelnikova et al., 2002). Relevantly, heat has been shown to stimulate the phosphorylation of histone H2AX, reinforcing the idea that the increase of heat causes DSBs (Kaneko et al., 2005; Hunt
et al., 2007; Takahashi et al., 2008; Laszlo and Fleischer, 2009a,b).
DNA double strand-break (DSB) repair mechanism
Once DNA DSBs are detected by the cell, a number of complex processes occur to recruit the
machinery necessary for subsequent damage repair. There are three well conserved repair mechanisms
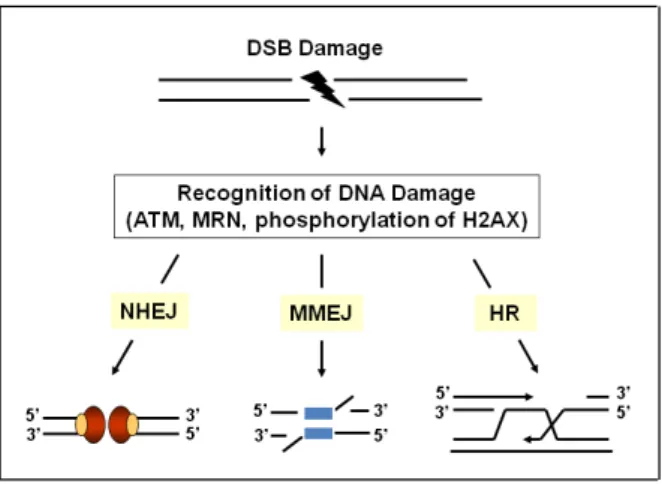
for DNA double strand breaks in eukaryotes, as shown in Figure 1.4 (Kim et al., 2013). The first mechanism of repair, non-homologous end joining (NHEJ), is active during G0/G1 and early S phases
and involves direct ligation of DNA end breaks. Since this pathway is independent of a homologous
template, it is highly prone to error (Bleuyard et al., 2005). The second repair mechanism, namely microhomology mediated end joining (MMEJ), shares repair proteins with the NHEJ pathway but
utilizes a short (5-25 base pairs) homologous sequence to align the broken strands before joining
(Bleuyard et al., 2005). Contrary to NHEJ, MMEJ repair is known to occur mostly during the S-phase of the cell cycle (reviewed in Yoshiyama et al., 2013). Homology-directed repair, or homologous recombination (HR), is the third mechanism for DSBs damage repair (Figure 1.4). HR occurs mainly
during late S and G2 phases of the cell cycle after replication of the genome since it depends on
homologous chromosome alignment (Kimura and Sakaguchi, 2006). This mechanism requires an extensive 5’-3’ portion of DNA to generate a 3’ single-stranded tail, which is then displaced by the RAD51 recombinase and forms a RAD51/ssDNA nucleofilament that invades the homologous DNA
double strand molecule (Dudas and Chovanec, 2004; Symington, 2002). This process, named strand
exchange, forms a DNA crossover or Holliday junction which provides a primer to initiate new DNA
11 Figure 1.4 – Three main DNA double-strand break (DSB) repair mechanisms in eukaryotes. DSBs are recognized by MRN complex and ATM, leading to phosphorylation of H2AX. Depending on cell cycle, DSB repair can occur through nonhomologous end joining (NHEJ), microhomology-mediated end joining (MMEJ), or homologous recombination (HR) repair pathways. Figure adapted from Kim et al., 2013.
In the majority of mitotically inactive cells, the DNA DSBs are repaired by a non-homologous
end joining (NHEJ) pathway (reviewed in Yoshiyama et al., 2013). This mechanism requires a coordinated assembly of damage-responsive proteins at the damage site for direct rejoining of the
separated DNA breakpoints, as shown in Figure 1.5. In NHEJ, DSB repair is initiated by binding of
the Ku70-Ku80 complex to the DSB ends and recruitment of DNA-dependent protein kinase catalytic
subunit (DNA-PKcs), a 465-kDa ser/thr kinase that mediates synapsis of DNA breakpoints prior to
auto-phosphorylation (Hartley et al. 1995). This is followed by the recruitment of Artemis, a nuclease and kinase/phosphatase (Caldecott, 2008; Pannicke et al., 2004; Ma et al., 2005). Lastly, the recruitment of the X-RAY REPAIR CROSS-COMPLEMENTING PROTEIN 4 (XRCC4) in
conjunction with DNA Ligase IV (Lig4) forms a complex, which is essential for the final step of DNA
breakpoint end joining (Grawunder et al., 1997; Critchlow et al., 1997).
13
2 - Materials and Methods
2.1 - Plant Material and Heat Treatments
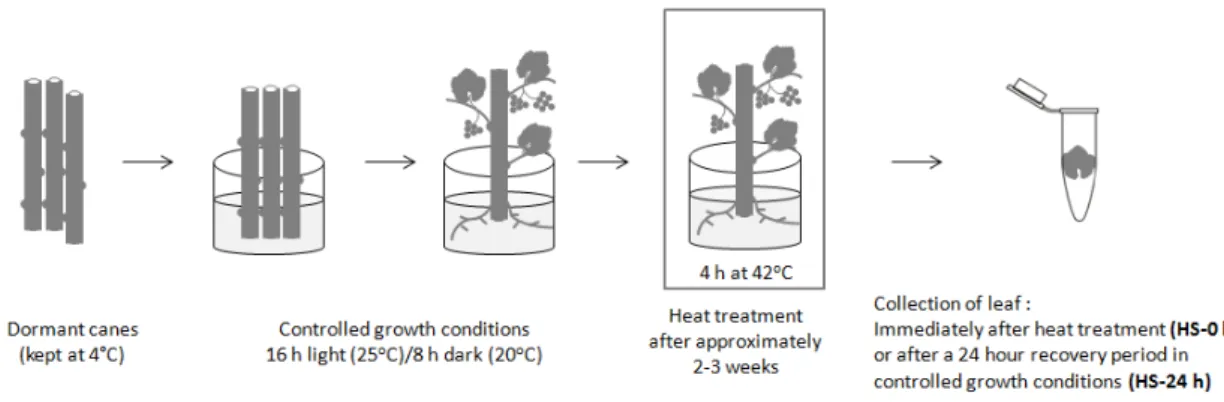
Vitis vinifera L. Cv. Touriga Nacional canes were collected from an experimental population in Northern Portugal (Quinta da Leda, Douro), and maintained for approximately 3 months at 4 oC in complete darkness until use. Heat stress treatment was performed as illustrated in Figure 2.1.1 and
described below.
2.1.1 - Controlled growing conditions
In order to obtain leaves for posterior molecular analysis, dormant canes were removed from
the cold room at 4 oC and the proximal portions cut into approximately 20 cm shoots. These were cautiously washed in 3 % (v/v) bleach, placed in water and allowed to develop roots, leaves and
inflorescences in a growth chamber with a 16 h light (24 oC)/8 h dark (20 oC) cycle for approximately 2 to 3 weeks, until the majority of leaves contained diameters of 1-2 cm. For collection of control leaf
material, young leaves (< 2 cm diameter) were removed from untreated canes simultaneously with
corresponding heat stress samples and designated as Control 0 hours 0 h) and Control 24 hours
(C-24 h).
2.1.2 - Heat stress conditions
The heat stress treatment was performed as previously described in Pereira et al., 2014 and shown in Figure 2.1.1. Plants with growing roots, leaves and inflorescences were transferred from
controlled growing conditions and placed at 42 oC for 4 h in controlled humidity. After heat stress, leaves with 1 to 2 cm diameter were either collected immediately (HS-0 h) or canes were returned to
14 Young leaves (<2 cm diameter) from both control and heat stresses plants were collected,
immediately frozen in liquid nitrogen and stored at -80 °C for subsequent extraction of genomic DNA
or RNA for molecular analysis. Once leaves were removed from developing plants, the respective
cane was discarded and not used for further analysis.
Figure 2.1.2 – Heat stress treatment. Dormant canes maintained at 4 oC were transferred to controlled growth conditions (16 h light (25 oC)/8 h dark (20 oC)) for approximately 2-3 weeks. For heat stress treatment, plants were exposed to 42 oC for 4 hours at controlled humidity. Young leaves were collected right after the heat treatment (HS-0 h) or returned to controlled growing conditions for 24 h before collection (HS-24 h). Figure adapted from Pereira et al. 2014.
2.2 - DNA Extraction
For genomic analysis, DNA was extracted utilizing the CTAB method (Thomas et al., 1993), as routinely performed in the laboratory and described in detail in (S 1). Approximately 1 g of frozen
leaf tissue from the control or stressed plants was ground to a fine powder in liquid nitrogen for DNA
extraction. After extraction, genomic DNA integrity was analyzed by 1 % (w/v) Agarose gel
electrophoresis and its concentration and purity determined via Nanodrop.
2.3 - Analysis of
Gret1
copy number by Real-Time PCR
Quantitative Real Time PCR (qRT-PCR) with the Bio-RAD IQ5 Multicolor Real-Time PCR
Detection System was utilized to quantify the number of copies of Gret1 related sequences in control plants or plants that had undergone heat stress treatment. The set of primers used is shown in Table
15 was done in triplicate). To quantify the number of Gret1 related sequences, three sets of primers specific for different segments of the Gret1 LTR (LTR1, LTR2 and LTR3) and one primer pair specific for the coding sequence of the reverse transcriptase (rt) domain of the pol gene were utilized.
The BIO-RAD kit IQ SYBR Green Supermix (Bio-Rad Cat # 170-8880S, Hercules, CA,
USA) was utilized for PCR on genomic DNA from control plants and stressed plants as described in the manufacturer’s protocol. Each 20 µl reaction mixture contained: 1 µL of DNA, 10 µL of SYBR and 20 pmol of each primer. The program of qRT-PCR and their respective conditions were followed
as described in (Pereira et al., 2009). Cycle conditions used were: 25 cycles (95 oC 5 min, 35 cycles of 95 oC, 1 min; 55 oC, 1 min; and 72 oC, 1 min, and a final elongation step of 72 oC for 5 min).
For analysis of number of copies, only reactions with dissociation curves with unique peaks
and expected dissociation temperatures were used. Titration curves were calculated for control and
stressed plants using the amplicon of the VVS2 as a reference and triplicates for each DNA dilution. For this, average Ct-values of each dilution on the x axis and logarithm number of copies on the y axis were plotted thereby allowing for estimation of a regression line (log # copies = x (the average
Ct-value) + a, where R2 was fixed as always higher than 0.9. Replacing the b in the regression line with
the Ct-value mean of each sequence, will give the number of copies present in the genome of each segment amplified (Table 2.3).
Student's t-test (two-tailed distribution , type 3- unequal variance) was used to analyze putative
effects of heat stress on the number of Gret1 related sequences between control and heat treated plants
(HS-0 h and HS-24 h) . All data was analyzed separately for biological and experimental replicates
with the program Microsoft® Office Excel 2007.
Table 2.3– Primers utilized in the qRT-PCR to quantify the Gret1 related sequences.
Primers Sequence
Gret1LTR1-forward 5`-GACACGCAGCACGTGTTATC
Gret1LTR1-reverse 5`-ATGAAGGTTGTCCGGATGTC
Gret1LTR2-forward 5`-GGGTCGAGGTGACAACAAGT
Gret1LTR2-reverse 5`-GAGGATCCCCTTCTTCTTCG
Gret1LTR3-forward 5`-CATGGCTAACAAAACCATCG
Gret1LTR3-reverse 5`-TGTTACCTCGCGTCTTTGG
Gret1-RT-forward 5`-CGAGTTTGTGTAGATTACAC
16
2.4 - REMAP and IRAP
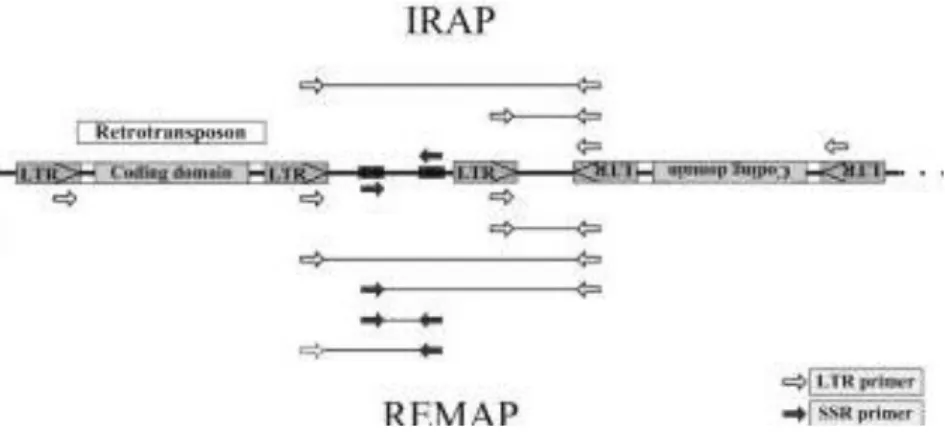
REMAP and IRAP PCR based techniques were realized as previously described in Pereira et al. 2005 with primers shown in Table 2.4, which were designed to amplify genomic regions up or downstream of Gret1 LTRs and/or flanking simple sequence repeats (SSR) as shown in Figure 2.4. In IRAP, PCR products are amplified from two nearby retrotransposons (Gret1 LTRs) using outward-facing primers. In REMAP, amplification products include genomic regions between retrotransposons
as well as those proximal to simple sequence repeats (SSRs).
IRAP and REMAP PCRs were performed in 20 μL reaction mixtures containing 50 ng of genomic DNA with the following cycling conditions, 25 cycles (95 oC 5 min, 25 cycles of 95 oC, 1 min; 65 oC, 1 min; and 72 oC, 1 min, and a final elongation step of 72 oC for 5 min). PCR products were separated by 1 % (w/v) agarose gel electrophoresis.
Figure 2.4 – IRAP and REMAP PCR. In IRAP, LTR primers (white arrows) amplify genomic DNA flanking retrotransposons or loose LTRs in opposite orientations. In REMAP, LTR primers are utilized with SSR primers (black arrows), resulting in amplification of genomic regions flanking retrotransposons or loose LTRs in opposite orientations and SSRs. Altered from Bento et al., 2008
Table 2.4 - Primers utilized for Gret1 based REMAP and IRAP.
REMAP e IRAP Sequence
Gret1LTR-forward 5`-CAACTAATTTATATTCC TCTCTCTAACCA
Gret1LTR-reverse 5`-CGTGTTTCCCAGAGGGAGGGGTCCCTAC
Microsat-GA 5`-(GA)9C
17
2.5 - Southern Blotting
Southern Blotting was performed to analyze putative effects of heat on the organization of
Gret1 related sequences in the genome. For this, genomic DNA (5 µg) of each sample was digested with isoschizomer restriction enzymes HpaII or MspI, according to manufacturer´s instructions (New England Biolabs, Ipswich, MA, USA). Both enzymes cut the sequence CCGG, however unlike HpaII,
MspI can cleave the sequence when the internal C residue is methylated. Digested DNA was then separated by 1 % (w/v) agarose gel electrophoresis and subsequently transferred to a membrane
Hybond N + (Amersham, Piscataway, NJ, USA) using the alkaline method. For this, Agarose gel
containing genomic DNA was placed in 0.25N HCl to denature the DNA prior to capillary transfer in
an alkaline environment to improve the binding to the membrane. Membranes containing DNA were
exposed to UV radiation for 5 min in order cross-link DNA to the membrane. Probe hybridization and
detection was performed with non-radioactive chemiluminescent ECL, following manufacturer´s
instructions (Amersham, Piscataway, NJ, USA), with slight modifications in the concentration of the
LTR2 probe utilized. The LTR2 has 237 base pairs and has no recognition sites for the HpaII or MspI enzymes according to the complete Gret1 published sequence (Kobayashi et al., 2004). Instead of the suggested concentration, we utilized 5ng LTR2 specific DNA per cm2 of membrane surface area. Probe for HindIIIdigested ƛ DNA was utilized as described for molecular weight marker and technical control. All other methodologies, including hybridization with 82 % stringency (0.3 M NaCl), washing
and subsequent detection were carried out following manufacturer´s instructions.
2.6 - Whole Genome analysis using Amplified Fragment Length
Polymorphism (AFLP)
2.6.1 - AFLP Technique
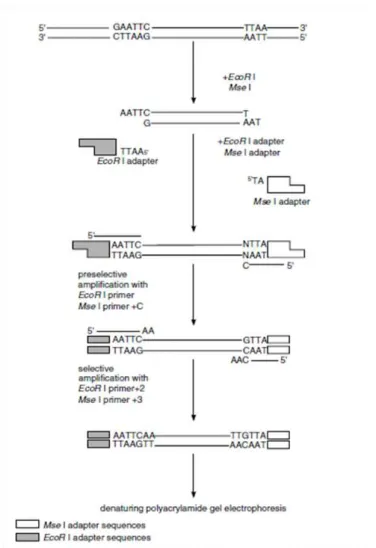
AFLP was performed as described in the manufacturer`s instructions with a few modifications
(AFLP Analysis System II, Cat. # 10717-015, Invitrogen-Life Technologies, Carlsbad, CA, USA). As
illustrated in Figure 2.6.1, the first step was the digestion of genomic DNA with two restriction
endonucleases, EcoRI and MseI, which have a 6 bp and a 4 bp recognition site respectively. Together these two enzymes generate small DNA fragments (< 1000 bp) which can be utilized for subsequent
amplification. After heat inactivation of the restriction endonucleases, fragmented DNA was incubated
with EcoRI/MseI adapters and T4 DNA ligase. The result is adaptor sequences flanking the genomic DNA sequences, which can be utilized as primer binding sites for the next amplifications
Next, pre-amplification PCR was performed with the fragmented genomic DNA containing
18 using the following cycling parameters: 30 cycles of 30 sec at 94 °C and 60 sec at 56 °C and 60 sec at
72 °C. Due to primer design and amplification techniques, the EcoRI-MseI fragments are preferentially amplified, rather than EcoRI-EcoRI or MseI-MseI containing fragments. The pre-amplification product was diluted and stored for selective pre-amplifications.
The second PCR amplification, called selective amplification, primers with selective
nucleotides in the 5´ extremity (three for the MseI and two for the EcoRI) are utilized to significantly reduce the number of fragments amplified (between 10 to 100). In this work, primers CTT,
Mse-CAA, Mse-CAC, Mse-CAT, Mse-CTG Eco-TC, Eco-TG, Eco-AG, Eco-TA, Eco-TT were used for
selective amplification. Reaction conditions were 12 cycles with annealing temperatures starting at 65
°C and decreasing by 0.7 °C in each cycle until 56 °C followed by a further 23 cycles with 56 °C
annealing temperature.
19
2.6.2 - Separation of AFLP fragments by Denaturing Polyacrylamide gel electrophoresis
AFLP fragments were analyzed by denaturing polyacrylamide electrophoresis with a
Sequi-Gen Nucleic Acid Electrophoresis Cell (Bio-Rad Cat #165-3863, Hercules, CA, USA) which supports
a 38 x 50 cm (width x length) glass plate. For each run, glass plates were carefully cleaned and treated
with 1.5 mL of the bind silane solution (1.5 µL bind silane + 1425 µL ethanol + 75 µL acetic acid)
and 2 mL of repel silane in the glass plate from the electrophoresis structure. For gel setting, the
apparatus was assembled with 0.4 mm spacers and a 6 % (v/v) polyacrylamide gel with 7.5 M urea,
and 1x TBE buffer (0.89 M Tris, 0.89 M Borate, 0.020 M EDTA) was injected and allowed to solidify
over-night.
Prior to electrophoresis of AFLP fragments, a pre-electrophoresis run at constant power (2000
V, 75 W, 100 mA) with a maximum temperature of 55 oC was carried out for 60 min. Selective Amplification PCR products were prepared for electrophoresis by adding 4 μL loading buffer (98 % (v/v) formamide + 2 % (v/v) 0.5M EDTA pH 8 + xylene cyanol) to 4 μL selective amplification
product and denaturing DNA for 3 min at 94 °C. After denaturing, samples were maintained on ice until loading 6 μL into a sharktooth comb. For molecular marker, 3 μL of the 25 bp DNA ladder (Invitrogen-Life Technologies, Cat #10597-011, Carlsbad, CA, USA) was utilized. Electrophoresis
was carried out with the same constant as the pre-electrophoresis run until xylene cyanol (slower dye)
reach two-thirds down the length of the gel (approximately 3 hours and 30 min).
After each run, the glass plates in electrophoresis structure were carefully separated and the
plate with bind silane containing the polyacrylamide gel was submitted to a silver staining method as
described in Bassam et al., 1991 (S 2). After staining, the polyacrylamide gels were allowed to dry before being photographed and analysed in detail for possible polymorphisms Adobe Photoshop 7.0.
All bands appearing exclusively in heat stressed leaves or missing in heat stressed leaves were
considered polymorphic. For further characterization, polymorphic bands were removed from the
polyacrylamide gel using a small blade, mixed with 30 µL of dH2O, heated at 95 o
C for 5 mins and
immediately placed ice. Once centrifuged for 2 min at max speed to deposit the polyacrylamide, the
suspended DNA was then utilized as template for PCR with equivalent specific selective primers using
the same PCR program utilized for the selective amplification. Polymorphic PCR product were
analyzed by 1 % (w/v) agarose gel electrophoresis, isolated, gel purified using the Pure Link Quick
Gel Extraction Kit (Invitrogen-Life Technologies, Cat #K210012, Carlsbad, CA, USA) and sent for
20
2.6.3 - Genomic Analysis of identified AFLP Polymorphism
Polymorphic AFLP fragments were further analyzed in order to identify putative heat induced
breakpoints in genomic DNA. Once removed from polyacrylamide gel and sequenced, the collected
data was compared to the grapevine genome available at genoscope
(http://www.genoscope.cns.fr/externe/GenomeBrowser/Vitis/) by BLAST-Like Alignment Tool
(BLAT). Genomic sequences mapping within and flanking polymorphic fragments were utilized to
design primers that permit the identification of putative heat induced breakpoints. These primers were
then utilized for PCR on genomic DNA from control and heat stressed plants (HS-0 h, HS-24 h) where
20 µL PCR mix contained 20 ng of genomic DNA, 1.5 mM MgCl2, 20 pmol of each primer, 0.25 mM
dNTP (deoxyribonucleotide triphosphates), and 1 U Taq polymerase. Reaction conditions were 25 cycles (95 oC 5 min, 25 cycles of 95 oC, 1 min; 65 oC, 1 min; and 72 oC, 1 min, and a final elongation step of 72 oC for 5 min). PCR products were separated by 1.5 % (w/v) agarose gel electrophoresis.
2.7 - RNA extraction and cDNA synthesis
For gene expression analysis, RNA was extracted as described in Chang et al., 1993 (S 3) from young leaves (< 2 cm) collected from control canes or canes which had been exposed to heat
stress (HS-0 h, and HS-24 h). After extraction, RNA integrity was analyzed by 1 % (w/v) Agarose gel
electrophoresis, and its concentration and purity determined using Nanodrop.
Prior to cDNA synthesis, 5 µg of total RNA was utilized for RNase free DNase digestion,
using the kit RQ1 RNase-Free DNase (Promega, Cat # M6101, Madison, WI, USA). SuperScript III
First-Strand Synthesis System for RT-PCR was used for first strand cDNA synthesis with random
hexamers (dN6) following manufacturer's instructions (Invitrogen-Life Technologies, Cat #
18080-051, Carlsbad, CA, USA)
2.8 - Quantitative Real Time (qRT-PCR)
BIO-RAD IQ5 Multicolor Real-Time PCR Detection System was utilized to analyze heat
induced differences in transcript levels. PCR reactions were performed with the SsoFast EvaGreen
Supermix (Bio-Rad Cat # 172-5203, Hercules, CA, USA) where each 20 µL reaction mixture
contained 1 µL of cDNA (diluted 1:5 or 1:10) and 20 pmol of sequence specific primers and cycling
double-21 strand break repair mechanism, rad50 and xrcc4; and one AFLP polymorphic fragment. Table 2.3 shows primers for Gret1 related sequences, LTR1, LTR2 and LTR3. All qRT-PCR experiments were repeated at least twice with three replicates per sample/primer combination in each experiment. All
comparisons of expression levels were performed on identical cDNA dilutions.
Dissociation curves were observed to confirm correct single amplification products with
expected denaturing temperatures. To ensure expected amplicon size, qRT-PCR products were
separated by 1.5 % (w/v) agarose gel electrophoresis. For analysis of differential transcript levels,
product threshold cycles (Ct) were normalized with mean Ct of control genes (Actin2 and NADH) to
calculate ΔCt (ΔCt = Ct of interest - mean Actin2 or NADH Ct). ΔΔCt was utilized to calculate fold
change (2-ΔΔCt) in expression levels between control and treated plants, where ΔΔCt = ΔCta - mean
ΔCtb, where a and b are being compared). Mean fold change (2
-ΔΔCt
) ± standard deviation and
statistical analyses such as Student's t-test between control plants and plants submitted to heat stress
were analyzed for all sequences using the program Microsoft® Excel 2007.
Table 2.8 –Primers utilized in the qRT-PCR to quantify Vitis vinifera expression.
Primers
Sequence
Actin2 - Forward
5´- GCTGGATTCTGGTGATGGTGTGAGActin2 - Reverse
5`- CAATGAGAGATGGCTGGAAGAGGACNADH dehydrogenase subunit B - Forward 5`- TGCAAGCATATGTTTCATGC
NADH dehydrogenase subunit B - Reverse 5`- CTGCTTCAGCTTCAGCCACT
Hsp90 - Forward
5`-AACTGAGAAAGAGATCAGTGATGATGHsp90 - Reverse
5`-GATAGTCCTCCCAGTCATTGGTCAGRad 50 – Forward 5`- GGAGAAGTTAAGGGATGAGCAA
Rad 50 – Reverse 5`- CCTCAACCAAACGATCAAGC
Xrcc4 – Forward 5`- CTGCACGCATCGTATCAAGT
Xrcc4 – Reverse 5`- CCGTCGGTGATAGAGAGGTG
AFLP Fragment - Forward 5`- GAATCCTTCATCAGTGGTTGTGAATG
22
2.9 - Bioinformatic Analysis
The freely available program Primer3Plus
(http://www.bioinformatics.nl/cgi-bin/primer3plus/primer3plus.cgi/) was utilized for primer design. Primers for Gret1 related sequences were designed based on the complete Gret1 (accession number AB111100.1). All sequences identified
in this work were compared against the Grape Genome Browser
(http://www.genoscope.cns.fr/externe/GenomeBrowser/Vitis/) by BLAT (8X) and BLAST. This grape
genome database was also utilized to design gene specific primers, based on homology between gene
sequences of model plant species and Vitis vinifera. Sequence comparisons were carried out using the free software Multialin, which uses a multiple sequence alignment with hierarchical clustering
(http://multalin.toulouse.inra.fr/multalin/). All primer sequences and expected qRT-PCR amplification
products were analyzed with the freely available Oligonucleotide Properties Calculator
(http://www.basic.northwestern.edu/biotools/oligocalc.html) to verify guanine/cytosine content and
23
3
–
Results and Discussion
3.1
–
Heat stress induced alterations on genomic structure
3.1.1 Heat stress treatments had no visible effects on vegetative development
Heat stressed plants (HS-0 h, and HS-24 h) maintained in controlled growing conditions
continued to develop roots, leaves and inflorescences identically to control plants, as previously
described (Pereira et al., 2014). Regarding heat stress directly applied during reproductive growth, although leaves were slightly wilted after exposure to 42 oC for four hours (HS-0 h), they were indistinguishable from control plants after a 24 hour recovery period in controlled conditions (HS-24
h).
3.1.2- Integrity and concentration of genomic DNA
After DNA extraction, genomic DNA integrity, concentration and purity was checked for all
samples utilizing by 1% (w/v) agarose gel electrophoresis and Nanodrop. Only samples with high
quality genomic DNA were utilized for subsequent analysis, evident as single strong high molecular
weight bands at the top of the gel and lack of smear demonstrating that the DNA is not fragmented, as
shown in Figure 3.1.2. High quality genomic DNA was further supported by Nanodrop results, which
showed concentrations ranging from 250 to 500 ng/µL and 260/280 ratios between 1.8 and 1.9,
24 Figure 3.1.2 – Image of genomic DNA analyzed by 1 % Agarose gel electrophoresis with molecular weight marker (M, 1 Kb+ ladder with molecular weights shown in base-pairs) from biological replicates of control and heat stressed samples. Genomic DNA is shown from plants grown in controlled conditions and collected at 0 hours (C-0 h) or 24 hours (C-24 h), and heat stressed plants collected immediately after treatment (HS-0 h) or after a 24 hour recovery period (HS-24 h). High quality non-fragmented genomic DNA is evident as single sharp bands with high molecular weight for all samples.
3.1.3 - Heat induced alterations in the number of Gret1 related sequences
The number of Gret1 related sequences was compared between control plants (C-0 h and C-24 h) and those exposed to heat stress and collected immediately after treatment (HS-0 h) and after a 24
hour recovery period (HS-24 h). Three Gret1 related sequences mapping to the LTRs (LTR1, LTR2, and LTR3) as well as one sequence for the reverse transcriptase (rt) as shown in figure 3.1.3.1 were quantified.
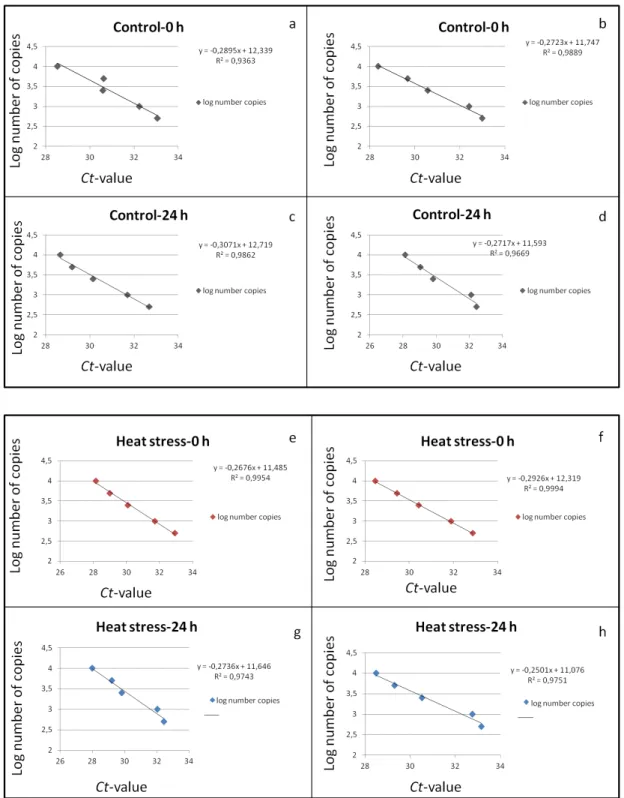
25 In order to quantify the number of Gret1 related sequences in each sample, regression lines were calculated using the Ct-values of the single SSR locus VVS2 for two biological replicates of
genomic DNA isolated from controls and treatments. The eight regression lines and respective
equation are demonstrated in Figure 3.1.3.3.
Figure 3.1.3.3 – Representation of regression lines calculated for all biological replicates correspondent to the Control-0 hours (a and b), Control-24 hours (c and d), Heat stress-0 hours (e and f) and Heat stress-24 hours (g and h). The coordinate axis (y) represents the log number of copies and the abscissa axis (x) the Ct-values from