Tânia Sofia Cardoso Ribeiro Rebelo
Mestre em Engenharia Química
–
Otimização Energética na
Indústria Química
Improving the early diagnostic of prostate cancer
by multiple biomarker detection with new
biosensing devices
Dissertação para obtenção do Grau de Doutor em
Química Sustentável
Improving the early diagnostic of prostate cancer by multiple biomarker
detection with new biosensing devices
Copyright © [Tânia Sofia Cardoso Ribeiro Rebelo], Faculdade de Ciências e Tecnologia, Universidade Nova de Lisboa.
Bolsa de Doutoramento da Fundação para a Ciência e a Tecnologia com a referência SFRH/BD/79221/2011, financiada pelo POPH – QREN – Tipologia 4.1
Dedico esta dissertação ao meu marido, Rui Rebelo, pela paciência que demonstrou ao longo destes 4 anos, mas principalmente por todo o carinho, apoio e dedicação.
ix
confidence she had on me, for all the availability, encouragement and patience demonstrated at various times over the last four years.
To Prof. João Paulo Noronha for accepting the supervision of this work, for the support and scientific contribution.
To Prof. João Rodrigues for the dedication, help, and scientific contribution.
To Prof. Carlos Pereira from Centro de Investigação em Química, Faculdade de Ciências da Universidade do Porto for his help, dedication, affection and hospitality with which he received me in his group.
To all my colleagues of the CIQ group for all the help, the constructive discussions, friendship and mainly the companionship. I thank to Renata Costa, Paula Fernandes, Inês Miranda, Tatiana Andreani, Nuno Pereira, José Ribeiro and all others colleagues.
To all my colleagues of the BioMarK group that, direct or indirectly, contributed to this work. I thank to Felismina Moreira, Joana Guerreiro and all others colleagues.
To all my friends for their comprehension and support. In particularly to Renata Costa and Sofia Almeida.
xi
Organização Mundial de Saúde). Os dados estatísticos mais recentes, relativos ao território português, confirmam este cenário, referindo que cerca de 50% dos homens portugueses poderão vir a padecer de cancro da próstata e que 15% destes morrerão desta condição.
A deteção precoce do cancro da próstata é por isso muito importante no sucesso do tratamento da doença. Atualmente, o rastreio é realizado através do biomarcador antigénio específico da próstata (PSA) que é excretado na urina. Todavia, aparecimento de resultados falsos positivos/negativos, é recorrente, levando a que os doentes sejam enviados desnecessariamente para procedimentos de biópsia. Este protocolo pode ser melhorado através do desenvolvimento de dispositivos de deteção do cancro da próstata em “point -of-care”, não só para o PSA mas também para outros marcadores.
Neste sentido, o presente trabalho tem como objetivo desenvolver sensores de baixo custo, baseados em novos biomateriais sintéticos, que permitam rastrear vários biomarcadores em culturas de linhas celulares do cancro da próstata, em amostras de sangue e em amostras de urina. Os biomarcadores considerados neste estudo são os seguintes: antigénio específico da próstata (PSA), anexina A3 (ANXA3), microseminoproteina-beta (MSMB) e sarcosina (SAR).
xii
comparados com anticorpos naturais. O crescimento destas unidades sensoras nanoestruturadas foi efetuada sobre um suporte sólido de carbono. A interação entre o biomarcador e o material sensor traduz-se na produção de sinais elétricos quantitativos ou semi-quantitativos. Estes dispositivos permitem a deteção
barata e portátil nos teste “point-of-care”.
xiii
(World Health Organization data). The most recent statistics, in Portuguese territory, confirm this scenario, which states that about 50% of Portuguese men may suffer from prostate cancer and 15% of these will die from this condition.
Its early detection is therefore fundamental. This is currently being done by Prostate Specific Antigen (PSA) screening in urine but false positive and negative results are quite often obtained and many patients are sent to unnecessary biopsy procedures. This early detection protocol may be improved, by the development of point-of-care cancer detection devices, not only to PSA but also to other biomarkers recently identified.
Thus, the present work aims to screen several biomarkers in cultured human prostate cell lines, serum and urine samples, developing low cost sensors based on new synthetic biomaterials. Biomarkers considered in this study are the following: prostate specific antigen (PSA), annexin A3 (ANXA3), microseminoprotein-beta (MSMB) and sarcosine (SAR).
xiv
Keywords: Biosensors; Prostate cancer biomarkers; Surface imprinting;
xv
“
O mundo está nas mãos daqueles que tem a coragem de sonhar e correr o
risco de viver seus sonhos.
”
xvii
List of figures ... xxv
List of tables ... xxix
List of abbreviations ... xxxi
1. Framework... 1
1.1 Motivation ... 1
1.2 Structure of the thesis ... 3
1.3 List of publications... 5
1.3.1 Papers published in international scientific journals... 5
1.3.2 Communications presented in national and international scientific conferences ... 6
1.4 References ... 6
2. Literature Review ... 9
2.1. Prostate Cancer ... 9
2.2. Prostate cancer biomarkers ... 10
2.2.1 Prostate specific antigen... 11
2.2.2 Annexin A3 ... 12
2.2.3 Microseminoprotein-beta ... 13
2.2.4 Sarcosine ... 14
2.3 Quantification of biomarkers ... 15
2.3.1 Immunoassays ... 15
xviii
2.3.3 (Bio)recognition elements... 19
2.3.3.1 Molecularly Imprinted Material ... 19
2.3.3.2 Enzyme ... 23
2.4 Transducers ... 26
2.4.1 Electrochemical ... 30
2.4.1.1 Potentiometry... 31
2.4.1.2 Amperometry ... 34
2.4.1.2.1 Voltammetry ... 35
2.4.1.2.1.1 Cyclic voltammetry ... 36
2.4.1.2.1.2 Square wave voltammetry ... 37
2.4.1.2.2 Chronoamperometry ... 39
2.4.1.3 Electrochemical impedance spectroscopy ... 40
2.5 Final considerations ... 42
2.6 References ... 42
3. Prostate Specific Antigen electrochemical sensor ... 55
3.1 Introduction... 55
3.2 Experimental ... 57
3.2.1 Reagents and solutions ... 57
3.2.2 Apparatus ... 59
3.2.3 Preparation of graphene oxide ... 59
3.2.4 Synthesis of protein imprinted material ... 60
3.2.5 Assembly of the potentiometric sensors ... 62
xix
3.3 Results and discussion ... 66
3.3.1 Plastic antibody design ... 66
3.3.2 Control of graphene modification ... 67
3.3.3 Performance of the Sensors ... 70
3.3.4 Effect of pH ... 73
3.3.5 Sensor selectivity ... 73
3.3.6 Liquid contact ISEs ... 74
3.3.7 Application ... 77
3.4 Conclusions ... 77
3.5 References ... 78
4. Annexin A3 electrochemical sensor ... 81
4.1 Introduction ... 81
4.2 Experimental Procedure ... 82
4.2.1 Reagents and solutions ... 82
4.2.2 Apparatus... 83
4.2.3. Synthesis of the protein-imprinted layer ... 83
4.2.4. Electrochemical procedures ... 85
4.2.5 Determination of ANXA3 in synthetic urine ... 86
4.3 Results and discussions ... 86
4.3.1 Optimization of the experimental conditions for ANXA3 detection ... 86
xx
4.3.3 Surface characterization morphological by AFM and Raman ... 90
4.3.4 Analytical performance of ANXA3 biosensor ... 93
4.3.5 Selectivity study and electrode stability ... 95
4.3.6 Application ... 96
4.4 Conclusions ... 97
4.5 References ... 97
5. Microseminoprotein-Beta electrochemical sensor ... 101
5.1 Introduction... 101
5.2 Experimental Procedure ... 102
5.2.1 Reagents and solutions ... 102
5.2.2 Solutions ... 103
5.2.3 Apparatus ... 103
5.2.4 Synthesis of PIM on carbon support ... 103
5.2.5 Electrochemical procedures ... 105
5.2.6 Determination of MSMB in synthetic urine and artificial serum ... 106
5.3 Results and discussions ... 106
5.3.1 Imprinting stage ... 106
5.3.2 Control of the surface modification by impedance measurement ... 107
5.3.3 Performance of the sensors ... 109
5.3.4 Selectivity study and electrode stability ... 111
5.3.5 Application ... 114
5.4 Conclusions ... 115
xxi
6.2 Experimental Procedure ... 118
6.2.1 Reagents and solutions ... 118
6.2.2 Apparatus... 119
6.2.3 Sarcosine Oxidase Immobilization ... 120
6.2.4 Electrochemical measurements/optimization... 122
6.2.5 Determination of sarcosine in synthetic urine ... 122
6.3 Results and discussions ... 123
6.3.1 Optimization of the experimental condition for sarcosine detection ... 123
6.3.2 Optimization of sensor construction method ... 126
6.3.3 Surface characterization morphological by AFM, Raman and FTIR ... 129
6.3.4 Evaluation of sarcosine biosensor ... 131
6.3.5 Selectivity study and electrode stability ... 133
6.3.6 Application ... 134
6.4 Conclusions ... 134
6.5 References ... 135
7. Testing the Variability of PSA Expression by Different Human Prostate Cancer Cell Lines ... 139
7.1 Introduction ... 139
7.2 Materials and Methods ... 141
7.2.1 Setup of the electrochemical biosensor ... 141
xxii
7.2.2.1 Total RNA extraction and qPCR analysis ... 142
7.2.2.2 DNA content ... 144
7.2.3 PSA levels in the culture media ... 144
7.2.3.1 Electrochemical Biosensor ... 145
7.2.3.2 ELISA assay ... 145
7.2.3.3 Statistical analysis ... 145 7.2.4 PSA identification by MALDI-TOF mass spectrometry ... 145
7.2.4.1 In solution digestion of proteins ... 145
7.2.4.2 Intact Protein by MALDI-MS ... 146
7.2.4.2.1 Sample clean-up ... 146
7.2.4.2.2 MALDI-TOF-MS analysis ... 147 7.2.4.2.3 Data analysis and database searching ... 147
7.3 Results ... 148
7.3.1 Characterization of the cell cultures ... 148
7.3.1.1 Cell proliferation... 148
7.3.1.2 Expression of prostate genes ... 149
7.3.2PSA levels in the culture medium... 151
7.3.2.1 Biosensor ... 151
7.3.2.2 ELISA assay ... 152 7.3.2.3 Data correlation ... 154
7.3.3 PSA identification by MALDI-TOF mass spectrometry ... 154
7.4 Discussion ... 155
xxiii
xxv
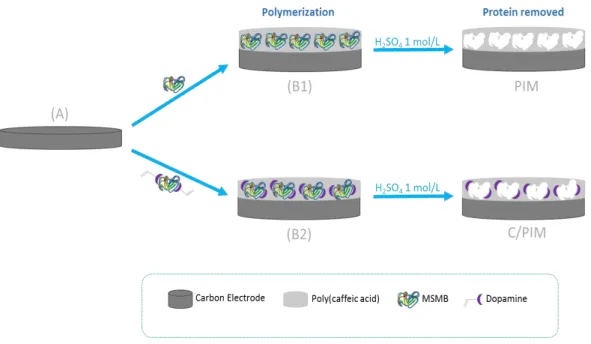
Figure 2.2: Generic scheme of molecular imprinting process. ... 19 Figure 2.3: Generic scheme of by electropolymerization. ... 22 Figure 2.4: Generic scheme of an enzymatic approach of biosensors. ... 24 Figure 2.5: Scheme of the ion-selective electrode construction of solid contact. A: syringe body; B: copper electrical wire; C: conductive carbon-based support material; D: casting of the selective membrane over the solid-contact. ... 33 Figure 2.6: Potential variation applied to the working electrode over time in CV: E i– initial potential; Ef- final potential; Emin – minimum potential; Emax –
maximum potential, tx– time for the reverse scan. ... 36
Figure 2.7: Typical voltammogram for a reversible system. ... 37 Figure 2.8: Schematic square-wave voltammogram of a redox reversible process. ... 38 Figure 2.9: Evolution of the current with time by applying a pulse potential to an electrode. In that If corresponds the faradaic current and Ic the capacitive current.
xxvi
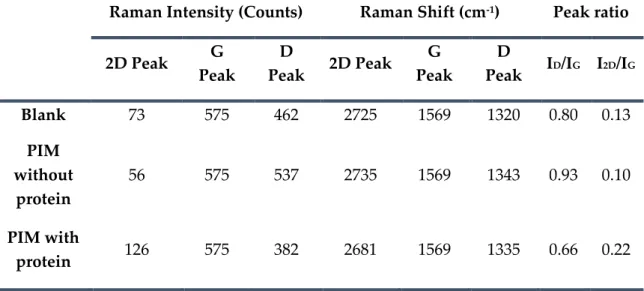
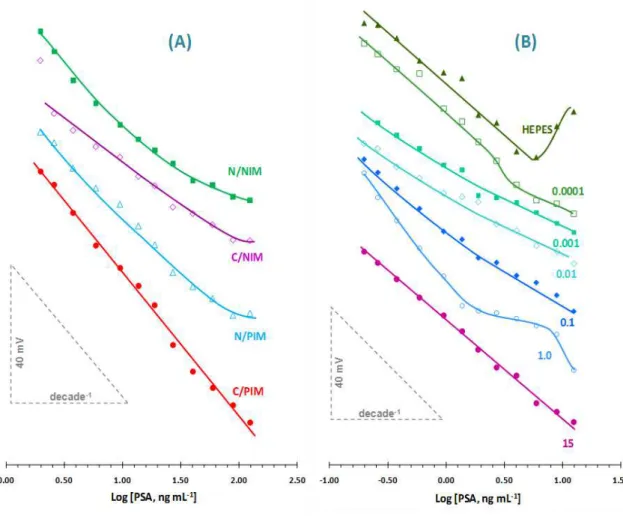
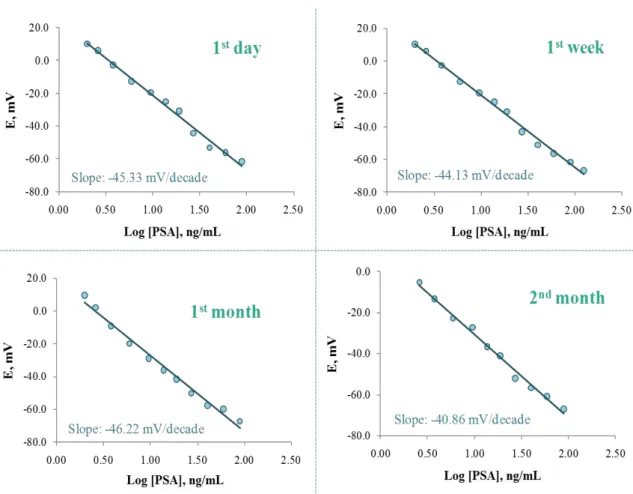
devices (B) prepared with C/PIM material and inner reference solutions of different PSA concentrations (expressed in nmol/L). ... 71 Figure 3.4: Several calibrations of the C/PIM device measured with the same electrode, under equal background conditions and within time. ... 72 Figure 4.1: Schematic representation of the synthetic process of PIM. ... 85 Figure 4.2: Calibration curves obtained for different concentration the electropolymerization of ANXA3 obtained by SWV measurements in 5.0 mM [Fe(CN)6]3− and 5.0 mM [Fe(CN)6]4− in PBS buffer, with range of ANXA3
concentration between 0.1-200 ng/mL. ... 87 Figure 4.3: EIS study over the subsequent modification steps of the carbon-SPE in 5.0 mM [Fe(CN)6]3− and 5.0 mM [Fe(CN)6]4− in PBS buffer... 88
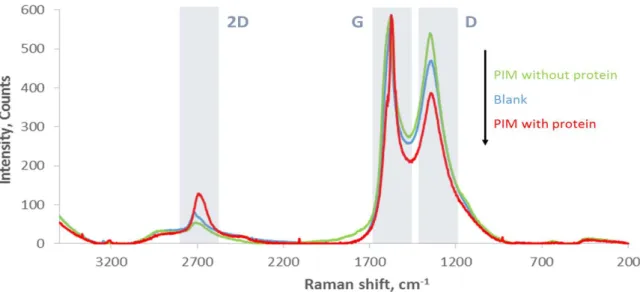
Figure 4.4: AFM images in 3D for the different modification of surface SPE-PIM electrode. A - Carbon surface, B - CAF electropolymerization and C - Protein removal; 1 - AFM images and 2 - Diagram electrode. ... 91 Figure 4.5: Raman Spectroscopy of the blank-SPE, PIM with protein and PIM without protein. ... 92 Figure 4.6: Calibration curve obtained of PIM based carbon-SPE biosensor obtained by SWV measurements in 5.0 mM [Fe(CN)6]3− and 5.0 mM [Fe(CN)6]4−
in PBS buffer. Inset: Linear calibration plot obtained for Annexin A3. ... 94 Figure 4.7: Calibration curve obtained of NIM based carbon-SPE biosensor obtained by SWV measurements in 5.0 mM [Fe(CN)6]3− and 5.0 mM [Fe(CN)6]4−
xxvii
Figure 5.2: EIS data over the subsequent modification steps of the carbon-SPE, in 5.0 mM [Fe(CN)6]3− and 5.0 mM [Fe(CN)6]4−, in PBS buffer. A: Materials without
oriented charges (PIM and NIM) and B: Materials with charged binding sites (C/PIM and C/NIM). ... 108 Figure 5.3: Calibration curves of PIM, C/PIM, NIM and C/NIM based carbon-SPE biosensors obtained by SWV measurements in 5.0 mM [Fe(CN)6]3− and 5.0 mM
[Fe(CN)6]4− PBS buffer. ... 111
Figure 5.4: Calibration curves displaying the effect of reused PIM and C/PIM carbon-SPE biosensors obtained by SWV measurements in 5.0 mM [Fe(CN)6]3−
and 5.0 mM [Fe(CN)6]4− PBS buffer. ... 113
Figure 6.1: Calibration curves obtained at different potential values using sensor # 9... 124 Figure 6.2: Calibration curves obtained for different concentrations of immobilized SOX (0.5, 1.0 and 2.0 mg/mL). ... 125 Figure 6.3: Analytical response of the chips fabricated in this work for the increasing concentrations values of SAR (concentration values indicated in the plot, expressed in mM). ... 126 Figure 6.4: Scheme of the immobilization process of SOX on SPE surface for sensor # 9. ... 127 Figure 6.5: EIS study over the subsequent modification steps of the carbon-SPE in 5.0 mM [Fe(CN)6]3− and 5.0 mM [Fe(CN)6]4− in PBS buffer. ... 128
xxviii
Figure 6.8: Calibration curve obtained for SAR in the concentration range used. Inset: Linear calibration plot obtained for SAR. ... 132 Figure 7.1: Schematic representation of the assembly of the conductive support (left) and the picture of the several integrant parts final device (right). 141
Figure 7.2: Cellular characterization of cell cultures. A– Cellular morphology at 7 days of culture, after hematoxylin/eosin staining method. Cell lines images: a– human skin fibroblasts, b – LNCaP, c – PC3 and d – PNT2. Bar represents 300 µm. B– Cell proliferation, assessed by total DNA quantification, of cell cultures maintained in different culture media for 14 days. ... 149 Figure 7.3: qPCR analysis of cell cultures. A – PSA, KLK2, KLK4, PCTA, PSCA, Prostein, PSMA, TGM4 and PrLZ expression by LNCaP, PC3 and PNT2 cell lines. B– p53, AR and FKBP52 expression by LNCaP cell line. ... 150 Figure 7.4: Potentiometric response of PSA selective electrodes prepared with imprinted and non-imprinted materials (ranging from 2.0 to 89.0 ng/mL, in 110 -4 mol/L Hepes buffer). ... 151
xxix
List of tables
Table 2.1: Biosensors for PCa biomarkers with different transducers and their detection range reported in the literature. ... 28 Table 3.1: Membrane composition of PSA sensors and the corresponding potentiometric features in 1.0×10⁻⁴ mol/L Hepes buffer. ... 63
Table 3.2: Comparison of PSA sensors with different inner electrolyte solutions.
... 76
Table 3.3: Potentiometric determination of PSA in serum using MIP oriented based membrane sensor. ... 77
Table 4.1: Fitting parameters extracted from electrochemical impedance data using the Randles type equivalent circuit. ... 88
Table 4.2: Values extracted from Raman spectra of the blank-SPE, PIM with protein and PIM without protein. ... 93
Table 4.3: Analytical performance of the ANXA3 biosensor in the presence of the interfering species used in the study. ... 96
Table 4.4: Determination of ANXA3 in urine samples. ... 97
Table 5.1: Fitting parameters extracted from electrochemical impedance data using the Randles type equivalent circuit for PIM-NIM. ... 109
Table 5.2: Fitting parameters extracted from electrochemical impedance data using the Randles type equivalent circuit for C/PIM-C/NIM. ... 109
Table 5.3: Calibration features of the biosensors in the PBS, serum and urine artificial. ... 114
Table 5.4: Determination of MSMB in serum and urine samples. ... 115
Table 6.1: Different procedures used in the modification of the electrodes surfaces. ... 121
xxx
Table 6.3: Analytical features of calibrations made in the presence/absence of interfering species. ... 133
Table 6.4: Determination of SAR in urine samples. ... 134
Table 7.1: Primers used in RT-PCR analysis of cell cultures. ... 143
Table 7.2: Quantification of PSA in culture media. ... 153
xxxi
List of abbreviations
A Ampere
AA Acrylamide
AFM Atomic-force microscopy
AMH 2-Aminoethyl methacrylate hydrochloride
ANXA3 Annexin A3
AR Androgen receptor
ATR Attenuated Total Reflectance
BOP Benzoyl peroxide
BPH Benign prostate hyperplasia
BSA Bovine Serum Albumin
CAF Caffeic Acid
cDNA Complementary Deoxyribonucleic acid
Cdl Capacitance of the double layer
C/NIM Charged Non-Imprinted Materials
C/PIM Charged Protein Imprinted Materials
CT Cycle threshold
CV Cyclic Voltammetry
DMEM Dulbecco's Modified Eagle Medium
DNA Deoxyribonucleic acid
DTT DL-Dithiothreitol
E Applied potential
EDAC N-ethyl-N-(3-dimethylaminopropyl) carbodiimide
xxxii
EDTA Ethylenediaminetetraacetic acid
EIS Electrochemical Impedance Spectroscopy
ELISA Enzyme linked immunosorbent assay
Emf Electromotive force
F Faraday
FB Human gingival fibroblasts
FBS Fetal bovine serum
FTIR Fourier Transformed Infrared
GO Graphene oxide
GUSB Beta-glucuronidase
HEPES 4-(2-hydroxyethyl)-1-piperazineethanesulfonic acid
hKLK3 Human kallikrein 3
Hz Frequency
I Electrical current
IAA Iodoacetamide
ISE Ion-Selective Electrode
IUPAC International Union of Pure and Applied Chemistry
Keq Equilibrium constant
KLK2 Kallikrein-2
KLK4 Kallikrein-4
KPOT Potentiometric selectivity coefficients
LLLR Lower limit of linear range
LOD Limit of detection
MALDI-TOF Matrix Assisted Laser Desorption Ionization Time-of-Flight
xxxiii
mRNA Messenger Ribonucleic acid
MS Mass Spectrometry
MSMB Microseminoprotein-beta
NHS N-hydroxysuccinimide
NIM Non Imprinted Materials
NIP Non Imprinted Polymer
NMAA N,N-methylenebis(acrylamide)
N/NIM Neutral monomers Non Imprinted Materials
N/PIM Neutral monomers Protein Imprinted Materials
oNPOE ortho-Nitrophenyloctyl ether
PBS Phosphate buffer solutions
PCa Prostate Cancer
PC3 Prostate cancer cell line
PCTA1 Prostate Carcinoma Tumor Antigen-1
PIM Protein Imprinted Materials
PMF Peptide Mass Fingerprint
PrLZ Prostate Leucine Zipper
PSA Prostate Specific Antigen
PSCA Prostate Stem Cell Antigen
PSMA Prostate-Specific Membrane Antigen
PSMB6 Proteasome subunit beta type-6
PSP94 Prostatic Secretory Protein 94
PVC Poly(vinylchloride)
QCM Quartz Crystal Microbalance
xxxiv
R Universal gas constant
Rct Charge transfer resistance
RMS Root Mean Square
RNA Ribonucleic acid
RPMI Roswell Park Memorial Institute - medium
Rs Resistance of the solution
RT-PCR Reverse transcription polymerase chain reaction
SAR Sarcosine
SOX Sarcosine Oxidase
SPE Screen-Printed Electrode
SPR Surface Plasmon Resonance
SWV Square Wave Voltammetry
T Temperature
t Time
TEM Transmission Electron Microscopy
TFA Trifluoroacetic acid
TGM4 Protein-glutamine gamma-glutamyltransferase 4
THF Tetrahydrofuran
ULLR Upper limit of linear range
UV Ultraviolet
VB Vinyl benzoate
VTA (Vinylbenzyl)trimethylammonium chloride
W Warburg diffusion element
WE Working electrode
xxxv
Z” Warburg impedance
α-CHCA Alpha-cyano-4-hydroxycinnamic acid
α-MEM Alpha-Minimal Essential Medium
ΔG Free energy change
1
Framework
1.1 Motivation
Prostate cancer (PCa) is the commonest form of cancer in men in Europe, with a 61.4 % incidence among all cancer diseases and 12.1 % mortality [1]. Accurate and early detection of PCa is thus very important, attributing early diagnosis a major role in the successful treatment of the disease.
Early detection of prostate cancer biomarkers is currently made by PSA screening in men over 45 years old, combined with other alterations in serum and urine parameters. However, in PSA testing, many false positive/negative results are obtained, thereby leading several patients to unnecessary biopsy procedures. In addition, a non-invasive method for an accurate diagnosis of PCa would decrease the discomfort of patients in routine analytical procedures, while permitting a significant reduction in the number of repeated biopsies in patients. Also, an early detection protocol could benefit from the screening of additional specific biomarkers that may complement PSA testing, or replace it over time.
Many other biomolecules besides PSA have been correlated to PCa [2, 3], but only a few of these molecules may turn out a successful biomarker for analytical purposes. These should have analytical suitability (measured by cost-effective assay, simple to perform, rapid turnaround time and sufficient precision and accurateness), clinical suitability (ability to influence therapy and to improve patient outcome) and specificity for prostate cancer (so that the identification and
2
characterization of a unique blood-based marker for the disease would provide a more accurate diagnosis, reducing both unnecessary biopsies and patient uncertainty). Thus, along with the currently used PSA, Annexin A3 (ANXA3), Microseminoprotein-beta (MSMB) and Sarcosine (SAR) are here considered as suitable as PCa biomarkers.
The conventional methods for screening PCa biomarkers include immunological-based assays that have to be established in laboratorial context. Electrochemical (bio)sensors are emerging as a promising alternative tool to the conventional methodologies mostly due to their portability/automation feasibility. They offer high robustness, easy miniaturization, excellent detection limits with small analyte volumes, and ability to be used in turbid biofluids with optically absorbing and fluorescing compounds. A suitable architecture may allow good sensitivity and selectivity with the desired biochemical event. The biomarker recognition may be established by means of molecularly imprinted polymers that are a kind of plastic antibodies, which show high sensitivity/selectivity and present much longer stability and a much lower cost than natural antibodies [4].
3
simple and inexpensive procedures, providing selective readings with low concentrations of analyte and low sample volumes. Furthermore, they may offer portable versions to carry out assays in point-of-care testing.
1.2 Structure of the thesis
This thesis is organized in eight chapters.
Chapter 1, the present chapter, gives the motivation of the present work,
describes the structure and the framework of the thesis and lists the publications and communications associated with this PhD research program.
Chapter 2 presents a literature overview about the main topics discussed in this
work: the prostate cancer biomarkers detection, the recognition elements and the transducing processes. Special relevant issues are focused on PSA, ANXA3, MSMB and SAR biomarkers.
Chapter 3 to 7 presents the construction, characterization and application of
biosensors for the quantification of different biomarkers.
Chapter 3 describes the synthesis of protein plastic antibodies tailored with
4
than point-of-care use. The device could be reused and hardly disposed of after each application.
Therefore, the construction of a disposable biosensor is essential for tests in point-of-care, and was reported in chapter 4, which describes the construction of a simple and low cost ANXA3 electrochemical biosensor by electropolymerization procedures on the carbon surface of a SPE. The monomer selected for this purpose was Caffeic acid (CAF), coexisting in solution with the target protein. The biosensor was successfully applied to spiked urine samples.
With the aim of improving the construction of the above biosensor, chapter 5 describes a molecular imprinting process over the surface of a carbon-SPE where charged labels in the imprinting stage enabled the production of a simple and low cost electrochemical sensor. This principle was applied to the determination of MSMB in biological fluids. The corresponding biosensor was obtained in the surface of a carbon-SPE by electropolymerizing CAF in the presence of MSMB and having dopamine as charged label.
In chapter 6, a biosensor device was developed for the quantification of sarcosine
via electrochemical detection of hydrogen peroxide, H2O2 (at 0.6 V), generated from the catalyzed oxidation of sarcosine. The detection was carried out after the modification of carbon-SPEs by immobilization of sarcosine oxidase (SOX), using
N-ethyl-Nʹ-(3-dimethylaminopropyl)carbodiimide (EDC) and N
5
The performance and effectiveness of the developed PSA biosensor, described in chapter 3, for screening PSA in biological fluids of complex composition, collected from different PCa cell line cultures, was studied in chapter 7. The electrochemical biosensor was able to specifically detect PSA in complex media and values obtained were similar to those achieved by a commercial ELISA kit, the most commonly used method for PSA quantification in PCa diagnosis. Thus, the described biosensor may represent a useful alternative as a diagnostic tool for PSA determination in biological samples.
Chapter 8 summarizes the main results obtained and presents guidelines for
future research work.
1.3 List of publications
1.3.1 Papers published in international scientific journals
1: Tânia S.C.R. Rebelo, Carlos M. Pereira, M. Goreti F. Sales, João P. Noronha and Fernando Silva, Protein Imprinted Materials designed with charged binding sites on screen-printed electrode for Microseminoprotein-Beta determination in biological samples, Sensors and Actuators B: Chemical, 2016, 223, 846-852.
2: Tânia S.C.R. Rebelo, Carlos M. Pereira, M. Goreti F. Sales, João P. Noronha and Fernando Silva, Protein Imprinted Materials electrochemical sensor for determination of Annexin A3 in biological samples, Electrochimica Acta, 2016.
6
4: Tânia S.C.R. Rebelo, Carlos M. Pereira, M. Goreti F. Sales, João P. Noronha, J. Costa-Rodrigues, Fernando Silva, and M.H. Fernandes, Sarcosine oxidase composite screen-printed electrode for sarcosine determination in biological samples, Analytica Chimica Acta, 2014, 850, 26-32.
5: Tânia S.C.R. Rebelo, C. Santos, Costa-Rodrigues, M.H. Fernandes, João P.C. Noronha, and M. Goreti F. Sales, Novel Prostate Specific Antigen plastic antibody designed with charged binding sites for an improved protein binding and its application in a biosensor of potentiometric transduction, Electrochimica Acta, 2014, 132, 142-150.
1.3.2 Communications presented in national and international
scientific conferences
1: Tânia S.C.R. Rebelo, Carlos M. Pereira, M. Goreti F. Sales, João P. Noronha, J. Costa-Rodrigues, Fernando Silva, and M.H. Fernandes, Sarcosine oxidase composite screen-printed electrode for sarcosine determination in biological samples. Poster, XIX Meeting of the Portuguese Electrochemical Society to be presented at Universidade de Aveiro, on 30th June - 2nd July, 2014.
2: Tânia S.C.R. Rebelo, M. Goreti F. Sales, João P.C. Noronha, J. Costa-Rodrigues and M.H. Fernandes, Oriented tailoring of plastic antibodies for prostate specific antigen and application of the imprinted material as ionophore in potentiometric detection. Poster, presented at Nanobio Europe, Varese, Italy, 18 - 20 June, 2012.
1.4 References
[1] World Health Organization (WHO),
www.who.int/mediacentre/factsheets/fs297/en, accessed in September 2010.
7
[3] N. Cernei, Z. Heger, J. Gumulec, O. Zitka, M. Masarik, P. Babula, T.
Eckschlager, M. Stiborova, R. Kizek, and V. Adam, Sarcosine as a Potential Prostate Cancer Biomarker—A Review. International Journal of Molecular Sciences 14 (2013) 13893-13908.
9
Literature Review
2.1. Prostate Cancer
PCa is the third most common cancer diagnosed in Europe today, and it has emerged as the most frequent cancer amongst men [1]. PCa develops in the prostate, a gland in the male reproductive system located directly beneath the bladder, which adds secretions to the sperm during the ejaculation of semen.
Genes, dietary factors, and lifestyle-related factors have been widely recognized as contributors to the development of PCa. During the past decade, molecular studies have provided unexpected clues about how PCa disease arises and develops. The presence of genes associated with inherited susceptibility to PCa and somatic alterations in prostatic cells provoked by infection or inflammation processes of the prostate contributes to the development of PCa. In addition, newly mechanisms by which environmental carcinogens might promote the progression of PCa were recognized [2].
Therefore, PCa early detection is fundamental for the successful treatment of the disease, and thus for the increase in the survival rate. The only medical recommendation for PCa early screening suggests monitoring the levels of PSA in serum, in men over 45 years old, combined with other alterations in serum and urine parameters. However, the PSA test, which may give false positive or negative information, is not reliable and does not allow an accurate differentiation of benign prostate hyperplasia (BPH), non-aggressive PCa and
10
aggressive PCa leading several patients to unnecessary biopsy procedures [3]. A non-invasive approach is important in this context, for an accurate diagnosis of PCa. It would permit a significant reduction in the number of repeated biopsies. The screening of additional specific biomarkers that may supplement PSA testing, or replace it over time, should be important not only for the determination of an appropriate treatment strategy for individual patients, but also for disease detection at an earlier stage, metastatic cancer prediction and re-occurring disease following prostatectomy.
Thus this thesis is meant to establish novel strategies for screening PCa biomarkers. Some considerations about these biomarkers and detection approaches under study will be presented in the following chapters.
2.2. Prostate cancer biomarkers
A biomarker is a molecule that is objectively measured and evaluated as an indicator of normal biologic processes, pathogenic processes, or pharmacologic responses to a therapeutic intervention. A biomarker reveals further information to presently existing clinical and pathological analysis. It facilitates the screening and detection of pathologies like cancer, monitoring the progression of the disease, and predicting the prognosis and survival after clinical intervention. A biomarker can also be used to evaluate the process of drug development, and, optimally, to improve the efficacy and safety of a cancer treatment by enabling physicians to tailor treatment for individual patients [4]. As defined by the National Cancer Institute, a biomarker is “a biological molecule found in the
blood, other body fluids, or tissues that is a sign of a normal or abnormal process
or of a condition or disease”[5].
11
vary from metabolites to chemical products, genes and genetic variations, differences in messenger RNA (miRNA) and/or protein expression and post-translational modifications of proteins present in biological fluids, such as blood, urine or saliva [6].
However, not all of molecules are appropriate to this aim. The ideal biomarker, when screened, should allow detection of the disease and its progression, identify high-risk individuals, predict recurrence, and monitor response to treatments. It should be inexpensive, reliable, easily accessible, and quickly quantifiable [4]. Biomarkers used for screening need to be able to detect early stage disease with high precision and sensitivity. Ideally, these biomarkers should be detected in specimens that can be collected by noninvasive means.
Among the several biomarkers in PCa, PSA is the one used more often. However, it has been linked to false positive or negative results, creating the need to identify other biomarkers that may complement routine PSA testing. Thus, along with the PSA currently used in clinical practice, ANXA3, MSMB, and SAR are tested herein as complementary biomarkers. The simultaneous monitoring of these biomarkers may allow clinicians to diagnose PCa quickly and/or to accurately design a patient care strategy.
2.2.1 Prostate specific antigen
PSA is one of the best-known biomarkers in medicine. This is the only medical recommendation for PCa early screening: PSA levels in serum should be monitored in men over 45 years old. Monitoring PSA levels to follow up the evolution of prostate cancer disease is also recommended, especially for being a non-invasive procedure [7].
12
of human prostate [8]. It has several isoforms, with isoelectric points ranging from 6.8 to 7.2 [3].
Low levels of PSA may be found in the blood circulation since PSA is secreted in the seminal plasma of healthy man. Nowadays, the PSA quantification test measures the total amount of PSA in the blood. A total PSA level in the blood <4 ng/mL indicates that prostate cancer is improbable, while PSA levels >10 ng/mL mean cancer is likely; values ranging from 4–10 ng/mL are in a gray zone [9], corresponding to unclear clinical condition.
However, PSA testing is not perfect, due to its limitations, mainly the false positive or negative results. PSA levels are affected by a high number of factors, like several physiological/pathological conditions, as well as a consequence of different therapeutic approaches [10]. Moreover, several types of non-prostatic neoplasm can express PSA [11]. Also, among PCa cells, expression of PSA varies widely and, furthermore, it appears to be significantly affected by the surrounding environment [10, 12]. Despite this significant variability, PSA detection is still very important for early detection of PCa and for monitoring disease evolution, creating the need to have accurate and reliable methods for PSA detection, within a broad range of protein concentrations, in biological fluids.
2.2.2 Annexin A3
13
interesting with regard to the unusual frequency of occurrence of osteoblastic bone metastases in the case of prostate carcinoma [16]. ANXA3 occurs intracellularly as well as extracellularly, for example in exosomes in urine. Exosomes are derivatives of so-called "multivesicular bodies" and may play an alternative, but decisive role, in the antigen presentation of immune cells [17, 18]. The exosomes detected in urine are possibly identical to the so-called prostasomes, that are small vesicles of prostatic origin contained in human semen [19]; in any case, both contain ANXA3.
ANXA3 is stable in exprimate urine samples for more than 48 h at 25 C and is stable during the course of reiterate measurements within at least 24 h [13]. Therefore, its use as biomarker is feasible, being potentially valuable for the detection of the early stages of PCa in urine samples. Although there are no standard values of ANXA3 levels to determine a positive answer for PCa until now, when detection of ANXA3 is combined with PSA, or any other cancer marker, it can be a powerful tool, obviating the drawbacks of single PSA detection.
2.2.3 Microseminoprotein-beta
MSMB is one of the more abundant proteins in the secretions produced by the human prostate, present in the seminal plasma and can be detected in serum and urine of healthy men and PCa patients [20]. Other glands, including breast tissue and other hormone responsive epithelial tissues, also produce MSMB but in small quantities [21]. It is also called Prostatic Secretory Protein 94 (PSP94), a small nonglycosylated peptide, consisting of 94 amino acids, with a molecular mass of 10.7 kDa [22].
14
risk of PCa is detected by higher levels, for MSMB the levels measured in biological fluids have been shown to be statistically significantly lower in men with prostate cancer and even lower in men with aggressive disease [23-25]. Not only as a biomarker of PCa development, progression and recurrence, but also as a potential target for therapeutic intervention, MSMB is an interesting choice as PCa biomarker [26]. As described previously for ANXA3, the combined detection of MSMB and PSA can be a powerful and more accurate tool in diagnosing prostate cancer in a clinical setting.
2.2.4 Sarcosine
The SAR is a molecule produced by human metabolism and is considered a new marker to identify the presence and aggressiveness of PCa [27]. Also known as N-methylglycine with the chemical formula CH3NHCH2COOH, SAR is a
metabolite that occurs as an intermediate product in the synthesis and degradation of amino acid glycine, detected in urine [28].
SAR has been identified among ten metabolites that are more abundant in prostate cells as cancer progresses. It seems to help cancer cells to invade adjacent tissues [29]. Other studies were also performed with SAR in the context of PCa. This included knowing how SAR affected the in vitro behavior of cells, by adding the metabolite to prostate cells and manipulating the biochemical pathways to increase molecule producing. It was noted that benign cells became cancerous and invasive. By blocking the production of SAR, invasion was terminated [30].
15
Such complementary test, together with PSA and ANXA3, may reduce the risk of false positive/negative results.
2.3 Quantification of biomarkers
Several conventional methods have been used to detect and quantify biomarkers for PCa. Currently, the standard clinical method used more often to monitor PCa biomarkers is immunoassay-based, like Enzyme-Linked Immunosorbent Assay (ELISA) [13, 23, 32]. Other methods, such as spectrophotometric [33, 34] and chromatographic methods [35, 36] are also used. Although, some of these methods are highly sensitive and specific for the detection of proteins, they also present some important drawbacks, such as being complex, time consuming and labor intensive procedures for routine diagnostics. Furthermore, immunoassays are very expensive methods because they require specific and expensive natural antibodies, with special handling and storage conditions. As an alternative, biosensors have emerged in recent years as an attractive tool to carry out quick and local clinical analysis [37]. Some of these also make use of an antibody as biological recognition element, but other materials may be employed, such as artificial antibodies [38]. A brief overview of these approaches is presented next.
2.3.1 Immunoassays
The immunoassay is an analytical technique based on molecular recognition between an antibody and its antigen. It allows the detection of different species, with a high degree of sensitivity and specificity, being considered as one of the most widely used biomedical diagnostic methods [39].
16
ELISA is an analytical technique wherein an antigen must be immobilized in a solid surface and then complexed with an antibody that is linked to an enzyme. The enzyme acts on the colorless substrate to give a colored product which is readily detectable. Detection is accomplished by assessing the conjugated enzyme activity via incubation with a substrate. Color development of the substrate by catalytic action of the enzyme is used to quantify antigen–antibody interaction [40].
In ELISA assays, the immobilization of the antigen of interest can be accomplished by direct adsorption to the assay plate or indirectly via a capture antibody that has been attached to the plate. The antigen is then detected either directly (labeled primary antibody) or indirectly (labeled secondary antibody). The ELISA format most used in laboratories is the sandwich assay, where the analyte to be measured is bound between two primary antibodies – the capture antibody and the detection antibody [40]. Based on the specific recognition of an antigen by an antibody, this method is sensitive and robust. In the literature, there are some studies that quantify the biomarkers studied in the present work by this technique, namely, it is possible to find ELISA assays for PSA [32], ANXA3 [41], and MSMB [23, 42].
But some drawbacks arise in ELISA from the use of natural antibodies. These biologically derived materials require special handling/storage conditions, are expensive and have little stability, becoming easily denatured in the presence of organic solvents. In addition, the antigen binding to the antibody is very strong, turning this method irreversible and of single use.
2.3.2 Biosensors
17
methods [37]. Such devices are used in a wide range of practical applications in medicine, pharmacology, food and process control, environmental monitoring, defense and security, but most of the market is driven by medical diagnostics. Most applications require the detection/identification of ligands or molecules with particular binding properties, aiming at high speed, good precision, and feasibility to carry out analysis in point of care or on-site [43].
Biosensors are analytical devices that incorporate a biological/biochemical sensing element and a physicochemical transducer, to deliver analyte measurements [44]. The interaction of analyte with the recognition element (mostly of biological origin) determines the overall selectivity of the analytical approach, while generating chemical/physical changes that may be monitored by a suitable transducer (Figure 2.1).
Figure 2.1: General structure of a biosensing device.
18
parameter, meaning that a good development of the biosensor also depends on this choice. Depending on the measuring mode in use, a wide range of different materials can be chosen as surface. Among them are gold, silver, diamond, graphene and carbon nanotubes.
So, one of the characteristic features of biosensors is their high selectivity. It results from the possibility to tailor the specific interaction of compounds by immobilizing recognition elements on the sensor substrate that have a specific binding affinity to the desired molecule. The nature of recognition element is fundamental for the selectivity provided by biosensors. These can be biological molecules and/or artificial materials, which include enzymes, antibodies, micro-organisms, biological tissue, DNA, aptamers, and molecularly-imprinted polymers (MIPs) [43].
When the recognition element of biosensor is an antibody, the device becomes recognized as an immunosensor. Due to their similarity with biological systems and high/specific molecular affinity, the biological elements are widely used. Although, the use of an antibody as biological receptor confers a selective response, the drawbacks related to the irreversible nature and of single use of the determination remain to be solved. As an alternative, a new strategy based on the use of artificial antibodies instead of the natural ones could offer higher chemical/thermal stability [38] and promote a reversible analytical response,
enabling an ‘infinite’ re-use of the biosensor devices.
19
2.3.3 (Bio)recognition elements
As mentioned previously, there are several (bio)molecules that may be employed as (bio)recognition elements. As the use of antibodies has been extensively reported in the literature [50-53], they will be left out from this overview of (bio)recognition elements. Instead, the used MIPs and enzymes as (bio)recognition elements will be regarded.
2.3.3.1 Molecularly Imprinted Material
MIPs are synthetic materials prepared by molecular imprinting technology to display a selective affinity for specific targets (Figure 2.2). These materials are a promising alternative to those naturally-derived, such as antibodies, enzymes or other biological receptors. MIPs have the ability to selectively recognize important molecules, such as drugs, proteins and biomolecules [54]. The technologies based on molecular molding provide efficient polymer systems with ability to recognize specific bioactive molecules, where the interaction depends on the properties and on the concentration of the template molecule present in the surrounding medium.
20
MIPs are rigid and three-dimensional materials synthesized around a certain molecule through covalent or non-covalent bonds. The recognition sites are obtained by pre-arrangement between target compound and selected monomers, followed by suitable polymerization procedures that lead to the formation of a rigid matrix. After removing the target molecule from the polymeric matrix, the recognition sites are exposed and display affinity for that specific target [55]. Thus, the resulting polymer recognizes and binds selectively to the template molecules. It should also be mentioned that a non-imprinted polymer (NIP) may be synthesized as control of the imprinting effect. It is obtained in the same way as the corresponding MIP, but in the absence of the template.
The target molecules in molecular imprinting processes are of diverse nature, yielding more or less difficult processes of molding. When the target molecule is a compound of low molecular weight, the imprinting process is relatively simple, with many papers demonstrating its success [56, 57]. In contrast, the imprinting of proteins (among which most PCa biomarkers are included) is still a field under development [58]. Proteins are a tricky material to carry out such tailoring processes, because they undergo conformational changes quite easily and have multiple charge locations varying with the specific conformation they exhibit. These critical points under the preparation of MIP may be avoided by using mild conditions, preferably close to those in the native environment of the protein. This includes room temperature polymerization procedures and use of compatible materials.
21
but could suffer from poor protein extraction, slow binding kinetics, template entrapment and bleeding. Surface imprinting methods provides a controlled modification of the surface, template removal is much easier to achieve and non-specific binding is quite lower, however, the number of binding sites is highly reduced [55].
Summing all up, the suitable method should be carefully chosen taking into account which kind of template is under study. Nowadays, the most used and well succeeded method for imprinting proteins is surface imprinting, due to its higher binding capacity and faster mass transfer/binding kinetics than traditional bulk processes [55].
Previously to the studies presented herein, a biosensor was developed for SAR making use of bulk molecular-imprinted [60]. A solid-phase extraction was used and the MIP was prepared using methacrylic acid as functional monomer and a mixture of acetonitrile/water as porogenic agent. It was successfully used for the selective clean up and pre-concentration of SAR from real urine samples, although the presence of acetonitrile within this process may question the real shape of the imprinted protein.
22
Figure 2.3: Generic scheme of by electropolymerization.
Different techniques can be used to molecularly imprint the film into electrode surface, such as stamp-coating/micro-contact, polymer-brush imprinting, surface grafting and electropolymerization. Surface grafting and electropolymerization are of particular interest for proteins, as these turn out simple and successful processes for assembling a polymeric matrix around complex protein structures.
23
Electrochemical polymerization is a clean production method to generate raw monomer aggregates directly on the substrate, avoiding the use of volatile organic solvents or the need for physical/chemical initiator [66]. It is also a very useful technique since it allows the control of the rate of polymer nucleation and growth by the proper selection of the electropolymerization parameters. In addition the film thickness can be controlled by the amount of charge passed during film deposition, and the film morphology can be modified by suitable selection of an appropriate solvent and supporting electrolyte [67]. These factors are regarded to be very important in achieving the desired sensitivity of a sensor.
The preparation of MIP-based biosensors by electropolymerization processes has been shown a successful approach for the recognition and detection of complex template molecules [68-70]. It is a promising tool for the construction of simple design, high stability, rapid response and enhanced selectivity sensors devices [71]. Electrochemical polymerization is typically conducted by mixing the template and the monomer in solution and by applying the necessary electrical conditions to form a polymeric matrix directly on the transducer surface. Nevertheless, the monomer selection is crucial, leading to more or less conductive polymer layers [71], with different physical features. This technique was also employed along this work, aiming at the construction of biosensors for ANXA3 and MSMB. These works will be described in Chapter 4 and 5.
2.3.3.2 Enzyme
24
quantitative analysis of a variety of target analytes in biomedicine, environmental, and food quality control, agricultural, and pharmaceutical industry and clinical sector [72].
Figure 2.4: Generic scheme of an enzymatic approach of biosensors.
Today, few enzyme biosensors are commercially available (e.g., sensors for monitoring blood glucose), while many are still under development. Although biosensors based on other (bio)recognition elements are rapidly progressing, enzyme biosensors are still one of the most frequently used in the biomedical field [73].
25
Since the sensitivity, selectivity and stability of a biosensor are strongly affected by the type of immobilization method used in the process – by influencing enzyme orientation, loading, mobility, stability, structure and biological activity
–, intensive efforts have been done to develop successful immobilization strategies [74]. This includes adsorption, covalent, entrapment, cross-linking, and affinity or a combination of the previous approaches [75-77]. Each of these has advantages and disadvantages. The choice of the most appropriate technique depends on the enzyme nature, the transducer and the associated detection mode. The best method of enzyme immobilization can vary if the biosensor application requires maximum sensitivity or rather focuses on stability. Reproducibility, cost and difficulty of the immobilization process also need to be considered. Sensitivity decreases if immobilization causes enzyme denaturation or conformational changes or if the enzyme has been modified, especially on its active site. A better sensitivity is obtained with oriented immobilization of enzymes on the transducer surface which properly expose their active site to the solution phase [74].
Direct covalent coupling of enzymes onto the transducer surface is a popular chemical immobilization method used to develop enzymatic biosensors. In this, biocatalysts are bound to the surface through functional groups that they contain and are not essential for their catalytic activity. The binding of the enzymes to the solid support is generally carried out by initial activation of the surface using multifunctional reagents, followed by enzyme coupling to the activated support, and then the excess of unbound biomolecules is removed [74]. Covalent immobilization was also the approach used along this work to build a SAR biosensor [78]. The corresponding results are extensively discussed in chapter 6.
26
development of electrochemical and optical enzyme-based biosensors, in the last three to five years, provided information about its relevancy, specific applications and analytical performance in the biomedical field. New emerging technologies and innovative biosensing designs, such as nanosensors, paper based-sensors, lab-on-a-chip, biochips, and microfluidic devices are also reported in the literature employing enzyme-based sensing systems [72].
2.4 Transducers
Advances in transduction methods are closely linked with the development in areas such as electronics and computing. There is enough research into the basic principles of transduction to be able to build a large variety of commercial devices, and solve most of the problems associated with the transduction event. There are different types of transducers, depending on the physicochemical property (electron transfer, mass change, heat transfer). New horizons might be
achieved by combining different transduction platforms
(electrochemical/optical/mass sensitive) for enhanced data acquisition in biosensor applications [44].
In general, the choice of the transducer to be used depends on the analyte and the sample properties. For PCa biomarkers, different kinds of sensors have been reported in the literature, where the transducer is of electrochemical, optical or piezoelectric. These have been summarized in Table 2.1, highlighting the target biomarker, the (bio)recognition element, the transduction, the concentration levels and limit of detection (LOD).
27
As can be seen Table 2.1, various methodologies have been applied for the determination of biomarkers, including SPR, QCM, Elisa and electrochemical approaches, among others. In the case of PSA, the methods applied for the detection of the biomarker present similar concentration linear ranges, with the exception of SPR and piezoresistive micro-cantilever, in which the linear ranges and LODs obtained are higher. On the other hand, ELISA methods exhibit superior sensitivity performance for the detection of PSA, presenting lower concentration linear ranges and LODs.
Regarding the biomarkers ANXA3 and MSMB, no electrochemical methods were found in the literature reporting their determination. Within the methods shown in Table 2.1, QCM procedures allowed obtaining better LOD and linear concentration range for ANXA3. In the case of MSMB, the linear range obtained by the ELISA method is better than the others.
28 Lit era tu re R evi ew [9] [83] [84] [85] [86] [47] [87] [88] [89] [90] [32] [91] [92] 3.4 0.4 100 4 4 4.7 0.1 0.4 0.075 (ng/mL)
4.0–13
4–10
1–10
100–10000
5–8
4–12.6
10–1000
1.5–40
2.3–150
0.12–25
0.9–60
29 C h ap. 2 Lit era tu re R evi ew Reference [41] [93] [23] [42] [22] [45] [79] [80] [94] LOD (ng/mL) 4.9 0.45 1.78 2.5 (ng/mL)
2–18
1.5–100
0.50–13.70
0.50–22.8
4.9–26
0.89–4.45
2.05–151.8
89.1–356.4
10–250 platform
ELISA
VIDAS® automated
30
These sensors have boosted the development of new diagnostic tools [95] displaying high sensitivity, specificity, and fast/accurate analysis. These sensors also offer experimental simplicity, low cost, portability allowing the possibility to carry out on-site analysis and adjust the technique to disposable devices. Such main features justify the selection of this kind of transduction by many authors.
The electrochemical transduction was selected in the context of this thesis and a brief description of the relevant electrochemical techniques employed herein is described then. .
2.4.1 Electrochemical
The general principle of electrochemical sensors is the electron flow between an electroactive species and an electrode surface (subjected to a pre-defined pattern fixed or variable potential). Such electron flow may be used both for qualitative and quantitative analysis, by means of direct or indirect reading of any chemical compound that is electroactive, i.e., it may be oxidized and/or reduced under the specified conditions. This technique may also be used to carry out fundamental studies such as, oxidation and reduction processes in various electrolytes, adsorption processes in different materials and electron transfer mechanisms at chemically modified electrode surfaces [96].
31
2.4.1.1 Potentiometry
Potentiometry measures the potential difference between two electrodes (indicating and reference electrodes) immersed in a solution and its relationship to the activity of ionic species present in the same solution at near-zero current condition [99]. It is the electroanalytical technique with the widest response range, making use of the potential difference to quantity almost any chemical species of interest [98]. Such potential difference accounts the free energy change
(ΔG) that would occur if the chemical phenomena were to proceed until the
equilibrium condition had been satisfied. The correlation between free energy change and potential developed can be observed in equation 2.1,
∆𝐺 = −𝑛𝐹𝐸 2.1
where E is the maximum potential between two electrodes, F is the Faraday’s constant (1F = 96,485 C mol-1) and n is the number of electrons exchanged. For an
electrochemical cell that contains an anode and a cathode, the potential of the electrochemical cell is the difference between the cathode electrode potential and the anode electrode potential. If the reaction is conducted under standard state conditions, this equation allows the calculation of the standard cell potential.
When the reaction conditions are not standard state, the Nernst equation –
displayed in equation 2.2 – should be used to determine the cell potential,
𝐸𝐶𝑒𝑙𝑙= 𝐸0−𝑅𝑇𝑛𝐹𝐿𝑛𝐾𝑒𝑞 2.2
32
If the potentiometric technique relies on ion-selective electrodes (ISEs), the potential difference is generated by the presence of ions at the selective membrane that is part of the indicating electrode. Thus, this specific potentiometric readings there are no explicit redox reactions, but an ion concentration gradient formed across the semi-permeable selective membrane [100, 101]. The observed potential difference is generated by the transfer of the ionized analyte across the interface between the sample and membrane phase. The interface of the inner side of the membrane may be a liquid or a solid-phase; the former yields lower detection limits but the latter is easier to handle among laboratory experiments. A schematic representation of the solid-state contact electrode is shown in Figure 2.5. This overall principal may be used for determination of almost any ionic species, including proteins.
33
Figure 2.5: Scheme of the ion-selective electrode construction of solid contact. A: copper electrical wire; B: syringe body; C: conductive carbon-based support material; D: casting of the selective membrane over the solid-contact.
Today, it is possible to find ISEs based on a small film or a selective membrane as recognition element and constructed with various configurations, ranging from an equivalent shape to a glass electrode, or a planar/tubular arrangement. The sensing surface is typically formed by incorporating a recognition element in a plasticized PVC matrix. One of the most important aspects in the development of an ISE is related to the electroactive material incorporated into the membrane, and ensures selective interaction with the analyte. This may be achieved by doping the membranes with MIPs.
34
analysis is carried out over few milliliters of aqueous solvent, containing only the analyte and buffer/ionic strength adjuster. The analysis is also non-destructive, allowing subsequent reading(s) of other parameter(s) [103]. Thus, potentiometric-based electrochemical sensors were also developed along this work [65]. PSA was the target biomarker and the corresponding details may be found in chapter 3.
2.4.1.2 Amperometry
In amperometric measures the current intensity flows between two electrodes due to an electrolytic reaction. A reagent is the analyte under study and the measured current is proportional to its concentration [98]. The analyte, or the species involved with it via a (bio)chemical reaction, changes its oxidation state at one electrode. The electron flux is then monitored and is proportional to the amount of the species electrochemically transformed at the electrode [98]. The signal obtained from the transducer is presented in the form of current. The current intensity can be measured as a function of an applied potential (voltammetry), which can lead to lower detection limits. Several species in solution can be determined in the same experience if they react on the electrode surface at different potentials [104].
When an amperometric biosensor is used, the current varies upon the addition of a particular compound (e.g. a redox-enzyme substrate) to render a particular product that is electro-transformed at the electrode. The current change is proportional to the amount of electro-oxidized/reduced species, which in turn may be directly or inversely proportional to the analyte concentration, depending on the assay format [105].
35
biological fluids. An enzyme electrode consists of a thin layer of an enzyme immobilized on the electrode surface. The enzyme is chosen to catalyze a reaction which generates a product or consumes a reactant which can be monitored amperometrically [106].
2.4.1.2.1 Voltammetry
Among the amperometric techniques, voltammetry includes the assays which involve disturbance of a system for applying a potential difference that varies over time, measuring the resulting current intensity. A resulting stream is comprised of two components: faradaic current (current due to oxidation-reduction reactions of the species under investigation) and the residual current. This residual current is due to a faradaic current generated by the presence of impurities in the electrodes. The electrode potential is controlled in relation to the potential of a reference electrode, which ideally preserves itself unchanged [107].
Voltammetry is widely used for chemical analytical purposes, not including fundamental studies of oxidation and reduction processes in several ways, adsorption processes on surfaces or electron transfer mechanisms chemically modified electrodes in surfaces [108].
36
2.4.1.2.1.1 Cyclic voltammetry
CV is the most widely used technique to get all the qualitative information about electrochemical reactions. This technique has the ability to rapidly provide thermodynamic information about redox processes, the kinetics of heterogeneous electron transfer reactions and also kinetic information of coupled chemical reactions or adsorptive processes. Particularly, CV allows the rapid detection of the oxidation-reduction potential of any electroactive species, and an evaluation of the effect of the medium composition in redox processes [98].
It consists in applying a linear potential (E) sweep at a steady scan-rate (the rate of potential change with time, ν=ΔE/Δt) to the working electrode (WE), leading
to sequential linear potential increases and decreases between a minimum and a maximum potential limit. The CV plot obtained by this measurement is named voltammogram and depicts the resulting electrical current at the electrode surface (I) as a function of applied potential [98]. The application of this potential sweep is controlled by a reference electrode and has a triangular waveform when plotted against time, with minimum and maximum potential limits (Emin and Emax,
respectively) established within the procedure (Figure 2.6).
Figure 2.6: Potential variation applied to the working electrode over time in CV: Ei –
initial potential; Ef – final potential; Emin – minimum potential; Emax –
37
The most important parameters in a voltammogram are the potentials of cathode and anode peak and the cathodic and anodic peak current intensities. As shown in Figure 2.7, the cathode potential scanning is followed by the anodic scanning, where the reduced species formed in the cathodic cycle can be oxidized according to the reverse reaction, yielding two peaks in the voltammogram. When the system is irreversible or quasi-reversible, the cathodic and anodic direction becomes not exactly reverse. Kinetic parameters can be inferred from the shape of the voltammograms [98].
Figure 2.7: Typical voltammogram for a reversible system.
![Figure 2.10. The combination of these elements is known as a Randles circuit [112]](https://thumb-eu.123doks.com/thumbv2/123dok_br/16489973.733112/77.892.265.707.388.788/figure-combination-elements-known-randles-circuit.webp)

![Figure 4.3: EIS study over the subsequent modification steps of the carbon-SPE in 5.0 mM [Fe(CN) 6 ] 3− and 5.0 mM [Fe(CN) 6 ] 4− in PBS buffer](https://thumb-eu.123doks.com/thumbv2/123dok_br/16489973.733112/124.892.176.652.217.550/figure-eis-study-subsequent-modification-steps-carbon-buffer.webp)