Evaluation of the potential for the generation of energy from biogas and estimated
emission avoided of methane in a sewage treatment station
Avaliação do potencial de geração de energia proveniente de biogás e estimativa de
emissão evitada de metano em uma estação de tratamento de esgoto
DOI:10.34117/bjdv6n5-448
Recebimento dos originais: 28/04/2020 Aceitação para publicação: 22/05/2020
Tuane Nascimento Mendes Aragão
Mestre em Energia pela Universidade Salvador - UNIFACS. Engenheira Sanitarista e Ambiental na HIGESA Engenharia – a serviço da Empresa Baiana de Águas e Saneamento S.A - EMBASA.
Endereço: R. Barão de Jeremoabo, s/n - Ondina, Salvador - Bahia, - CEP: 40.170-290. E-mail: [email protected]
Ícaro Thiago Andrade Moreira
Doutor em Geologia Ambiental, Hidrogeologia e Recursos Hídricos pela Universidade Federal da Bahia – UFBA. Professor Adjunto (DE) do Departamento de Engenharia Ambiental da UFBA.
Endereço: R. Barão de Jeremoabo, s/n - Ondina, Salvador - Bahia, - CEP: 40.170-290.
E-mail: [email protected]
ABSTRACT
In the process of anaerobic treatment of sewage, some gaseous pollutants are generated, forming the biogas. In this mixture of gases, there is methane (CH4), which has a high calorific value, adding to the biogas an energetic potential. The objective of this research was to quantify the potential for the generation of energy from the biogas produced at a Sewage Treatment Station (STS), and to estimate the avoided emission of methane from the biogas utilization. Monitoring data from january to july 2016 from a sewage treatment station, located in the state of Bahia, were used. During the analyzed period, the station operated with an average flow of 12,785.6 m³.day-1 and an average chemical Demand of Oxygen (COD) of 9,063.1 kg.day-1. The following results were obtained: average COD removal efficiency of 83.7%; Methane production of 1,706.9 m³.day-1; Available average electric energy of 76,495.5 kWh.m-1; Avoided emission of methane of 1,109.4 kg CH4. It was possible to conclude that the energy use of biology in the analyzed STS was shown to be promising, with further studies being used as proven the technical and economic viability of the project.
Keywords: Sewage Treatment, Biogas, Metane, Energy. RESUMO
No processo de tratamento anaeróbico de esgoto, são gerados alguns poluentes gasosos, formando o biogás. Nesta mistura de gases, existe o metano (CH4), que possui alto valor calorífico, agregando ao biogás um potencial energético. O objetivo desta pesquisa foi quantificar o potencial de geração de energia a partir do biogás produzido em uma estação de tratamento de esgoto (STS) e estimar a emissão evitada de metano a partir da utilização do biogás. Foram utilizados dados de monitoramento
de janeiro a julho de 2016 de uma estação de tratamento de esgoto, localizada no estado da Bahia. Durante o período analisado, a estação operou com um fluxo médio de 12.785,6 m³.dia-1 e uma Demanda Química Média de Oxigênio (COD) de 9.063,1 kg.dia-1. Os seguintes resultados foram obtidos: eficiência média de remoção de DQO de 83,7%; Produção de metano de 1.706,9 m³.dia-1; Energia elétrica média disponível de 76.495,5 kWh.m-1; Emissão evitada de metano de 1.109,4 kg CH4. Foi possível concluir que o uso de energia da biologia no STS analisado mostrou-se promissor, com mais estudos sendo comprovados quanto à viabilidade técnica e econômica do projeto.
Palavras-chave: Tratamento de esgoto, biogás, metano, energia. 1 INTRODUCTION
Deficiency in the process is aggravating for the environment at the national level. In some cases, the sewage collected in cities is not subjected to treatment, being discarded in water bodies, causing negative impacts on the environment. The proper procedure for the treatment of sewage occurs when the effluent is directed to the treatment station, being subjected to a series of processes, in order to decrease its polluting potential before returning it to the environment (COSTA, 2006). The biological treatment of sewage commonly used in Brazil consists of the anaerobic decomposition process of organic matter in an Upflow Anaerobic Sludge Blanket (UASB), with the aim of reducing effluent contamination for final disposal, generating sludge and biogas as waste (CHERNICHARO, 2001).
The biogas from Sewage Treatment Station (STS) is essentially made up of methane, which is considered one of the main Greenhouse Gases (GHG) (CENBIO, 2000). With regard to sewage treatment, the more efficient the biological treatment step, the greater the methane production, which gives biogas the calorific potential, resulting in the ability to obtain energy (JIANG et al., 2013; DENG, 2014).
For biogas production to occur on a larger scale, it is necessary for the STS to have certain characteristics, such as the primary sewage treatment, and the affluent must have ideal conditions for the metabolism of methanogenic bacteria, such as air impermeability, Substrate, water content, temperature and pH (PECORA, 2006). It should be noted that biogas production may be the main source of GHG in STS when they are not adequately managed.
Some studies prove the economic and environmental benefits from the use of biogas energy in STS in different regions of the country. In the case study carried out at the STS Santa Quitéria (Curitiba, Paraná, Brazil), the estimated methane production was 1,427.2 m³.day-1, equivalent to the average availability of electricity of 65,280.3 kWh.mon-1, corresponding to 59% of the average monthly energy demand at the treatment plant (BILOTTA e ROSS, 2015). At the STS located in the northwest region of São Paulo - Brazil, the estimate of daily biogas production was 1,493 m³, of
which 970.45 m³ is equivalent to the volume of methane (RODRIGUES et al., 2011). In the case study carried out at STS Rio das Antas (Cascavel, Paraná, Brazil), the main results found allowed to conclude that the daily production of biogas was 624 m3, and the average concentration of methane gas was 74.8%, equivalent to 466, 75 m³, resulting in the potential for electricity availability of 35,459 kWh per month (ZILLOTI, 2012).
New trends are even inclined towards the quantification of avoided methane emissions in processes that generate biogas, when performing the recovery of methane for energy production. The avoided emission of methane is fully aligned with the guidelines established by the National Policy on Climate Change (brazilian law 12.187/2009), and can therefore be used as a Clean Development Mechanism (CDM).
Considering the growing need for new energy sources, studies on the use of biogas for energy purposes in STS have become a new perspective for the feasibility of the purpose, which is already justified by the environmental function and which added to the economic question, adds even more importance.
Therefore, the present study presents results of a case study carried out in a sewage treatment plant in the state of Bahia, aiming to evaluate the efficiency of biogas production during the anaerobic treatment of sewage, quantify the methane that constitutes the biogas generated and, consequently, the available electric potential, in addition to estimating avoided methane emissions.
2 METHODOLOGY
The methodology consisted of:
Bibliographic review on the operation of STS, as well as on all the comprehensive aspects of the biogas generated in the treatment plants, such as characteristics, storage, handling and the like;
Estimation of methane production and energy available at a Sewage Treatment Station;
Estimate of avoided methane emissions.
Biogas production was estimated based on monitoring data from STS, considering the Chemical Oxygen Demand (COD), as well as through the flow control report between the monthsof January and July 2016. Monthly reports on the Sewage Quality Index made available by the sanitation
company responsible for the station. The monthly affluent and effluent COD concentrations were identified in the laboratory using the colorimetric method, following the Standard Methods for the Examination of Water and Wastewater (APHA, 1998).
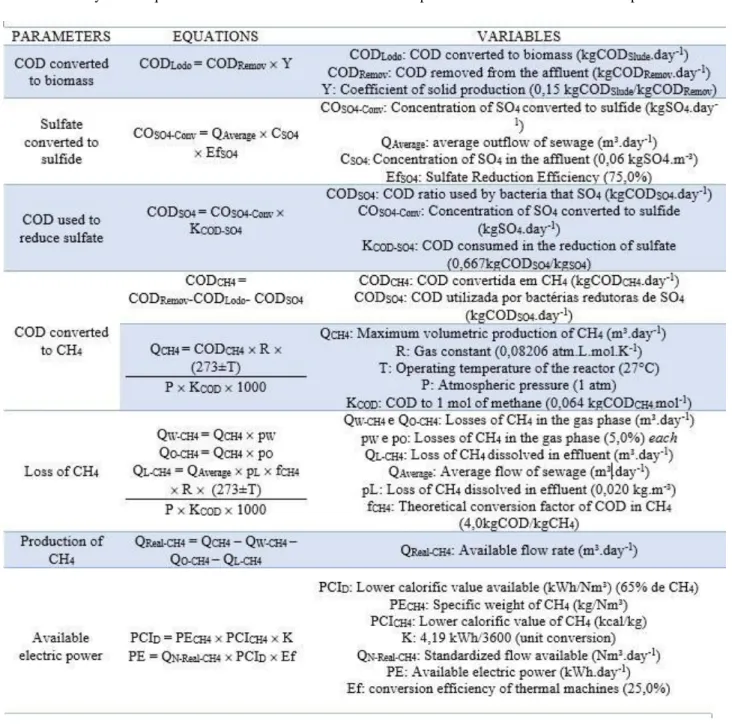
To perform the calculations related to the estimation of methane production and available electricity, equations from a mathematical model performed by Lobato (2011), whose research line is similar, were used. Table 1 shows the equations used.
For the varios not monitored in the STS, estimated average values were adopted, according to the literature. Table 2 presents the referred values adopted.
Table 2: Variables not monitored in the analyzed station.
VARIABLES VALUES ADOPTED
Concentration of SO4 in the affluent (COSO4) 0,06 kgSO4.m-³
Sulfate Reduction Efficiency (EfSO4) 75,0%
Coefficient of Solids Production (Y) 0,15 kgCODLodo/kgCODRemov
Loss of CH4 in the gas phase (pW) 5,0%
Other losses of CH4 in the gas phase (pO) 5,0%
Loss of CH4 dissolved in the effluent (pL) 0,020 kg.m-³
COD consumed in sulfate reduction (KCOD-SO4) 0,667 kgCODSO4/kgSO4
COD corresponds to 1 mole of methane (KCOD) 0,064 kgCODCH4.mol-1
Theoretical conversion factor of COD in CH4 (fCH4) 4,0 kgCOD/kgCH4
Source: Values obtained from studies carried out by Lobato (2011).
For the variables monitored in the STS, the values shown in Table 3 were adopted.
Table 3: Variables monitored in the analyzed station.
VARIABLES VALUES
Biological Reactor Temperature (T) 27 °C *
Environmental Pressure (P) 1 atm
Average Flow (QAverage) 12.785,6 m³.day-1
COD Average Affluent to UASB - entrance (CODe) 9.063,1 kgCODe.day-1
COD Average Effluent to UASB - exit (CODs) 1.474,0 kgCODs.day-1
Source: Regional Laboratory of the Sanitation Company responsible for STS. *Average temperature adopted based on sample temperature.
The calculation of methane emissions was based on the document "Guidelines for Emission of National Greenhouse Gas Inventories", which presents equations to estimate CH4 emissions derived from domestic sewage (IPCC, 2006). For the calculation, it was necessary to use the methane production estimate, in addition to the COD removed in the treatment and the COD of the sludge, according to the Equations shown in Table 4.
Table 4: Methane emission calculation.
PARAMETERS EQUATIONS VARIABLES
Calculated Emission
Factor FE = (QCH4 / CODRemov)
FE = Calculated emission factor
(kgCH4/kgCODRemov)
QCH4: Maximum volumetric production CH4
(kgCH4.day-1)
CODRemov: COD removed from the affluent
(kgCODRemov.day-1)
CH4 Removed in
Energy Enhancement
PV = m.R (T+273).MMCH4
P: Atmospheric pressure (1 atm)
V: Maximum volumetric production of CH4
(m³.day-1)
m = RCH4: CH4 removed in energy use (kgCH4.day-1)
R: Gas constant (0,08206 atm.L/mol.K) T: Operating temperature of the reactor (°C) MMCH4: Molecular Mass CH4 = 0,016 kg/mol
Total emission of
CH4 ECH4 = FE.(CODRemov. - CODLodo) - RCH4
ECH4 = emission of CH4 (kgCH4.day-1)
FE = Calculated emission factor
(kgCH4/kgCODRemov)
CODLodo: COD converted into biomass
(kgCODLodo.day-1)
RCH4: CH4 removed in energy use (kgCH4.day-1)
3 RESULTS AND DISCUSSION
Table 5 presents the results of the variables calculated based on the equations previously presented in Table 1.
Table 5: Result of calculated variables.
VARIABLES RESULTS OBTAINED
COD removed from affluent (CODRemov) 7.589,1 kgCODRemov.day-1
COD converted to CH4 (CODCH4) 6.067,0 kgCODCH4.day-1
Maximum volumetric production of CH4 (QCH4) 2.333,7 m³.day-1
Losses of CH4 in the gas phase (QW-CH4 + QO-CH4) 233,4 m³.day-1
Loss of CH4 dissolved in effluent (QL-CH4) 393,4 m³.day-1
Available flow rate (QReal-CH4) 1.706,9 m³.day-1
Standardized flow available (QN-Real-CH4) 1.553,3 Nm³.day-1
Lower calorific value available from CH4 (PCID) 6,48 kWh.Nm-³ *
Electrical Power Available (PE) 2.514,9 kWh.day-1
The values represented in this table refer to the results of applying the equations indicated in Table 1. * Considering 65% of methane in biogas: PECH4 = 1,1518 kg/Nm³; PCICH4 = 4.831,1 kcal/kg.
The result of the average COD removed (CODRemov) in the analyzed STS was 7,589.1 kgCODRemov.day-1, being possible to verify that the efficiency of COD removal in the STS was 83.7% in the analyzed period.
The typical efficiency range for COD removal in WWTPs that have secondary and tertiary treatment, the secondary being composed of a UASB reactor, is 65 to 90% (OLIVEIRA e VON SPERLING, 2005). Thus, it is observed that the analyzed STS is in the typical efficiency range for COD removal. It is noteworthy that the efficiency in the removal of COD positively influences the potential for energy generation.
Comparing the results with the study by Bilotta & Ross (2015) at ETE STS Santa Quitéria, it was possible to observe that the STS analyzed in the present study was more efficient in the parameter of methane volumetric production (available flow), because the losses in the liquid and gaseous phase were lower at this station, resulting in an available flow (QReal - CH4) of 1,706.9 m³.day-1, while STS Santa Quitéria presented an available flow of 1,427.2 m³. day-1. Another factor that justifies such a difference in methane production is the efficiency of removing COD from stations; while the STS analyzed showed an average COD removal efficiency of 83.7%, the STS Santa Quitéria showed an average efficiency of 65.6% at this stage of treatment. It should be noted that the removal of COD in anaerobic conditions is directly proportional to the production of biogas.
The electrical power available from the energy utilization of biogas at the treatment plant analyzed represents 86.2% of the average real monthly consumption of STS.
Knowing the result of the mass of methane removed in the use of biogas energy, two scenarios for the methane emission were calculated: the first without the use of biogas and the second considering the recovery of this by-product. From these results, it was observed that the use of biogas can reduce the total methane emission (ECH4) from 1,290.2 kgCH4.day-1 to 180.8 kgCH4.day-1 in the analyzed treatment plant, therefore, the avoided methane emissions resulted in 1,109.4 kgCH4.day-1. Table 6 presents the synthesis of the results inherent to the avoided methane emission.
Table 6: Result of variables calculated on CH4 emission.
VARIABLES RESULTS OBTAINED
Calculated Emission Factor (FE) 0,20 kgCH4/kgCODRemov
COD removed from the affluent (CODRemov) 7.589,1 kgCODRemov.day-1
COD converted into biomass (CODLodo) 1.138,4 kgCODLodo.day-1
CH4 Removed in the Energetic Use (RCH4 Theoretical) 1.516,8 kgCH4.day-1
CH4 Removed in the Energetic Use (RCH4 Calculated) 1.109,4 kgCH4.day-1
Total emission of CH4 (ECH4 without the use of biogas) 1.290,2 kgCH4.day-1
Total emission of CH4 (ECH4 with the use of biogas) 180,8 kgCH4.day-1
The calculated methane emission factor (FE) was compared with values adopted from theoretical and experimental approaches in the literature, such as 0.21 - 0.25 kgCH4.kgDQORemov-1
(USEPA, 1997). Therefore, the FE calculated in this research was consistent with other studies in the literature.
The avoided emission of methane is an important tool in the practices of Clean Development Mechanisms (CDM), which is the only mechanism of the Kyoto Protocol that allows voluntary participation by developing countries. Countries that implement CDM projects can sell avoided GHG emissions, called Certified Emission Reductions - CERs (MCTI, 2014). The use of biogas energy in the Jacuípe II ETE, therefore, may result in obtaining CERs after the project is submitted to legal steps, fulfilling the goals and commitments to reduce GHGs in the country.
4 CONCLUSIONS
The results presented allow us to conclude that the estimated methane of STP Jacuípe II was 1.706,9 m³.day-1 reflecting the available electrical power of 76.495,5 kWh.month-1, 86,2% of the average electricity consumption for the operation of the treatment plant between the months of January and July of 2016. It was also verified that the energetic use of the biogas in the said treatment plant could avoid the emission of a methane plot of 1.109,4 kgCH4.day-1 in compliance with the guidelines established by the National Policy on Climate Change.
REFERENCES
APHA - AMERICAN PUBLIC HEALTH ASSOCIATION. Standard Methods for the Examination of Water and Wastewater. 20. ed. Washington (USA), 1998, 1162p.
BILOTTA, P.; ROSS, B. Z. L. 2015 Estimativa de geração de energia e emissão evitada de gás de efeito estufa na recuperação de biogás produzido em estação de tratamento de esgotos. Curitiba, Paraná. Disponível em <http://www.scielo.br/pdf/esa/v21n2/1809-4457-esa- S1413_41522016141477.pdf> Acesso em: 10 set. 2016.
CENBIO – Centro Nacional de Referência em Biomassa. Medidas mitigadoras para a redução de emissões de gases de efeito estufa na geração termelétrica. Brasília: Ed. Dupligráfica, 2000, p. 222. CHERNICHARO, C. A. L. Pós-tratamento de Efluentes de Reatores Anaeróbios: Aspectos
Metodológicos. 1 ed. Belo Horizonte; PROSAB/FINEP, 2001, p. 118.
COSTA, D. F. 2006. Geração de energia elétrica a partir do biogás do tratamento de esgoto. Dissertação (Mestrado em Energia) – Universidade de São Paulo, São Paulo.
DENG, Y.; XU, J.; LIU, Y.; MANCL, K. 2014. Biogas as a sustainable energy source in China: Regional development strategy application and decision making. Renewable and Sustainable Energy Reviews, v. 35, p. 294-303.
IPCC – INTERGOVERNMENTAL PANEL ON CLIMATE CHANGE. 2006. Guidelines for National Greenhouse Gas Inventories. Prepared by the National Greenhouse Gas Inventories Programme. EGGLESTON, H.S.; BUENDIA, L.; MIWA, K.; NGARA, T.; TANABE, K. (Eds.).
Published: IGES, Japan. Disponível em:
<http://www.ipcc-nggip.iges.or.jp/public/2006gl/vol5.html>. Acesso em: 11 out. 2016.
JIANG, X.; HAYASHI, J.; SUN, Z.Y.; YANG, L.; TANG, Y.Q.; OSHIBE, H.; OSAKA, N.; KIDA, K. 2013. Improving biogas production from protein-rich distillery wastewater by decreasing ammonia inhibition. Process Biochemistry, v. 48, p. 1778-1784.
LOBATO, L. C. S. 2011. Aproveitamento energético de biogás gerado em reatores UASB tratando esgoto doméstico. Tese (Doutorado em Saneamento, Meio Ambiente e Recursos Hídricos) – UFMG, Belo Horizonte.
MCTI – Ministério da Ciência e Tecnologia da Informação 2014. Status dos projetos no âmbito do Mecanismo de Desenvolvimento Limpo (MDL) no Brasil e no mundo. Disponível em:
<http://www.mct.gov.br/upd_blob/0232/232099.pdf> Acesso em: 23 out. 2016.
RODRIGUES, D. L.; AQUINO, C. F.; ESTEVAM, G. P. 2011. Produção de biogás a partir dos esgotos utilizando reatores anaeróbicos do tipo RAFA seguido por lodos ativados numa estação de tratamento de esgoto. Omnia exatas, v.4, n.2, p.103-109.
OLIVEIRA, S. M. A & VON SPERLING, M. 2006. Avaliação de 166 ETEs em operação no país, compreendendo diversas tecnologias. Parte 1 - análise de desempenho. In: VIII Simpósio Ítalo- Brasileiro de Engenharia Sanitária e Ambiental. Fortaleza – Ceará.
PECORA, Vanessa. Implementação de uma Unidade Demonstrativa de Geração de Energia Elétrica a partir do Biogás de Tratamento do Esgoto Residencial da USP: estudo de caso. 2006. 153f. Dissertação (Mestrado – Programa Interunidades de Pós-Graduação em Energia) – EP / FEA / IEE / IF da Universidade de São Paulo.
USEPA. Reducing methane emissions. Washington, D. C.: U. S. Environmental Protection Agency. 1997 apud EL-FADEL, M. & MASSOUD, M. Methane emissions from wastewater management. Environmental Pollution, v.114 p.177-185. 2001.
ZILOTTI, H. A. R. 2012. Potencial de produção de biogás em uma estação de tratamento de esgoto de Cascavel para a geração de energia elétrica. Dissertação (Mestrado em Energia na Agricultura) – Universidade Estadual do Oeste do Paraná, Cascavel.