A multibiomarker approach in the clam Ruditapes decussatus to assess the impact
of pollution in the Ria Formosa lagoon, South Coast of Portugal
A. Cravo
a, C. Pereira
a, T. Gomes
a, C. Cardoso
a, A. Serafim
a, C. Almeida
a, T. Rocha
a, b, B. Lopes
a,
A multibiomarker approach in the clam Ruditapes decussatus to assess the impact
of pollution in the Ria Formosa lagoon, South Coast of Portugal
A. Cravo
a, C. Pereira
a, T. Gomes
a, C. Cardoso
a, A. Serafim
a, C. Almeida
a, T. Rocha
a, b, B. Lopes
a,
R. Company
a, A. Medeiros
a, R. Norberto
a, R. Pereira
a, O. Araújo
a, M.J. Bebianno
a, *CIMA e Centre for Marine and Environmental Research, Faculty of Sciences and Technology (FCT), University of Algarve, Campus de Gambelas, 8005-‐139 Faro, Portugal Laboratório de Comportamento Celular, Departamento de Morfologia, Instituto de Ciências Biológicas IV, Campus II, Universidade Federal de Goiás, Caixa Postal 131, 74001-‐970 Goiânia, Goiás, Brasil
b a
Keywords: Ruditapes decussatus Ria Formosa lagoon Environmental monitoring Multibiomarker approach
a b s t r a c t
The Ria Formosa lagoon is an ecosystem whose water quality reflects the anthropogenic influence upon the surrounding areas. In this lagoon, the clam Ruditapes decussatus has a great economical importance
and has been widely used as a biomonitor. A multibiomarker approach (d-‐aminolevulinic acid dehy-‐
dratase, metallothionein, lipid peroxidation, acetylcholinesterase, alkali-‐labile phosphates, DNA damage) was applied to assess the environmental quality of this ecosystem and the accumulation of contaminants and their potential adverse effects on clams. Clams were sampled in different shellfish beds in the period between July 2007 and December 2008 and abiotic parameters (temperature, salinity, pH and dissolved oxygen of seawater and organic matter in the sediment), condition index, metals (Cd, Cu, Zn, Ni, Pb), TBTs and PAHs concentrations were measured in clam tissues. Data was integrated using Principal Component Analyses and biomarker indices: IBR (Integrated Biomarker Response) and HSI (Health Status Index). This multibiomarker approach enabled discrimination of a time and space trend between sites with different degrees of anthropogenic contamination, identifying one of them (site 2) as the most stressful and summer months as the most critical period for clams due to an increase of environmental stress (anthropogenic pressure along with extreme environmental conditions, e.g. temperature, dissolved oxygen, organic matter in the sediments, etc). The selected biomarkers provided an integrated response to assess the environmental quality of the system, proving to be a useful approach when complex mixtures of contaminants occur.
1. Introduction
Marine ecosystems hold high ecological and economic impor-‐ tance since they support vital habitats for organisms and sustain several anthropogenic pressures. Highly productive areas such as estuaries and coastal lagoons are among the most extensively modified and threatened ecosystems mainly due to urban develop-‐ ment, industrialization and tourism. As a result, complex mixtures of contaminants are continuously released to these systems deterio-‐ rating the water quality and imposing severe restrictions to organ-‐ isms and possibly causing a decrease in natural resources (Cajaraville et al., 2000; Cravo et al., 2009; Monserrat et al., 2007). Such an example is the Ria Formosa lagoon, a major coastal lagoon in the
Portuguese south coast particularly important for tourism and fish-‐ eries, especially shellfish (Bebianno et al., 2007). The contaminants already known to be present in water, sediments and biota from specific sites of the lagoon include metals (Bebianno, 1995; Bebianno and Serafim, 1998, 2003; Caetano et al., 2002; Cravo et al., 2009; Serafim and Bebianno, 2001), polycyclic aromatic hydrocarbons (PAHs) (Barreira et al., 2007a, b; Bebianno et al., 2007; Bebianno and Barreira, 2009; Cravo et al., 2009), polychlorinated biphenyls (PCBs) (Barreira et al., 2005; Bebianno et al., 2007) and organotin compounds (Coelho et al., 2002; Díez et al., 2005).
Analysis of a complete array of contaminants present in the environment is virtually impossible and does not reflect deleterious effects upon the biota. Hence, measuring changes at a biochemical, cellular and physiological level can be an effective early warning signal to assess the health of aquatic organisms and ultimately of the ecosystem (Cajaraville et al., 2000). In environmental assess-‐ ment and monitoring programs bivalves have been widely used as biomonitors. They respond to pollutant exposure and clams in particular, due to their suspension feeder nature, can accumulate
the bioavailable fraction of contaminants from water and sedi-‐ ments (Bebianno and Serafim, 2003; Nasci et al., 2000). The clam Ruditapes decussatus has a widespread distribution in European and Mediterranean coastal waters and a great ecological and econom-‐ ical importance. It is extensively produced and harvested in the Ria Formosa lagoon where clam farming represents an important economical sector (Bebianno et al., 2004; Bebianno and Serafim, 2003). However, in the last decade clam production decreased as a result of the lagoon’s water quality deterioration (Barreira et al., 2007a; Bebianno, 1995; Bebianno and Serafim, 2003; Bebianno et al., 2004; Coelho et al., 2002).
The environmental quality assessment of clam populations and its habitats requires the evaluation of integrated biological effects particularly in environments where complex mixtures of contam-‐ inants are present. Field studies that include a multibiomarker approach allow measurements of the impact of several environ-‐ mental stressors. This approach has been very successful with invertebrates and nowadays it is a recommended tool for envi-‐ ronmental monitoring programs (Bebianno et al., 2004; Cravo et al., 2009; Maria et al., 2009; Porte et al., 2001; Viarengo et al., 2007). Therefore, the aim of this study was to apply a suite of biomarkers in an attempt to understand the time and space contamination trend within this ecosystem and its potential adverse effect on clams. Metallothionein (MT) levels were measured in gills and used to assess the impact of metals since their induction is regarded as an indicator of metal contamination (Bebianno and Serafim, 1998). Lead in particular inhibits the activity of the enzyme d-‐amino-‐ levulinic acid dehydratase (ALAD) (Company et al., 2008) and the ecotoxicological effect of this metal was determined by measuring ALAD activity in the whole soft tissues of clams. Exposure to organophosphorus compounds, substances widely used as pesti-‐ cides in agriculture, was diagnosed through the inhibition of acetylcholinesterase (AChE) activity in the gills (Bebianno et al., 2004; Cajaraville et al., 2000). Additionally, a nonspecific response associated with disruption in the lipid component of cellular membranes that reflects exposure and toxicity to pollut-‐ ants was assessed through lipid peroxidation (LPO) determined in the gills (Cajaraville et al., 2000; Viarengo et al., 2007). Genotoxic potential of contaminants was also evaluated due to their ability to interfere with DNA integrity (Steinert et al., 1998) analysing DNA damage in clam’s haemolymph with the alkaline single-‐cell gel electrophoresis (Comet) assay. Finally, estrogenic contamination was assessed through the effect of xenoestrogens, vitellogenin induction mainly in males and immature females, applying the indirect alkali-‐labile phosphate (ALP) method to clam’s gonads (Matozzo et al., 2008).
The use of a battery of different biomarkers enables the assess-‐ ment of a variety of responses but it does not completely replace the chemical approach (Bebianno et al., 2004; Cravo et al., 2009). There-‐ fore, in this study selected contaminants were also analyzed in clams tissues: metals (cadmium, copper, nickel, lead, zinc), Tributyltin (TBT) and PAHs (mostly associated with boat traffic). Environmental factors (biotic and abiotic such as condition index, temperature, salinity, pH, dissolved oxygen of the water and sediment organic matter) may also influence biological responses and were incorporated in this assess-‐ ment for a proper interpretation of the data.
Successful application of the biomarker approach in environ-‐ mental assessment is limited without an integrated system to overcome difficulties in relating information and in categorizing sites according to pollutant-‐induced changes in the health status of the organisms. To address this issue biomarkers-‐based indices were developed that rank sampling sites according to contamination gradients (Beliaeff and Burgeot, 2002; Dagnino et al., 2007) and provide environmental managers with decision-‐support tools to evaluate the ecosystems “health”. In this study, two different
biomarker indices were used: the Integrated Biomarker Response (IBR) index (Beliaeff and Burgeot, 2002) and the Health Status Index (HSI) calculated by the expert system (Dagnino et al., 2007). 2. Materials and methods
2.1. Study area
The Ria Formosa is a highly productive mesotidal lagoon system in the South Coast of Portugal characterized by a seaward belt of dunes protecting a system of salt marshes, subtidal channels and tidal flats that interact with the surrounding oceanic waters via several inlets (Ribeiro et al., 2008). This lagoon is considered a valuable resource for tourism, salt extraction, fisheries and aquaculture, with a long tradition of bivalve harvesting (20% of total area of the lagoon), like the clam Ruditapes decussatus. The Ria Formosa lagoon does not receive any significant freshwater input, except for a small river (Gilão, with a drainage area of w230 km2, with 56 km long, discharging close to the city of Tavira, about w25 km from the study area), having several point and diffuse pollution sources from domestic and industrial discharges, aqua-‐ culture effluents, agriculture drainages and boat traffic. The present study was undertaken at the middle region of the lagoon, in the most important shellfish bed area within this ecosystem, which accommodates one the major fishing harbours in the South Coast of Portugal. This area is known to be affected by contaminants due to intensive boat traffic and magnitude of fish products in an area of reduced hydrodynamic conditions (Bebianno et al., 2007; Coelho et al., 2002; Cravo et al., 2009; Maria et al., 2009).
2.2. Sampling
Clams (33.41 Æ 1.5 mm) were collected in a monthly basis, from July 2007 to December 2008, in four shellfish beds selected according to different environmental characteristics (Fig. 1), around low tide, in the morning period (9e11 h). Site 1 (S1) is located near a Sewage Treatment Plant (STP, z250 m) that serves a population of w45 000 equivalent inhabitants; site 2 (S2) is in one of the main inner channels; site 3 (S3) is in front of the fishing harbour and recreational pier; and site 4 (S4) is in one of the main channels, closer to the major inlet.
The physical-‐chemical characterization of the water was carried out in situ by measuring temperature, salinity, pH, and % oxygen saturation with a multiparametric probe YSI 6600. Sediment organic content was determined in 3 random replicates of the surface sediment layer (z5 cm) for each shellfish bed as the percentage of weight loss by combustion at 450 C for 4 h after achieving constant weight by drying at 100 C for 24 h. Clams were collected (n z 100 in each shellfish bed) for chemical and biomarker analysis, transported alive to the laboratory in cold containers (w4 C). For metals, TBT and PAHs analysis, clams were
collected in July and October of 2007 and in July, October and December of 2008. Additionally, in the summer of 2008 clams were also collected monthly for metals analysis and depurated for a period of 48 h and stored at À20 C. Contaminants were deter-‐ mined in the whole soft tissues. For biochemical analyses clams were collected monthly and total soft tissues, gills and gonads were separated and haemolymph collected, and immediately frozen in liquid nitrogen and stored at À80 C until further use.
2.3. Chemical analysis 2.3.1. Metal analysis
Cadmium, copper, nickel, zinc and lead concentrations were determined on dried (80 C) subsamples of the whole tissues of
Fig. 1. Sampling sites within the Ria Formosa lagoon. Adapted from: http://www.icn.pt/website/viveiros/viewer.htm. Markings represent shellfish bed areas.
clams (w1 g of dried tissue, n ¼ 5). Samples were wet digested with nitric acid (HNO3) and analysed by atomic absorption spectropho-‐ tometry (AAS AAnalyst 800 -‐ Perkin Elmer). Quality assurance was checked using a standard reference material (Lobster Hepatopan-‐ creas) provided by the National Research Council, Canada e TORT II. The values (mean Æ standard deviation) obtained were
27.2 Æ 0.9 mg gÀ1 for Cd, 106.5 Æ 1.8 mg gÀ1 for Cu, 2.3 Æ 0.1 mg gÀ1 for Ni, 0.3 Æ 0.02 mg gÀ1 for Pb and 193.7 Æ 7.1 mg gÀ1 for Zn compared with the certificated values of 26.7 Æ 0.6 mg gÀ1, 106.0 Æ 10.0 mg gÀ1,
2.5 Æ 0.2 mg gÀ1, 0.4 Æ 0.1 mg gÀ1 and 180.0 Æ 6.0 mg gÀ1, respec-‐
tively. All metal concentrations are expressed as mg per g of dry weight.
2.3.2. TBT analysis
Tributyltin (TBT) was measured in the whole soft tissue of clams (n ¼ 5) by atomic absorption spectrophotometry (AAS AAnalyst 800 -‐ Perkin Elmer), as described by Bryan et al. (1986) and Langston et al. (1987) and expressed as mg gÀ1 dry weight. Quality
assurance was checked using a standard reference material (CMR477, Tributyltin in mussel tissue). The value (mean Æ standard deviation) obtained was 2.0 Æ 0.1 mg gÀ1 of TBT (Sn(C4H9)3) compared to the certified value of 2.2 Æ 0.2 mg gÀ1 of TBT.
2.3.3. PAHs analysis
Polycyclic Aromatic Hydrocarbons (PAHs) were identified and quantified in clams whole soft tissues (n ¼ 5) by HPLC-‐UV and expressed as ng gÀ1 dry weight. A standard containing 16 individual PAHs (EPA 610 PAH mix, Sigma) was used, as described in Cravo et al. (2009), with a detection limit from 0.01 to 0.04 ng gÀ1 dry
weigh for each individual PAH. Measurements were validated using a standard reference material of mussel tissue (SRM 2977; NIST, USA) with recoveries between 73 and 112%.
2.4. Condition index (CI)
To assess the physiological state of the organisms, the soft tissues and shells of fifteen clams were weighted and the condition
index (CI) was estimated as a percentage of the ratio between the dry weight of the soft tissues (g) and the dry weight of the shell (g) (Moschino and Marin, 2006). Dry weight of soft tissues and shells were obtained at 80 C, during a maximum period of 24 h, until reaching constant weight.
2.5. Biochemical analysis 2.5.1. Metallothionein (MT)
Metallothionein (MT) concentrations were determined in gills of R. decussatus (n ¼ 5) according to the method developed by Bebianno and Langston (1989) and detailed in Cravo et al. (2009). MT concentrations are expressed as a milligram per gram of total protein concentration.
2.5.2. d-‐Aminolevulinic acid dehydratase (ALAD)
d-‐aminolevulinic acid dehydratase (ALAD) activity (EC 4.2.1.24) was determined in the whole soft tissues of clams (n ¼ 5) according to the European standardized method for d-‐ALAD activity deter-‐ mination in blood (Berlin and Schaller, 1974) and expressed as ng of porphobilinogen (PBG) per min per mg of total protein. The methodology is fully described in Cravo et al. (2009).
2.5.3. Acetylcholinesterase (AChE)
Acetylcholinesterase (AChE) activity was determined in the gills of clams (n ¼ 5), according to the colorimetric method of Ellman et al. (1961) and described in Cravo et al. (2009). This method is based on the coupled enzyme reaction of acetylthiocholine as the specific substrate for AChE and 5,50 -‐dithio-‐bis-‐2-‐nitrobenzoate as
an indicator for the enzyme reaction at 450 nm. AChE activity is expressed in nmol per min per mg of total protein.
2.5.4. Lipid peroxidation (LPO)
Lipid peroxidation (LPO) was determined in the same gill samples used for MT determination according to the method developed by Erdelmeier et al. (1998), described in Cravo et al.
(2009) and expressed as nmol MDA and 4-‐HNE per g of total protein.
2.5.5. DNA damage
DNA damage was detected according to the Comet assay, in haemocytes collected from the posterior adductor muscle of clams (n ¼ 10). The Comet assay applied was a slightly modified version of that previously described by Singh et al. (1988), and the Olive Tail Moment (product of comet tail length and quantity of DNA in the comet tail) was the comet parameter chosen to characterize the DNA damage.
2.5.6. Vitellogenin-‐like proteins
The levels of vitellogenin-‐like (Vg-‐like) proteins were deter-‐ mined in gonad tissues of 15 clams (separated by gender in a similar ratio) by an indirect alkali-‐labile phosphate method (ALP), according to Blaise et al. (1999) and described in detail in Pereira et al. (in press). Total ALP concentrations were normalized as to the total protein content of the gonad, and results are expressed as
mg of phosphate per mg of total protein concentration.
2.6. Total protein concentrations
Total protein content of clam gills and total tissues was measured by the Lowry method (Lowry et al., 1951) using Folin’s Reagent. For the ALP assay, the total proteins were determined by the Bradford method (Bradford, 1976). In both cases Bovine Serum Albumin (BSA) was used as reference standard.
2.7. Statistical analysis
All data was tested for normality and homogeneity of variance. One-‐way analysis of variance (ANOVA) or KruskaleWallis One Way Analysis of Variance on Ranks was applied to detect significant differences between sites. If significant, pairwise multiple-‐ comparison procedures were conducted using the Tukey or the Dunn’s tests. Pearson’s correlation analysis was performed to verify existing relationships between biomarkers, contaminants and environmental parameters. Additionally, Principal Component Analysis (PCA) was also applied to the mean values from the 4 sites to evaluate the relationships between variables. To discriminate the differences between months with higher environmental stress among the two years of sampling another PCA analysis was con-‐ ducted. Statistical significance was defined at p < 0.05, and analysis was performed with XLStat2009Ò.
2.8. Biomarker indices
The Integrated Biomarker Response (IBR) was applied for each site, combining the biomarkers responses in clam tissues (MT, ALAD, AChE, LPO, DNA damage and ALP in males and females) following the method described by Beliaeff and Burgeot (2002). To contribute also to a decision-‐support tool or expert system capable of integrating the selected biomarkers battery in the five-‐level Health Status Index
Table 1
Ranks and corresponding to colour codes for the ecological quality indices applied to the sites within the Ria Formosa Lagoon.
Ranks A B C D E
Levels of health status Healthy Low stress Medium stress High stress Pathological Colour code Blue Green Yellow Orange Red
(HSI) developed by Dagnino et al. (2007) was applied for each site using the DiSAV Expert System (DES). The results of both indices obtained for each site were adapted to a colour code (Table 1) to match the Ecological index established by the European Union Water Framework Directive (Directive, 2000/60/EC).
3. Results
3.1. Environmental parameters
Water and sediment features measured at each site from July 2007 to December 2008 are in Table 2.
Table 2
Environmental parameters measured monthly in water and organic matter in sediments from sites 1 to 4 in the Ria Formosa lagoon between July 2007 and December 2008. T e temperature, S e salinity, DO e dissolved oxygen, OMS e organic matter in sediment.
Sites 1 Month Jul 07 Aug 07 Sep 07 Oct 07 Apr 08 Jun 08 Jul 08 Aug 08 Sep 08 Oct 08 Nov 08 Dec 08 Mean Æ std Jul 07 Aug 07 Sep 07 Oct 07 Apr 08 Jul 08 Aug 08 Sep 08 Nov 08 Dec 08 Mean Æ std Jul 07 Aug 07 Sep 07 Oct 07 Feb 08 Apr 08 Jun 08 Jul 08 Aug 08 Sep 08 Dec 08 Mean Æ std Jul 07 Aug 07 Sep 07 Oct 07 Nov 07 Feb 08 Apr 08 Jun 08 Jul 08 Aug 08 Sep 08 Oct 08 Nov 08 Dec 08 Mean Æ std T ( C) 24.3 23.0 22.8 21.5 17.8 22.9 27.5 22.5 21.0 22.0 16.6 13.1 21.3 Æ 4.0 26.7 25.5 24.8 22.6 19.5 25.5 22.6 22.8 14.9 14.6 22.0 Æ 4.4 22.9 25.5 22.5 21.6 17.9 19.4 22.3 24.8 21.3 22.8 12.5 21.2 Æ 3.6 26.8 26.2 22.7 21.0 17.7 18.1 19.2 22.8 25.6 22.3 22.1 18.8 14.3 13.3 20.8 Æ 4.1 S 36.5 36.1 37.0 36.8 34.9 36.6 37.0 37.6 36.5 35.4 36.1 35.6 36.3 Æ 0.9 36.8 35.9 36.5 36.6 36.1 36.1 36.1 36.5 36.5 36.1 36.3 Æ 0.3 36.8 35.9 36.8 36.3 35.1 35.6 36.1 36.2 36.2 36.4 35.8 36.1 Æ 0.5 37.4 36.1 36.3 36.8 36.6 34.9 35.9 36.2 36.2 35.8 36.3 35.7 36.2 36.1 36.2 Æ 0.1 pH 8.1 7.8 7.5 7.7 7.8 7.7 8.4 8.1 7.7 7.8 7.9 7.8 7.9 Æ 0.3 8.3 8.5 7.7 8.3 8.2 8.6 8.5 8.3 7.9 8.2 8.3 Æ 0.3 7.7 8.0 7.4 8.2 7.9 8.0 7.7 8.2 8.3 8.3 7.9 8.0 Æ 0.3 8.0 8.6 7.9 8.3 8.6 8.2 8.3 7.7 8.5 8.5 8.2 7.9 7.6 8.0 8.2 Æ 0.3 DO (%) 112 50 67 131 74 76 139 98 95 88 94 99 93 Æ 29 160 71 103 113 126 182 139 138 94 131 126 Æ 34 112 60 71 105 58 69 73 132 119 136 115 96 Æ 30 142 76 109 115 117 67 81 104 156 126 122 81 82 118 107 Æ 26 OMS (%) 2.0 2.2 1.2 1.6 2.1 2.1 1.5 2.7 2.0 1.2 1.9 2.2 1.9 Æ 0.5 0.8 0.8 1.0 0.8 1.0 1.2 0.9 0.8 1.0 1.1 1.0 Æ 0.2 0.9 1.4 0.6 0.7 0.9 0.9 1.1 6.1 0.7 1.2 0.7 1.4 Æ 1.6 0.4 4.9 0.7 0.9 0.7 0.9 0.7 0.8 0.8 0.8 0.8 0.9 0.7 0.8 1.1 Æ 1.1 2 3 4
Temperature varied markedly during the sampling period, following the typical seasonal variation pattern. The highest levels at each site were in August 2007 and July of both years, ranging from 25.5 to 27.5 C and lowest in December (12.5e14.6 C). The
maximum (27.5 C) was at site 1 (July 2008), while the minimum
(12.5 C) in site 3 (December 2008). The mean water temperature (Table 2) diminished progressively from S2 ! S1 z S3 ! S4, however no significant differences exist between sites (p > 0.05). Salinity ranged from 34.9 (February and April 2008) to 37.6 (August 2008). Sites 1 and 4 had the highest salinity variation in winter/spring and summer respectively. The mean salinity levels (Table 2) diminished from S1 z S2 ! S4 ! S3 and, as for temper-‐ ature, there were no significant differences between sites (p < 0.05).
The pH values varied slightly between sites ranging between 7.4 (September 2007) and 8.6 (August, November 2007 and July 2008), with the lowest levels in site 1 and site 3 (7.5 and 7.4, respectively) and significantly higher in sites 2 and 4 (8.6) (p < 0.05). During the sampling period, the mean pH levels (Table 2) decreased from S2 ! S4 ! S3 ! S1, with significant differences between sites 1 and 2, sites 1 and 4 and sites 2 and 3 (p < 0.05).
The percentage of dissolved oxygen, like temperature, also varied considerably between sites and months. In August 2007 values were low ( 71%) in sites 1, 2 and 3 and in February 2008 in sites 3 and 4. The highest levels (>120%) were in July (2007 and 2008) for sites 1, 2 and 4 and in July and September 2008 for site 3. The mean percentage of dissolved oxygen in water (Table 2) fol-‐ lowed the pattern S2 ! S4 ! S3 ! S1, with only significant differ-‐ ences between sites 1 and 2 and sites 2 and 3 (p < 0.05).
The percentage of organic matter in the sediment was 1%, characteristic of sandy sediments, typical of shellfish beds areas. The highest percentage of organic matter (4.9 and 6.1%) was detected in summer (August 2007 and July 2008) in sites 4 and 3, respectively, suggesting a higher accumulation of organic matter in the sediments. This may be responsible for the decrease in the percentage of dissolved oxygen in water (and pH due to the release of carbon dioxide). The mean percentage of organic matter (Table 2) was higher in S1 ! S3 ! S4 ! S2, only with site 1 significantly different from sites 2 and 4 (p < 0.05).
3.2. Bioaccumulation of contaminants
Monthly and mean metal concentrations are in Table 3, while TBT and PAHs concentrations are in Table 4. Metal (Cd, Cu, Ni, Pb and Zn) concentrations varied, with no spatial and temporal pattern observed. However, clams from sites 1 and 2 had generally higher metal concentrations than the other sites. For Pb, signifi-‐ cantly highest concentrations exist in sites 2 and 4 (p < 0.05). However, no significant differences were found between the mean value of any metal for all the sampling sites (p > 0.05).
TBT concentrations ranged from 0.06 to 0.13 mg gÀ1 d.w. Levels were significantly higher in clams from sites 3 and 4 in July (2008 and 2007, respectively) (p < 0.05). However, there was also an increase in December 2008 in sites 1 and 2, which could be asso-‐ ciated to a uniform contamination of this compound throughout the year. The average TBT concentrations followed the spatial sequence: S3 ! S4 > S2 ! S1, despite only a significant difference was found between sites 1 and 3 (p < 0.05).
Table 3
Metal (Cd, Cu, Ni, Pb and Zn) concentrations of the total edible tissue of clams Ruditapes decussatus (n ¼ 5) collected in sites 1 to 4, measured every three months, between July 2007 and December 2008, expressed in a dry weight (dw).
Site 1 Month Jul 07 Oct 07 Jun 08 Jul 08 Ag 08 Oct 08 Nov 08 Dec 08 Mean Æ std Jul 07 Oct 07 Jul 08 Ag 08 Nov 08 Dec 08 Mean Æ std Jul 07 Oct 07 Jun 08 Jul 08 Ag 08 Sep 08 Mean Æ std Jul 07 Oct 07 Jun 08 Jul 08 Ag 08 Sep 08 Oct 08 Nov 08 Dec 08 Mean Æ std Cd (mg gÀ1 dw) 0.2 Æ 0.3 Æ 0.1 Æ 0.2 Æ 0.1 Æ 0.2 Æ 0.2 Æ 0.2 Æ 0.2 Æ 0.2 Æ 0.3 Æ 0.2 Æ 0.3 Æ 0.2 Æ 0.4 Æ 0.3 Æ 0.3 Æ 0.2 Æ 0.1 Æ 0.1 Æ 0.1 Æ 0.1 Æ 0.2 Æ 0.2 Æ 0.2 Æ 0.1 Æ 0.7 Æ 0.2 Æ 0.2 Æ 0.2 Æ 0.2 Æ 0.2 Æ 0.2 Æ 0.0 0.0 0.0 0.1 0.0 0.0 0.0 0.0 0.1 0.0 0.1 0.0 0.1 0.0 0.5 0.1 0.0 0.0 0.0 0.0 0.0 0.0 0.1 0.0 0.0 0.0 0.1 0.0 0.0 0.0 0.0 0.0 0.2 Cu (mg gÀ1 dw) 9.3 Æ 1.1 14.8 Æ 1.8 8.3 Æ 0.3 13.6 Æ 2.4 16.0 Æ 4.0 6.4 Æ 0.1 20.0 Æ 13.1 14.7 Æ 3.3 12.9 Æ 4.6 5.3 11.1 29.2 11.4 11.4 7.9 12.7 Æ 0.9 Æ 0.5 Æ 0.8 Æ 3.1 Æ 4.4 Æ 2.0 Æ 8.5 Ni (mg gÀ1 dw) 2.1 Æ 0.2 2.4 Æ 0.1 1.9 Æ 0.1 1.8 Æ 0.4 1.1 Æ 0.0 2.8 Æ 0.2 2.6 Æ 0.3 1.9 Æ 0.1 2.1 Æ 0.6 1.4 1.8 0.7 1.1 2.3 1.8 1.5 Æ 0.3 Æ 0.4 Æ 0.2 Æ 0.1 Æ 0.2 Æ 0.1 Æ 0.6 Pb (mg gÀ1 dw) 0.4 Æ 0.1 0.2 Æ 0.0 0.8 Æ 0.0 1.1 Æ 0.1 1.2 Æ 0.2 0.9 Æ 0.1 1.3 Æ 0.1 1.0 Æ 0.1 0.9 Æ 0.4 0.2 0.3 1.1 1.1 1.4 1.2 0.9 Æ 0.0 Æ 0.0 Æ 0.1 Æ 0.1 Æ 0.0 Æ 0.1 Æ 0.5 Zn (mg gÀ1 dw) 60.7 Æ 5.1 68.3 Æ 2.6 52.1 Æ 3.1 97.4 Æ 31.9 78.1 Æ 11.1 65.0 Æ 3.6 62.0 Æ 2.4 60.8 Æ 0.1 68.1 Æ 14.0 62.9 67.3 80.6 85.6 72.3 62.4 71.9 77.3 63.4 86.9 77.1 66.8 75.0 74.4 81.2 64.5 61.3 85.5 67.0 60.2 68.7 71.0 73.0 70.3 Æ 7.9 Æ 2.1 Æ 4.8 Æ 20.1 Æ 4.8 Æ 1.0 Æ 9.6 Æ 7.2 Æ 3.0 Æ 9.6 Æ 20.3 Æ 13.3 Æ 15.4 Æ 8.4 Æ 8.1 Æ 3.2 Æ 10.4 Æ 5.4 Æ 7.4 Æ 6.6 Æ 3.3 Æ 3.5 Æ 1.6 Æ 8.6 2 3 7.0 Æ 0.4 7.3 Æ 0.4 9.1 Æ 1.5 17.2 Æ 6.8 11.4 Æ 2.0 8.7 Æ 2.4 10.1 Æ 3.8 8.9 13.1 8.0 19.2 18.2 7.6 7.3 20.6 6.0 12.1 Æ 1.1 Æ 3.6 Æ 2.1 Æ 3.1 Æ 0.0 Æ 0.0 Æ 1.7 Æ 0.0 Æ 0.4 Æ 5.8 1.7 Æ 0.5 1.6 Æ 0.1 2.1 Æ 0.2 1.9 Æ 0.3 1.4 Æ 0.3 2.4 Æ 0.0 1.8 Æ 0.4 2.6 Æ 0.1 2.9 Æ 0.5 1.1 Æ 0.2 2.1 Æ 0.5 2.8 Æ 0.4 2.0 Æ 0.5 2.0 Æ 0.1 2.4 Æ 0.3 0.1 Æ 0.0 2.0 Æ 0.9 0.6 Æ 0.0 0.3 Æ 0.1 0.8 Æ 0.0 1.3 Æ 0.4 0.9 Æ 0.1 0.9 Æ 0.1 0.8 Æ 0.3 0.2 Æ 0.1 0.3 Æ 0.0 0.9 Æ 0.0 0.9 Æ 0.1 0.8 Æ 0.1 1.2 Æ 0.1 1.0 Æ 0.1 1.4 Æ 0.1 1.1 Æ 0.2 0.9 Æ 0.4 4
Table 4
TBT and PAHs concentrations of the total edible tissue of clams Ruditapes decussatus (n ¼ 5) collected in sites 1 to 4, measured every three months, between July and October 2007 and July and December 2008. TBT e Tributyltin, tPAHs e total PAHS, % PAHs with 2 þ 3 rings 4 rings and 5 þ 6 rings respectively.
Site 1 Month Jul 07 Oct 07 Jul 08 Oct 08 Dec 08 Mean Æ std Jul 07 Oct 07 Jul 08 Dec 08 Mean Æ std Jul 07 Oct 07 Jul 08 Mean Æ std Jul 07 Oct 07 Jul 08 Oct 08 Dec 08 Mean Æ std TBT (mg gÀ1 dw) 0.07 0.07 0.06 0.06 0.09 0.07 0.06 0.08 0.08 0.08 0.08 0.08 0.09 0.13 0.10 0.12 0.11 0.11 0.06 0.06 0.09 Æ Æ Æ Æ Æ Æ Æ Æ Æ Æ Æ Æ Æ Æ Æ Æ Æ Æ Æ Æ Æ 0.02 0.03 0.02 0.03 0.03 0.01 0.01 0.02 0.02 0.02 0.01 0.02 0.03 0.03 0.03 0.02 0.02 0.02 0.02 0.01 0.03 tPAHs (ng gÀ1 dw) 224 399 183 275 437 303 165 464 309 156 274 263 487 277 342 63 157 126 102 180 126 Æ Æ Æ Æ Æ Æ Æ Æ Æ Æ Æ Æ Æ Æ Æ Æ Æ Æ Æ Æ Æ 16 38 8 73 30 127 8 69 4 21 155 58 110 78 113 1 36 15 7 11 59 2þ3 rings (%) 30.7 75.5 55.4 47.3 60.8 54 Æ 17 14.1 29.7 35.2 38.4 29 Æ 11 24.6 6.5 36.4 22 Æ 15 2.6 28.0 35.7 47.2 26.3 28 Æ 16 4 rings (%) 20.7 2.4 2.1 9.2 5.2 8Æ8 18.5 11.3 16.9 5.5 22 Æ 15 7.2 10.6 4.8 8Æ3 6.6 2.9 13.0 5.0 15.3 9Æ5 5þ6 rings (%) 48.6 22.1 42.5 43.5 33.9 38 Æ 10 67.4 59.0 47.9 56.1 28 Æ 16 68.2 83.0 58.9 70 Æ 12 90.1 69.1 51.3 47.9 58.5 63 Æ 17 2 3 4
PAHs concentrations ranged from 63 to 487 ng gÀ1 d.w. Globally, the average PAH levels showed a decreasing pattern from S3 ! S1 ! S2 > S4, with only site 4 significantly lower than the remaining sites (p < 0.05). Although the temporal variation was not consistent for all sites, significantly highest concentrations were in sites 1, 2 and 3 (October 2007) and site 1 (December 2008) (p < 0.05). The maximum total PAH concentrations and mean percentage of high molecular weight (5 þ 6 rings ¼ 70%) was detected in clams from site 3.
3.3. Condition index
The condition index ranged from 7% to w17% (Table 5). The highest CI in clams collected in site 4 (June 2008, 16.6%) was significantly higher than the minimum at site 1 (November 2008, 7.0%) (p < 0.05). A decreasing pattern was detected in summer until November in all the four sites. The mean condition index varied as follows: S4 ! S2 ! S3 ! S1 and was not significantly different between sites (p > 0.05), except for site 1, where clams had a significantly lower mean condition index (p < 0.05).
3.4. Biomarkers responses
Biomarkers (MT, ALAD, AChE, LPO, DNA damage and Vg-‐like proteins (ALP)) for all sites are in Table 5.
Globally, the biomarkers responses are characterized by a high spatial and temporal variation, despite higher in summer months, i.e. JulyeOctober of both years, except ALP in immature individuals. No significant correlations exist between biomarkers and contaminants (p > 0.05).
Considering the biomarkers individually, MT was significantly higher in August 2007 (site 3) and in October 2007 (remaining sites) (>12.0 mg gÀ1prot, p < 0.05) and the minimum (<7 mg gÀ1 prot) in
all 4 sites. However, no significant differences exist between mean MT values for any of the sampled sites (p > 0.05). ALAD had the
lowest levels in August 2007 (site 3), July 2008 (site 1 and 2) and October 2008 (site 4), with a minimum (0.1 ngPBG min mgÀ1prot) at site 1 (July 2008). The significantly higher ALAD activity (6.1e6.9 ngPBG min mgÀ1 prot, p < 0.05) was in November 2007
(site 4) and April 2008 (site 1 and 3). However, significant differ-‐ ences between sites were only found for sites 2 and 3 (p < 0.05). AChE activity, typically inhibited by the presence of organophos-‐ phorus pesticides, carbamates and some metals (Lionetto et al., 2003), was generally lower in September 2007 in sites 1 and 4 and in September 2008 in sites 1 and 2 (<1.1 nmol min mgÀ1 prot), with the minimum at site 2 (0.3 nmol min mgÀ1 prot) (September
2008). These activities were significantly lower than the maximum levels (4.6e6.1 nmol min mgÀ1 prot) in April 2008 in the 4 sites.
Nevertheless, no significant differences were found between sites (p > 0.05). As for the damage biomarkers reflecting LPO and DNA damage, concentrations followed similar seasonal and spatial patterns. Significantly higher LPO values were in clams from sites 1 and 2 in August 2007 (536.1 and 464.1 nmol gÀ1 prot, respectively) and in sites 1 and 4 in November 2008 (428.2 and 409.7 nmol gÀ1 prot, respectively) (p < 0.05). DNA damage was
significantly higher between July and September 2007 in all sites (max 11.1 arbitrary units) and in April 2008 (site 4, 10.0 arbitrary units) (p < 0.05). While no significant differences were found for DNA damage between sites (p > 0.05), for LPO a significant differ-‐ ence was found between sites 3 and 4 (p < 0.05). Vitellogenin-‐like protein concentrations, indirectly determined as alkali-‐labile phosphates (ALP), were separated by gender since increases in Vg-‐ like proteins in males and immature individuals are a better reflex of environmental exposure to endocrine disrupting compounds (EDCs) (Blaise et al.,1999; Matozzo et al., 2008). ALP levels in females and males were generally higher in summer but only signifi-‐ cantly different at site 4 in July 2008 (>150 mg PO4 mgÀ1 Prot)
(p < 0.05). Significantly minimum concentrations were in winter (<30 mg PO4 mgÀ1 Prot) when only immature individuals were found (p < 0.05). However, no significant differences exist between sites, neither for females, males or immature clams (p > 0.05).
3.5. Relationships between abiotic factors contaminants and biomarkers
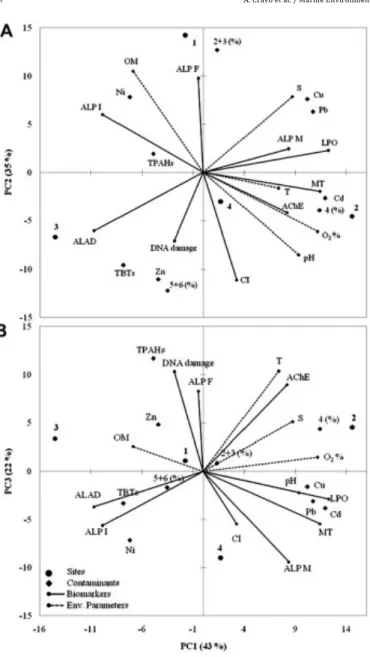
Principal Component Analysis (PCA) was applied to environ-‐ mental parameters contaminants and biomarkers by site and throughout the whole sampling period (mean values) to better understand the global results and depict the spatial association of sites (Fig. 2). PC1 accounts for 43% of the variance and shows that the most different sites were 2 and 3. PCA indicates site 2 as the most environmentally stressed and site 3 as the least impacted. Site 2 is associated with stronger biomarkers response (MT, ALAD, AChE, LPO and ALP in males) in clams, the highest mean concentrations of Cd, Cu and Pb, and 4 rings PAHs, as well as environmental parameters (temperature, salinity, pH and dis-‐ solved oxygen). In opposition, clams from site 3 showed lower biomarkers response, despite having the highest mean concen-‐ trations of Zn, TBTs, total PAHs (mainly 5 þ 6 rings) and Vg-‐like proteins in immature individuals. PC2 explains 35% of the vari-‐ ance and shows that clams from site 1 stand out with the highest ALP in females and immature individuals, and with the highest contribution of PAHs of low molecular weight (2 þ 3 rings) and Ni, as well as organic content in sediments. Lastly, PC3 explains 22% of the variance and differentiates site 4 that is associated with the lower mean temperature, concentration of PAHs, minimum DNA damage and Vg-‐like proteins in females and maximum condition index. However, it is associated with higher Vg-‐like proteins in males and immature clams, Ni and inhibition of AChE.
Table 5
Condition Index and biomarkers levels (mean Æ standard deviation) (n ¼ 5) in Ruditapes decussatus collected in the 4 sites in between July 2007 and December 2008 except for DNA damage where the standard error was used and n ¼ 10 and n ¼ 15 for ALP analysis.
Sites 1 Month Jul 07 Aug 07 Sep 07 Oct 07 Apr 08 Jun 08 Jul 08 Aug 08 Sep 08 Oct 08 Nov 08 Dec 08 Mean Æ std Jul 07 Aug 07 Sep 07 Oct 07 Apr 08 Jul 08 Aug 08 Sep 08 Nov 08 Dec 08 Mean Æ std Jul 07 Aug 07 Sep 07 Oct 07 Feb 08 Apr 08 Jun 08 Jul 08 Aug 08 Sep 08 Mean Æ std Jul 07 Aug 07 Sep 07 Oct 07 Nov 07 Feb 08 Apr 08 Jun 08 Jul 08 Aug 08 Sep 08 Oct 08 Nov 08 Dec 08 Mean Æ std CI (%) 12.1 11.3 9.2 8.0 9.1 10.2 10.4 10.2 10.6 9.9 7.0 7.4 9.6 13.3 11.6 10.8 10.5 11.6 11.7 12.3 15.6 9.8 8.2 11.9 12.7 13.4 10.2 9.0 7.1 10.0 13.2 13.0 12.5 13.9 11.5 15.2 14.6 10.7 10.2 9.7 10.1 13.2 16.6 12.8 12.8 13.7 15.2 11.2 10.8 12.6 Æ Æ Æ Æ Æ Æ Æ Æ Æ Æ Æ Æ Æ Æ Æ Æ Æ Æ Æ Æ Æ Æ Æ Æ Æ Æ Æ Æ Æ Æ Æ Æ Æ Æ Æ Æ Æ Æ Æ Æ Æ Æ Æ Æ Æ Æ Æ Æ Æ Æ 0.9 1.6 0.9 0.9 2.2 0.9 1.6 1.4 2.4 3.6 0.7 0.7 1.5 2.1 1.3 2.6 1.4 1.3 2.0 1.1 2.9 0.8 1.2 2.4 1.5 1.8 1.2 1.3 2.3 1.9 2.5 1.4 0.8 3.8 2.3 2.4 2.4 0.8 0.7 1.0 1.8 3.9 4.0 1.1 1.1 4.2 4.3 0.8 0.8 2.2 MT (mg gÀ1 prot) 11.8 8.4 5.1 12.6 12.1 6.4 8.2 7.5 8.4 6.3 4.8 7.2 8.3 11.0 6.7 7.0 16.9 8.0 10.5 8.6 9.1 6.8 7.9 9.2 8.5 14.1 6.6 10.2 8.1 5.4 2.8 9.9 7.1 3.8 7.6 11.8 7.1 3.1 16.9 16.5 9.6 11.2 6.9 8.4 8.1 4.4 7.8 8.7 8.8 9.2 Æ Æ Æ Æ Æ Æ Æ Æ Æ Æ Æ Æ Æ Æ Æ Æ Æ Æ Æ Æ Æ Æ Æ Æ Æ Æ Æ Æ Æ Æ Æ Æ Æ Æ Æ Æ Æ Æ Æ Æ Æ Æ Æ Æ Æ Æ Æ Æ Æ Æ 2.5 1.3 0.5 1.3 1.4 0.3 1.1 0.9 1.2 0.4 1.0 0.6 2.6 1.9 1.3 1.3 0.0 1.2 3.4 1.0 1.5 0.5 0.2 3.1 4.4 3.4 0.9 2.1 1.4 1.3 0.2 1.8 1.3 1.3 3.3 3.2 2.3 0.8 2.9 3.6 1.5 2.6 2.0 1.6 0.7 1.0 1.5 2.5 1.8 3.9 ALAD (ngPBG min mgÀ1 prot) 0.7 0.3 0.6 1.8 6.1 1.4 0.1 0.8 1.0 0.2 1.6 1.9 1.4 2.2 1.6 0.7 1.6 0.8 0.6 0.7 0.8 2.0 1.8 1.3 1.3 1.2 1.3 1.3 2.3 6.9 3.1 3.6 1.9 2.6 2.5 1.5 0.4 1.0 3.1 6.2 2.7 1.2 2.0 2.2 1.6 2.3 0.3 2.7 2.8 2.1 Æ Æ Æ Æ Æ Æ Æ Æ Æ Æ Æ Æ Æ Æ Æ Æ Æ Æ Æ Æ Æ Æ Æ Æ Æ Æ Æ Æ Æ Æ Æ Æ Æ Æ Æ Æ Æ Æ Æ Æ Æ Æ Æ Æ Æ Æ Æ Æ Æ Æ 0.1 0.1 0.0 0.6 0.3 0.2 0.0 0.0 0.1 0.0 0.3 0.2 1.7 0.3 0.4 0.1 0.3 0.3 0.2 0.1 0.2 0.4 0.3 0.6 0.3 0.3 0.2 0.2 0.3 0.0 0.2 0.1 0.4 0.3 1.7 0.1 0.1 0.2 0.4 1.5 0.3 0.4 0.2 0.1 0.4 0.3 0.0 0.3 0.1 1.5
AChE (nmol min mgÀ1 prot) 2.2 5.1 0.7 1.6 6.1 1.7 1.6 2.0 0.5 1.2 3.1 3.3 2.4 3.0 4.9 3.0 1.2 4.6 1.5 0.9 0.3 5.0 2.3 2.7 2.7 4.0 1.5 1.9 2.6 6.1 1.5 1.2 1.7 1.5 2.5 2.1 3.8 1.1 1.2 1.3 4.5 4.6 2.5 2.6 1.5 1.8 1.5 2.8 2.2 2.4 Æ Æ Æ Æ Æ Æ Æ Æ Æ Æ Æ Æ Æ Æ Æ Æ Æ Æ Æ Æ Æ Æ Æ Æ Æ Æ Æ Æ Æ Æ Æ Æ Æ Æ Æ Æ Æ Æ Æ Æ Æ Æ Æ Æ Æ Æ Æ Æ Æ Æ 0.5 0.1 0.1 0.1 1.5 0.5 0.6 0.6 0.0 0.3 0.9 0.7 1.7 0.9 0.8 0.6 0.3 0.2 0.6 0.2 0.0 0.7 0.7 1.7 0.6 0.6 0.5 0.3 0.7 0.5 0.7 0.1 0.6 0.2 1.5 0.2 0.7 0.3 0.3 0.2 1.3 0.9 0.4 0.8 0.6 0.7 0.4 0.8 0.8 1.2 LPO (nmol gÀ1 prot) 137.0 536.1 86.1 111.1 116.4 59.5 113.6 157.7 194.8 173.5 428.2 221.0 194.6 382.6 464.1 92.9 148.0 127.6 158.2 125.5 226.7 319.1 224.2 226.9 184.1 107.3 55.7 203.2 136.4 298.7 94.3 117.0 100.2 71.8 136.9 234.5 349.0 96.6 122.3 109.5 346.0 324.8 150.1 204.3 100.0 101.9 292.6 409.7 279.3 222.9 Æ Æ Æ Æ Æ Æ Æ Æ Æ Æ Æ Æ Æ Æ Æ Æ Æ Æ Æ Æ Æ Æ Æ Æ Æ Æ Æ Æ Æ Æ Æ Æ Æ Æ Æ Æ Æ Æ Æ Æ Æ Æ Æ Æ Æ Æ Æ Æ Æ Æ 28.8 18.4 7.0 3.5 27.7 16.4 6.6 18.2 32.5 34.1 83.9 43.4 143.5 120.0 80.5 15.2 50.6 17.9 34.8 12.7 68.4 76.0 67.1 123.9 37.1 15.3 5.6 45.6 28.9 67.5 24.7 7.9 21.3 14.6 73.1 68.4 104.9 18.4 4.4 11.8 57.7 26.5 13.8 40.5 18.9 21.8 56.5 82.6 48.9 110.5 DNA Damage (arbitrary units) 11.1 9.8 4.6 6.0 5.1 3.5 3.8 5.2 4.0 5.5 3.3 2.6 5.4 10.8 4.4 6.3 9.0 6.0 3.0 4.9 5.9 3.3 2.9 5.7 8.9 9.5 3.7 5.2 5.2 7.3 5.9 3.5 5.7 3.8 5.9 9.1 4.6 3.5 4.8 5.2 5.8 10.0 5.5 3.2 5.1 4.1 5.9 3.9 2.9 5.3 Æ Æ Æ Æ Æ Æ Æ Æ Æ Æ Æ Æ Æ Æ Æ Æ Æ Æ Æ Æ Æ Æ Æ Æ Æ Æ Æ Æ Æ Æ Æ Æ Æ Æ Æ Æ Æ Æ Æ Æ Æ Æ Æ Æ Æ Æ Æ Æ Æ Æ 0.4 0.3 0.2 0.4 0.5 0.1 0.1 0.2 0.2 0.3 0.1 0.2 2.6 0.3 0.2 0.2 0.5 0.7 0.1 0.2 0.3 0.1 0.2 2.6 0.4 0.3 0.2 0.4 0.5 0.6 0.4 0.1 0.3 0.2 2.1 0.4 0.2 0.1 0.4 0.4 0.3 0.8 0.4 0.1 0.2 0.1 0.3 0.2 0.1 2.1 ALP F (mgPO4 mgÀ1 prot) 59.6 Æ 7.4 84.5 Æ 8.3 62.2 Æ 8.1 ALP M (mgPO4 mgÀ1 prot) 52.1 Æ 8.5 79.4 Æ 3.0 55.7 Æ 9.2 29.8 Æ 5.0 34.0 Æ 7.9 112.2 80.7 68.8 92.5 Æ Æ Æ Æ 0.0 9.6 9.0 0.0 90.4 102.7 131.3 79.4 Æ Æ Æ Æ 26.7 15.0 13.8 20.4
ALP I (mgPO4
mgÀ1 prot) 47.1 Æ 0.0 106.8 113.3 17.2 58.0 Æ Æ Æ Æ 19.3 15.3 3.3 41.5 80.1 Æ 18.6 62.8 Æ 2.3 74.1 Æ 8.0 70.5 Æ 3.5 84.4 Æ 27.4 63.5 Æ 8.4 80.1 Æ 9.6 70.9 Æ 5.9 2 24.1 Æ 3.4 20.4 Æ 3.1 95.0 Æ 18.1 65.7 Æ 13.3 105.4 Æ 25.7 54.2 Æ 10.5 63.3 Æ 13.4 19.7 Æ 5.1 30.9 Æ 21.6 73.6 Æ 12.7 23.4 Æ 3.5 65.7 Æ 3.7 66.0 Æ 6.2 74.8 Æ 19.6 13.9 Æ 0.7 55.2 Æ 7.3 72.0 Æ 4.1 3 59.5 Æ 0.0 28.9 Æ 3.0 25.9 Æ 5.5 78.4 Æ 16.2 113.5 76.0 56.9 106.4 72.5 Æ Æ Æ Æ Æ 17.4 19.1 9.7 25.6 30.5 100.6 59.1 68.9 65.5 62.2 Æ Æ Æ Æ Æ 23.5 2.4 19.5 16.7 25.9 85.4 Æ 0.0 55.6 Æ 27.5 4 31.4 Æ 4.6 106.0 Æ 0.0 52.3 Æ 2.5 36.7 Æ 5.3 82.6 Æ 7.1 53.8 Æ 9.3 39.6 29.0 50.9 32.8 75.5 Æ Æ Æ Æ Æ 0.0 6.4 4.4 6.7 17.6 67.0 Æ 10.2 157.4 Æ 24.5 53.6 Æ 15.0 145.7 Æ 28.5 177.1 Æ 24.5 57.7 Æ 11.2 108.8 Æ 27.8 63.0 96.8 49.2 27.9 51.6 Æ Æ Æ Æ Æ 15.6 18.8 8.9 2.4 23.3 77.9 Æ 46.1 94.6 Æ 51.8
The influence of environmental variables was evident, as confirmed by the correlation analysis that revealed significant associations between biomarkers and environmental parameters but not with contaminants. ALAD activity was negatively related with temperature (p < 0.05), AChE with salinity and dissolved oxygen (p < 0.05) and LPO values with dissolved oxygen (p < 0.05). DNA damage also showed a positive significant correlation with MT (p < 0.05), suggesting that factors responsible for MT induction may promote DNA damage.
Data also revealed that biomarkers response between summer months in 2007 and 2008 were clearly different. To have an insight of the seasonal variability of data regarding the more stressful months (July to October) in the consecutive years (2007 and 2008), another PCA was applied to the monthly data (Fig. 3). PC1 is
responsible for 36% of the variance and shows a clear separation between summer months of the different years (and also between sites). In 2007 the most important factors are the higher concen-‐ trations of MT, LPO and DNA damage coupled with higher levels of Ni and PAHs (5 þ 6 rings), while in 2008 the dominant factors are ALP (males and females), Pb, Cu e Zn and PAHs (2 þ 3 rings), dis-‐ solved oxygen and inhibition of ALAD and AChE. PC2 accounts for 19% of the variance, showing a spatial separation of sites, with sites 1 and 2 closely related to higher biomarker responses (MT, LPO, DNA damage and ALP in males), total PAHs (mainly 2 þ 3 and 4 rings) and Cd. On the other hand, sites 3 and 4 are closely related and more seasonally affected by environmental parameters (temperature, salinity, pH and dissolved oxygen), Ni, TBT and PAHs (5 þ 6 rings).
30 A. Cravo et al. / Marine Environmental Research 75 (2012) 23e34
Fig. 3. Principal Component Analysis (PCA) of the biomarkers, contaminant levels (metals, TBT and PAHs) in the clam Ruditapes decussatus and environmental parame-‐ ters from the 4 sites (S1-‐S4) within the Ria Formosa lagoon in the summer months (July to October) separated by the consecutive years 2007 (07) and 2008 (08): PC1 vs PC2. T e temperature, S e salinity, O2 e oxygen, OM e organic matter, CI e condition index, Cd e cadmium, Cu e copper, Ni e nickel, Pb e lead, Zn e zinc, TBT e tributyltin, TPAHs e total polycyclic aromatic hydrocarbons, % PAH’s with 2 þ 3 rings, % PAH’s with 4 rings, % PAH’s with 5 þ 6 rings, MT e metallothionein, ALAD e d-‐aminolevulinic acid dehydratase, AChE e acetylcholinesterase, LPO e lipid peroxidation, ALP F e alkali-‐ labile phosphates in females, ALP M e alkali-‐labile phosphates in males, ALP I e alkali-‐labile phosphates in immatures.
Fig. 2. Principal Component Analysis (PCA) of the biomarkers, contaminant levels (metals, TBT and PAHs) in the clam Ruditapes decussatus and environmental parame-‐ ters from the 4 sites within the Ria Formosa lagoon between July 2007 and December 2008: A) PC1 vs PC2, B) PC1 vs PC3. T e temperature, S e salinity, O2 e oxygen, OM e organic matter, CI e condition index, Cd e cadmium, Cu e copper, Ni e nickel, Pb e lead, Zn e zinc, TBT e tributyltin, TPAHs e total polycyclic aromatic hydrocarbons, % PAH’s with 2 þ 3 rings, % PAH’s with 4 rings, % PAH’s with 5 þ 6 rings, MT e metal-‐ lothionein, ALAD e d-‐aminolevulinic acid dehydratase, AChE e acetylcholinesterase, LPO e lipid peroxidation, ALP F e alkali-‐labile phosphates in females, ALP M e alkali-‐ labile phosphates in males, ALP I e alkali-‐labile phosphates in immatures.
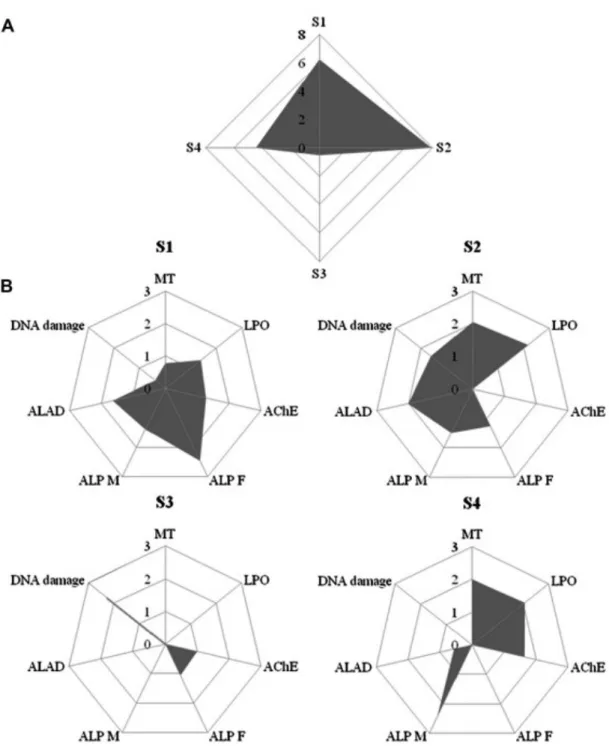
such as Pb, Cd, Cu and 4 rings PAHs (Table 3). In site 3, considered the healthier, the main contribution comes from DNA damage, reflecting the presence of genotoxic compounds, despite of low effect when using the Mitchelmore et al. (1998) grade. Finally, in site 4 the greater influence is from Vg-‐like proteins in males, LPO and MT, indicating the presence of metals (e.g. Cd, Cu, Pb and Ni; Table 3), EDCs and other compounds with the capacity to induce oxidative alterations.
Like for the IBR, the Health Status Index (HSI) integrates the information of the battery of biomarkers into a five-‐level status index. Both IBR and HSI were adapted to a colour code (Table 1), where the results are the same for both indices, with site 3 as the shellfish bed site where clams had a classification of A, corre-‐ sponding to a colour code blue (Table 1), i.e. clams are healthy, while the others had a classification of C, corresponding to a colour code yellow, i.e. clams are under medium stress.
4. Discussion 3.6. Biomarkers indices
The Integrated Biomarker Response (IBR) globally points site 3 (Fig. 4A) where clams are the least stressed, despite the higher levels of TBTs and PAHs and site 2 where clams are under higher stress, corroborating the information given by the PCA analysis (Figs. 2 and 3). Considering each site individually, the biomarkers with greater contribution in site 1 are the Vg-‐like proteins in females and males and ALAD, indicating the presence of EDCs and metals like lead, respectively. In site 2, considered the more stressed in the global IBR, LPO, ALAD and MT have the highest contributions, globally decreasing clams health and pointing to the presence of metals and other compounds of prooxidant nature,
Regarding the accumulation of the analysed contaminants (Tables 3 and 4), the levels were not particularly high. Metal concentrations in clam tissues were in the same order of magnitude but lower than those previously reported for the Ria Formosa lagoon (Bebianno, 1995; Bebianno and Serafim, 2003; Cortesão et al., 1986; Serafim and Bebianno, 2001). This decrease in metal concentrations represents an improvement of the lagoon’s water quality due to the enhancement of sewage treatment, better agricultural practices/ reduction of fertilizers and pesticides or more specifically in the case of lead due to the use of unleaded petrol. The highest TBT levels were in site 3 that is near the most important fishing harbour in the lagoon, which constitute a continuous TBT source, despite being forbidden since 2003. It is known that TBT is highly persistent in the
31
Fig. 4. Integrated Biomarkers Response (IBR) of Ruditapes decussatus collected in the Ria Formosa lagoon from July 2007 to December 2008: A) IBR for all 4 sites, B) Biomarkers star plots for each site. MT e metallothionein, LPO e lipid peroxidation, AChE e acetylcholinesterase, ALP F e alkali-‐labile phosphates in females, ALP M e alkali-‐labile phosphates in males, ALAD e d-‐aminolevulinic acid dehydratase.
environment; however, values are lower than in previous studies in shellfish beds from the same region (Coelho et al., 2002). In what concerns PAHs, the maximum concentration was also in site 3 with levels similar to others from the same ecosystem (Barreira et al. 2007a; Bebianno and Barreira, 2009).
Considering the biomarkers responses (Table 5), the range ob-‐ tained is consistent with those in previous years in the Ria Formosa lagoon for MT (Bebianno and Serafim, 1998, 2003; Bebianno et al., 2000; Geret et al., 2003; Serafim and Bebianno, 2001), ALAD (data not published), AChE (data not published), LPO (Geret et al., 2003) and ALP (Pereira et al., in press). With respect to DNA damage, the only comparable data for bivalves from the Ria Formosa is with mussels Mytilus galloprovincialis (Almeida et al., 2011) that also
points to similar seasonal fluctuations, with higher levels in summer. Applying the criteria established by Mitchelmore et al. (1998) (expressed in the same comparable unit) the DNA damage is minimal (<10%), suggesting that the genotoxic potential of contaminants is small and can be considered baseline for future genotoxicity studies regarding this species in this ecosystem. However, no significant correlations were found between biomarkers and contaminants, supporting that contaminants are not particularly high to promote clear and strong biomarker responses and/or biomarkers are not responding specifically to these contaminants or even that other factors (like effects of abiotic environmental factors) can be affecting the high biomarker vari-‐ ability. In ecosystems where pollutants occur in mixtures, as in the