Allometric model for estimating leaf area in clonal varieties of coffee
(
Coffea canephora
)
1Modelo alométrico para estimativa da área foliar de variedades clonais de café
(
Coffea canephora
)
Edilson Romais Schmildt2*, José Augusto Teixeira do Amaral3, Jeangelis Silva Santos4 e Omar Schmildt5
ABSTRACT -The evaluation of leaf area is required in several agronomic studies given their importance to assess the plant growth. The objective of this study was to use statistical models to estimate leaf area of five clonal varieties of coffee (Coffea canephora) from linear dimensions (length and width maximum). Were used in the studies five varieties ofCoffea canephora Pierre ex Froehner: Emcapa 8111, Emcapa 8121 Emcapa 8131, Emcapa 8141 and at Incaper 8142. The results obtained in this study allow us to conclude that the linear model expresses the best estimate of leaf area. Among the different independent variables adopted, the product of length and greatest width (L.W) was found to be the greatest significance and higher coefficients of determination (R2). The regression equation that best expresses the
estimated leaf area for the five clonal varieties is i = 0.6723 + 0.6779 xi, where xi represents the product of the greatest length and the greatest width of the leaves.
Key words:Coffea canephora. Leaf dimension. Non-destructive method.
RESUMO - A mensuração da área foliar é requerida em vários estudos agronômicos, em função de sua importância para avaliar o crescimento das plantas. O objetivo deste trabalho foi utilizar modelos estatísticos, para estimar a área foliar de cinco variedades clonais de café (Coffea canephora), a partir das dimensões lineares (comprimento e largura máximos)
do limbo foliar. Foram utilizadas nos estudos cinco variedades de Coffea canephora Pierre ex Froehner: Emcapa
8111, Emcapa 8121, Emcapa 8131, Emcapa 8141 e Incaper 8142. Os resultados alcançados neste estudo permitem concluir que o modelo linear expressa melhor a estimativa de área foliar. Dentre as diferentes variáveis independentes adotadas, o retângulo circunscrito à folha (C.L) foi a que proporcionou maiores significâncias e maiores coeficientes de determinação (R2). A equação de regressão que melhor expressa a estimativa da área foliar para as cinco variedades
clonais é: i = 0,6723 + 0,6779 xi; em que xi representa o produto entre o maior comprimento e a maior largura do limbo foliar.
Palavras-chave:Coffea canephora. Dimensão foliar. Método não destrutivo.
DOI: 10.5935/1806-6690.20150061 *Autor para correspondência
1Recebido para publicação em 14/11/2012; aprovado em 21/05/2015
Parte do trabalho de Iniciação Científica do terceiro autor, com bolsa do CNPq.
2Departamento de Ciências Agrárias e Biológicas/DCAB, Universidade Federal do Espírito Santo, Rodovia BR 101 Norte, km 60, São Mateus-ES,
Brasil, 29.932-540, e.romais.s@gmail.com
3Departamento de Produção Vegetal, Centro de Ciências Agrárias, Universidade Federal do Espírito Santo/CCA/UFES, Alegre-ES, Brasil,
jata@cca.ufes.br
4Departamento de Engenharia Florestal, Centro de Ciências Agrárias, Universidade Federal do Espírito Santo/CCA/UFES, Alto Universitário,
Caixa Postal 16, Alegre-ES, Brasil, jeangelis@gmail.com
5Programa de Pós-Graduação em Agricultura Tropical, Centro Universitário Norte do Espírito Santo/CEUNES/UFES, São Mateus-ES, Brasil,
INTRODUCTION
Coffee is a major source of income for the Brazilian economy, bringing many benefits to the country, among which can be highlighted a share in foreign exchange earnings, the transfer of income to other sectors of the economy, a contribution to capital formation in the agricultural sector of the country, as well as an effective capability to absorb manpower.
Knowledge of leaf area is fundamental, being one of the most important resources for assessing the growth and development of plants. By virtue of being linked to increases in dry matter, it becomes possible to estimate such physiological parameters as transpiration rate, net assimilation rate, leaf area ratio, specific leaf area and leaf area index (AMARALet al., 2009).
Destructive methods have the drawback of not being applicable when the number of replications or number of samples is limited, and when it is wanted to evaluate other characteristics besides the leaf area, or assess the interval of vegetative growth over time for any one leaf. They are also time consuming. Direct, non-destructive methods using modern equipment conserve the samples, but because of their heavy cost, such equipment is not always easy to obtain (BENINCASA, 2003).
The indirect, non-destructive method is the most suitable, mainly due to the logistical difficulties in obtaining data. This method consists in the application of dimensional analysis or allometry. Mathematical equations that relate linear measurements of the leaf blade to its actual area in order to estimate the leaf area, constitute an indirect, non-destructive method, which is very accurate and of low cost. This eliminates the need for leaf area meters or lengthy geometric reconstructions (AMARALet al., 2009; BENINCASA, 2003).
Research carried out by Antunes et al. (2008),
Awatramani and Gopalakrishna (1965), Barros et al.
(1973), Ferreiraet al. (2010), and Silva Leite and Ferreira
(2008), report estimating leaf area in Coffea arabica,
however, only the articles of Antunes et al. (2008) and
Partelliet al. (2006) talk ofCoffea canephora. It should
be noted that, as it is allogamous, varieties of the species
Coffea canephora generally present different shapes
of leaf blade (FONSECA et al., 2006). Due to these
variations in leaf morphology, differences may also occur in the equation model among varieties of the species.
In estimating a statistical model for leaf area in ginger (Zingiber officinale), Kandiannanet al. (2009) concluded
that the same equation can be used for the five varieties studied: Varada, Rejatha, Mahima, Maran and Himachal. A similar conclusion is arrived at by Aquinoet al. (2011)
for leaf area in the sunflower (Helianthus annuus) cultivars,
BR-122 and M-734. However, Araujo Santos and Prado (2005) found that response patterns when estimating leaf area were different between the mango (Mangifera indica)
cultivars, Tommy Atkins and Haden. Schmildtet al. (2014),
working with the Catuai Vermelho and Catucai varieties of arabica coffee (Coffea arabica), also found differences
in response patterns between cultivars. Sezer, Oner and Mut (2009), working with seven cultivars of maize, point out that a model of leaf area estimation found for one cultivar, should not be extrapolated to cultivars not yet investigated. In research into leaf area estimation with
Coffea canephora (ANTUNESet al., 2008; PARTELLI et al., 2006), statistical modelling for the different
clonal varieties of this species is not addressed. The aim of the present work was to use statistical models to estimate leaf area in five clonal varieties of coffee (Coffea canephora) from linear dimensions of
the leaf blade (length and maximum width).
MATERIAL AND METHODS
The work was carried out on the speciesCoffea canephora Pierre ex Froehner. Five clonal varieties,
developed by the Capixaba Institute of Research, Technical Assistance and Rural Extension (FERRÃO
et al., 2007), were employed: Emcapa 8111 (Precoce),
Emcapa 8121 (Intermediário), Emcapa 8131 (Tardio), Emcapa 8141 (Robustão capixaba) and Incaper 8142 (Conilon Vitória), all planted in 2004, and with leaves harvested in 2009. The first four varieties (Emcapa 8111, Emcapa 8121, Emcapa 8131 and Emcapa 8141), were planted in the experimental area of the Capixaba Institute of Research and Rural Extension (INCAPER) in Pacotuba, Cachoeiro do Itapamirim, in the state of Espírito Santo, Brazil (ES), at a spacing of 3.0 m x 1.20 m and 15,000 stems per hectare. The Incaper 8142 variety was planted in the experimental area of the Centre for Agricultural Sciences (CCA) of the Federal University of Espírito Santo (UFES), in the municipality of Alegre, at a spacing of 2.0 m x 1.0 m and 15,000 stems per hectare. The varieties were identified, and the leaves harvested, packed into plastic bags and transferred to the Forest Ecology Laboratory of the Centre for the Study and Diffusion of Forest Technology, Water Resources and Sustainable Agriculture (NEDTEC), CCA/UFES.
One hundred leaves from 20 plants of each variety were sampled, as suggested by Benincasa (2003). Leaves, at all stages of development and which were undamaged and showed no evidence of attack by disease or pests, were collected from each plant at the four cardinal points.
determined by means of a model LI-3100, LI-COR electronic area meter. For this, the meter was calibrated using a paper square of known area (100 cm²), which was then compared to the value given by the device. After determining the observed leaf area, measurements for the greatest width of the leaves (W) were taken, generally at a central position on the leaf, perpendicular to the lines of longest length. The longest length along the main rib (L) was also measured, considering the insertion point of the blade on the petiole to its apex (AMARALet al., 2009). To do this a
Digimess digital caliper was used. From the data for L and W, the product of L and W (L.W) was also determined.
From the 100 leaves of each variety, 50 leaves were later randomly selected and used in determining descriptive statistics (minimum, maximum, range, mean, median and coefficient of variation), as well as to model the observed leaf area (dependent variable = i) as a function of L, W and L.W as the independent variables (xi), by means of the models: linear ( i= 0 + 1xi), quadratic ( i= 0 + 1x + 2x2
i) and power
( i= 0x i
1), applying the three models to each clonal variety.
Validation of the models for leaf area estimation was based on the values estimated by the model ( i) and the observed values (Yi) for the five varieties. Initially, for each model, a simple linear regression of the leaf area estimated by the model (dependent variable) was fitted as a function of the observed leaf area (independent variable). The hypotheses, H0 0= 0 versus H1 0 0 and H0 1 = 1 versus H1 1 1 were tested by Student’s t-test at 5% probability. Next, the Pearson linear correlation coefficient (r) and the coefficient of determination (R2) were calculated between i and Yi. For each model, the root mean square error (RMSE) was calculated by means of the expression RMSE= n
i=1 i-Yi)2/n, where: i are the estimated values for leaf area, Yi are the observed values for leaf area and n is the number of leaves.
The criteria used to select models that best estimate leaf area in clonal varieties ofCoffea canephora
as a function either of the longest length of the leaf blade (L), or the greatest width of the leaf blade (W), or a rectangle circumscribed by the leaf (L.W), were linear coefficient not different to zero, slope not different to one, Pearson linear correlation coefficient (r) and coefficient of determination (R2) closest to one, and root mean square error (RMSE) closest to zero, as per Cargnelutti Filhoet al. (2012 a,b). Statistical analyses
were carried out using Microsoft Office Excel (LEVINE
et al., 2012) and the Genes software (CRUZ, 2013).
After selection of the best models, the confidence interval was determined with 95% significance for the parameters 0 e 1 in the estimating equations, and verifying that 0 e 1 were contained within the same interval, a single equation was fitted that would
represent all five clonal varieties. This was done based on the 250 leaves previously used to fit the models for each variety (50 leaves per variety). Validation of the new model was done using the 250 leaves previously used for validation, i.e. 50 leaves from each variety. The validation criteria were the same used for validation of each variety.
RESULTS AND DISCUSSION
It can be seen in Table 1, that the collected leaves displayed considerable variability in length (L), width (W), the product of length and width (L.W), and observed leaf area, as measured by the coefficient of variation (CV) and range. The largest value for CV, of 38.50%, was seen for L.W in the Vitória variety. High values for range and coefficient of variation are important in studies such as this, which seek to represent leaf area by statistical models involving regression. Levineet al.
(2012) explain that when using regression models for estimation, the values for the independent variable it is wanted to estimate, should not extrapolate the values used in constructing the regression model.
The variety Emcapa 8111 (Precoce) presented larger leaves than the other varieties, while the varieties Emcapa 8141 (Robustão capixaba) and Incaper 8142 (Conilon Vitória) have the smallest linear dimensions. In descending order of linear dimension of the leaf blade, the clonal varieties under study can be sorted as follows: Emcapa 8111 (Precoce) > Emcapa 8121 (Intermediário) ~ Emcapa 8131 (Tardio) > Emcapa 8141 (Robustão capixaba) ~ Incaper 8142 (Conilon Vitória). These discrepancies occurred becauseCoffea canephora is
a cross-fertilised species due to having a series of genetic factors S, which are associated with
self-incompatibility (CONAGIN; MENDES, 1961). As a result of this variation in leaf morphology in C. canephora (FONSECAet al., 2006), differences may
also arise in the allometric model for leaf dimension among varieties of the species.
Evaluating these measurements, it can be seen that the best fit was for the measurement of L.W in all the clonal varieties under study, ensuring correlation coefficients with values from 0.9619 to 0.9857 (Table 2). In studies of leaf area with Conilon coffee, Antunes et al. (2008) also found a better fit for L.W;
the same did not occur with Partelliet al. (2006), who
PRADO, 2005; BARROS et al., 1973; CALDAS
PINTO et al., 2007; CARGNELUTTI FILHO et al.,
2012b; PEKSEN, 2007; SEDAR; DEMIRSOY, 2006; TSIALTAS; KOUNDOURAS; ZIOZIOU, 2008). In other works however, the best results involved the greatest width of the leaf blade (CARGNELUTTI FILHO et al., 2012a; QUEIROGAet al., 2003) or the
longest length along the main rib (POSSEet al., 2009).
In selecting a model, the most suitable were the linear and power models that relate L to W, since they have high values for the coefficient of determination and the statistic ˆ1 different to zero (Tabela 2). It can also be noted that some quadratic equations have a ˆ2 coefficient which is not significant at 5% probability. Therefore, although the quadratic model displays greater coefficients of determination, generally higher
than the other models under study for each cultivar, it should not be used for estimating the leaf area in clonal varieties of Coffea canephora, since fitting a
polynomial model should be based on the significance of the coefficients, and not the coefficient of determination (STORCKet al., 2006).
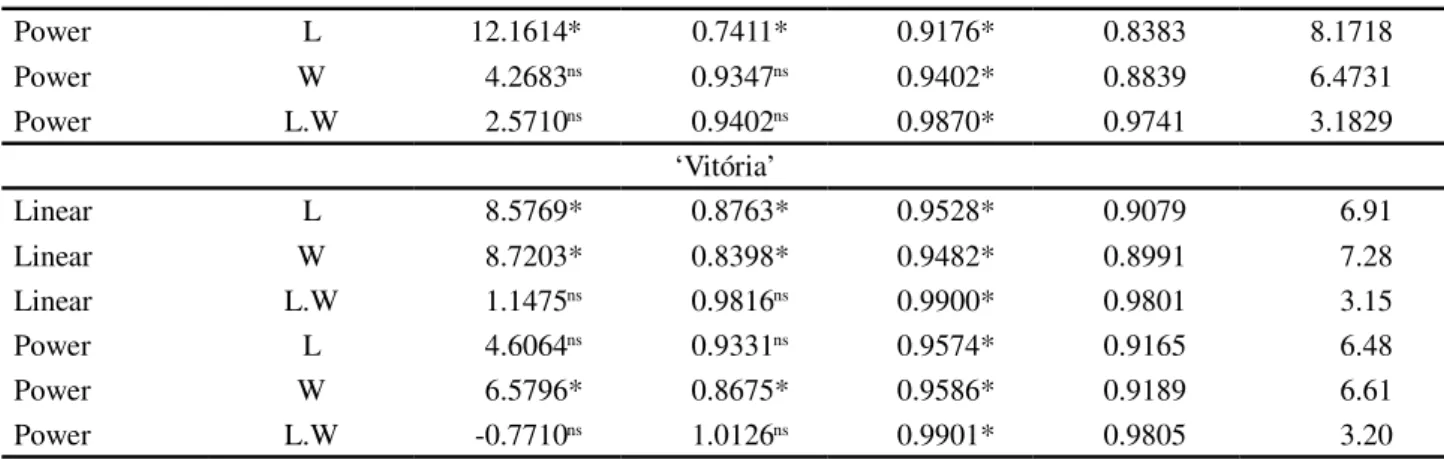
Based on the indicators used for validation of the equations, the most suitable estimated models were the linear and power models, which used L.W as an independent variable, as these presented in the validation a linear coefficient not different to zero, linear correlation coefficients statistically equal to one, a Pearson correlation coefficient statistically different to zero, a coefficient of determination closest to one, and the lowest value for the mean square error (Table 3).
Minimum Maximum Range Mean Median CV (%)
‘Precoce’
L 10.40 23.20 12.80 16.13 16.00 17.07
W 3.50 10.30 6.80 6.63 6.65 19.81
L.W 36.40 234.84 198.44 109.58 106.27 34.59
OLA 25.53 178.00 152.47 76.14 73.83 35.42
‘Intermediário’
L 10.00 20.90 10.90 15.52 15.10 14.90
W 3.90 8.90 5.00 6.20 6.20 18.21
L.W 46.80 186.01 139.21 97.96 94.44 30.96
OLA 32.29 129.76 97.47 67.82 64.42 30.37
‘Tardio’
L 10.20 23.00 12.80 15.25 15.00 16.97
W 4.10 8.50 4.40 6.29 6.10 15.38
L.W 50.43 193.20 142.77 97.43 92.18 29.24
OLA 34.13 125.17 91.04 67.72 62.72 28.86
‘Robustão capixaba’
L 9.60 19.30 9.70 14.70 14.70 14.24
W 4.30 10.10 5.80 6.12 6.10 17.23
L.W 41.28 188.87 147.59 91.56 89.67 29.20
OLA 26.89 118.52 91.63 57.70 55.91 29.62
‘Vitória’
L 8.60 23.50 14.90 14.12 13.65 18.91
W 3.40 9.30 5.90 5.75 5.60 19.58
L.W 29.24 218.55 189.31 83.67 77.19 38.50
OLA 17.70 140.6 122.90 59.90 55.70 37.17
Table 2 - Equations for determining leaf area ( i),using length (L), width (W) and the product of length and width (L.W) as independent variables (xi), and coefficient of determination (R2), based on 50 leaves from five clonal cultivars ofCoffea
canephora Pierreex Froehner
Model xi Equation R2
‘Precoce’
Linear: i=0+ 1xiH0 1=0VSH1 1 0
L i=-65.5949+8.7894**xi 0.8051
W i=-50.0582+19.0452**xi 0.8590
L.W i=-0.4287+0.6986**xi 0.9646
Quadratic: i= 0+ 1x+ 2x2
i H0 2=0VSH1 2 0
L i=27.9261-2.8166xi+0.3499**x2
i 0.8208
W i=26.9430-5.0418xi+1.8110**x2
i 0.8845
L.W i=6.4881+0.5729xi+0.0005*x2
i 0.9662
Power: i= 0x 1
i H0 1=0VSH1 1 0
L i=0.3890xi1.8851** 0.7998
W i=3.3122xi1.6427** 0.8908
L.W i=0.7091xi0.9951** 0.9619
‘Intermediário’
Linear: i= 0+ 1xiH0 1=0VSH1 1 0
L i=-53.3395+7.8059**xi 0.7684
W i=-38.6435+17.1821**xi 0.8858
L.W i=1.7571+0.6742**xi 0.9857
Quadratic: i= 0+ 1x+ 2x2
i H0 2=0VSH1 2 0
L i=61.3378-6.9830xi+0.4665**x2
i 0.7888
W i=20.3482-2.0515xi+1.5177**x2
i 0.8976
L.W i=0.9447+0.6907xi-0.0001nsx2
i 0.9857
Power: i= 0x 1
i H0 1=0VSH1 1 0
L i=0.5645xi1.7369** 0.7475
W i=3.9895xi1.5429** 0.8942
L.W i=0.7752xi0.9754** 0.9851
‘Tardio’
Linear: i= 0+ 1xiH0 1=0VSH1 1 0
L i=-33.8232+6.6342**xi 0.7802
W i=-44.2520+17.7366**xi 0.7804
L.W i=1.7745+0.6728**xi 0.9746
Quadratic: i= 0+ 1x+ 2x2
i H0 2=0VSH1 2 0
L i=14.3474+4.1143xi+0.0792nsx2
i 0.7816
W i=12.3817-0.5070xi+1.4353nsx2
i 0.7875
L.W i=-1.0866+0.7309xi-0.0003nsx2
i 0.9746
Power: i= 0x 1
i H0 1=0VSHa 1 0
L i=1.1145xi1.4981** 0.7705
W i=3.2206xi1.6415** 0.7967
L.W i=0.7749xi0.9749** 0.9746
‘Robustão capixaba’
Linear: i= 0+ 1xiH0 1=0VSH1 1 0
L i=-49.1127+7.2643**xi 0.7918
W i=-35.7804+19.2873**xi 0.8881
L.W i=0.0400+0.6997**xi 0.9705
Quadratic: i= 0+ 1x+ 2x2
i H0 2=0VSH1 2 0
L i=10.2167-1.0487xi+0.2852*x2
i 0.8003
W i=-42.6462+17.4795xi-0.1699nsx2
i 0.8884
L.W i=1.0437+0.6077xi-0.0001nsx2
i 0.9705
Power: i= 0x 1
i H0 1=0VSH1 1 0
L i=0.3858xi1.8538** 0.8289
W i=2.7651xi1.6669** 0.8877
‘Vitória’
Linear: i= 0+ 1xiH0 1=0VSH1 1 0
L i=-49.4186+7.7428**xi 0.8617
W i=-48.+18.8299**xi 0.9073
L.W i=3.0298+0.6796**xi 0.9670
Quadratic: i= 0+ 1x+ 2x2
i H0 2=0VSH1 2 0
L i=-13.3481+2.7929xi+0.1638*x2
i 0.8685
W i=3.5869+1.2365xi+1.4330**x2
i 0.9194
L.W i=-4.0887+0.8357xi-0.0008**x2
i 0.9702
Power: i= 0x 1
i H0 1=0VSH1 1 0
L i=0.4896xi1.8030** 0.8652
W i=2.5718xi1.7816** 0.8978
L.W i=0.7709xi0.9833** 0.9675
Continued Table 2
*,** Significant by t-test at 5% and 1% probability respectively.ns Not-significant
Table 3 - Independent variables (xi) linear coefficient ( 0), slope ( 1), Pearson linear correlation coefficient (r) and coefficient of determination (R2), obtained in the adjusted regression between estimated leaf area (dependent variable) and observed leaf area
(independent variable); root mean square error (RMSE), calculated based on estimated and observed leaf area, in 50 leaves from five clonal cultivars ofCoffea canephora Pierreex Froehner
Model xi 0(1)
1(2) r
(3) R2 RMSE
‘Precoce’
Linear L 10.0533* 0.8865* 0.9351* 0.8744 9.4900
Linear W 10.2008* 0.8385* 0.9383* 0.8804 9.8071
Linear L.W -1.3435ns 1.0135ns 0.9954* 0.9908 2.6293
Power L 7.0367ns 0.9144ns 0.9415* 0.8864 9.0292
Power W 10.9201* 0.8254* 0.9439* 0.8910 9.6410
Power L.W -0.5150ns 0.9999ns 0.9954* 0.9908 2.6153
‘Intermediário’
Linear L 20.6691* 0.7488* 0.9103* 0.8285 10.4440
Linear W 6.1718* 0.8666* 0.9655* 0.9321 7.3320
Linear L.W 1.7666ns 0.9811ns 0.9948* 0.9897 2.4769
Power L 20.6757* 0.7371* 0.9235* 0.8528 9.8126
Power W 7.0470* 0.8520* 0.9674* 0.9358 7.3899
Power L.W 1.7506ns 0.9804ns 0.9948* 0.9896 2.4786
‘Tardio’
Linear L 14.5269* 0.8018* 0.9092* 0.8267 9.2986
Linear W 12.5463* 0.7729* 0.9243* 0.8544 9.6999
Linear L.W 0.4921ns 0.9863ns 0.9864* 0.9731 3.7068
Power L 13.7859* 0.7495* 0.9252* 0.8560 9.3772
Power W 13.7859* 0.7495* 0.9252* 0.8560 10.0222
Power L.W 0.4226ns 0.9856ns 0.9866* 0.9734 3.7014
‘Robustão capixaba’
Linear L 10.6893* 0.7723* 0.9119* 0.8315 8.0786
Linear W 18.3060* 1.1178* 0.9482* 0.8991 10.0387
(1) * Linear coefficient different to zero by t-test at 5% probability.ns Not-significant;(2) * Slope different to one by t-test at 5% probability.ns
Not-significant;(3) * Correlation coefficient different to zero by t-test at 5% probability.ns Not-significant
Power L 12.1614* 0.7411* 0.9176* 0.8383 8.1718
Power W 4.2683ns 0.9347ns 0.9402* 0.8839 6.4731
Power L.W 2.5710ns 0.9402ns 0.9870* 0.9741 3.1829
‘Vitória’
Linear L 8.5769* 0.8763* 0.9528* 0.9079 6.91
Linear W 8.7203* 0.8398* 0.9482* 0.8991 7.28
Linear L.W 1.1475ns 0.9816ns 0.9900* 0.9801 3.15
Power L 4.6064ns 0.9331ns 0.9574* 0.9165 6.48
Power W 6.5796* 0.8675* 0.9586* 0.9189 6.61
Power L.W -0.7710ns 1.0126ns 0.9901* 0.9805 3.20
Continued Table 3
x Equation R2 Linear: i= 0+ 1xiH0 1=0VSHa 1 0
L.W i=0.6723+0.6779**xi 0.9592
Power: i= 0x 1
i H0 1=0VSHa 1 0
L.W i=0.7405xi0.9825** 0.9559
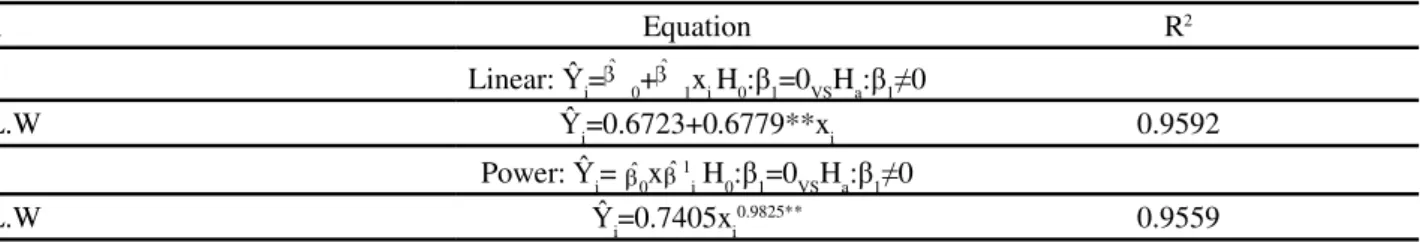
Table 4 - Equations for determining leaf area ( i), using the product of the length and width (L.W) as the independent variable (x) and
coefficient of determination (R2), based on 250 leaves from five clonal varieties ofCoffea canephora Pierreex Froehner
** Significant by t-test at 1% probability
The equations for the linear model adjusted for L.W, displayed linear coefficients and also slopes for the different clonal varieties that were very close. The same occurred with the equations for the power model (Table 2). The possibility was therefore studied of adjusting those linear and power models that would represent all five clonal varieties under study. In this way, the confidence interval was determined for the coefficients of the equations, as shown in Figure 1. It can be seen that the true values of the coefficients are contained in the intervals, demonstrating the similarity in behaviour of the clonal varieties. It was thus decided to adjust the linear and power models irrespective of cultivar (Table 4). Both models showed a good fit, with high coefficients of determination.
Figure 2 illustrates validation of the linear and power models. From the criteria adopted, it can be seen that the best fit was to the linear model, with a root mean square error (RMSE) slightly lower than the power model. Under the different conditions being studied, the
dispersion diagrams between the observed leaf area and that estimated by the linear and power models clearly show that a statistical model of simple linear structure can be used to estimate the leaf area in clonal varieties ofC. canephora.
In this study, the regression equation that best represented an estimation of the leaf area for C. canephora was the linear model i=0.6723+0.6779xi,
where xi is the product of the longest length along the main rib and the greatest width of the leaf blade (L.W). Establishing this relationship involved destructive analysis of the leaves. It should be noted that the removal or destruction of the leaves is necessary only to determine allometric relationships. Once this mathematical expression has been established, the leaf area of clonal varieties ofC. canephora in other studies
can be estimated without detaching the leaves, using only a ruler or a pocket tape measure to get the longest length and greatest width of the leaf blade. Antuneset al.
(2008), when studying the Conilon 513 and CC 3580
Figure 2 - Linear relationship between the estimated and observed (validation) values for leaf area inCoffea canephora Pierreex
Froehner, from 250 leaves from five clonal varieties. A = linear model; B = power model (H0: 0=0vs 0 0;H0 1=1vs 1 1; R2 =
varieties ofCoffea canephora, found a power model to
be the best fit. However, it should be remembered that adjustment of the equation had been made with the concurrent use of four leaves from cultivars ofCoffea arabica.
CONCLUSION
Determination of leaf area in the clonal varieties of Coffea canephora, Precoce, Intermediário, Tardio,
Robustão capixaba and Vitória, is best represented by a simple linear model, with the equation =0.6723+0.6779x, where x represents the product of the longest length and the greatest width of the leaf blade.
ACKNOWLEDGEMENT
The authors wish to thank CNPq and CAPES for their financial support through research grants.
REFERENCES
AMARAL, J. A. T. do.et al. Métodos de análise quantitativa
do crescimento de plantas. In: FERREIRAet al. (Ed.).Tópicos especiais em produção vegetal I. Alegre, ES: EDUFES, 2009. p. 259-276.
ANTUNES, W. C. et al. Allometric models for
non-destructive leaf area estimation in coffee (Coffea arabica
andCoffea canephora).Annals of Applied Biology, v. 153, p. 33-40, 2008.
AQUINO, L. A.et al. Estimativa da área foliar do girassol por
método não destrutivo Bragantia, v. 70, n. 4, p. 832-836, 2011. ARAÚJO, E. C. E.; SANTOS, E. P. dos; PRADO, C. H. B. de A. Estimativa da área foliar da mangueira (Mangifera indicaL.)cvs.
Tommy Atkins e Haden, utilizando dimensões lineares.Revista Brasileira de Fruticultura, v. 27, n. 2, p. 308-309, 2005. AWATRAMANI, N. A., GOPALAKRISHNA H. K. Measurement of leaf area in coffee: I Coffea arabica.Indian Coffee, v.29, n.1, p. 25-30, 1965.
BARROS, R. S.et al. Determinação da área de folhas de café
(Coffea arabica L. cv. Bourbon Amarelo).Revista Ceres, v. 20, n. 107, p. 44-52, 1973.
BENINCASA, M. M. P.Análise de crescimento de plantas: noções básicas. 2. ed. Jaboticabal: Funep, 2003. 41 p. CALDAS PINTO, M. S. et al. Modelo para estimativa da
área foliar em maniçoba.Revista Ciência Agronômica, v. 38,
n. 4, p. 391-395, 2007.
CARGNELUTTI FILHO, A. et al. Estimação da área foliar
de mucuna cinza por meio de método não destrutivo.Ciência Rural, v. 42, n. 2, p. 238-242, 2012 a.
CARGNELUTTI FILHO, A. et al. Estimativa da área foliar de nabo forrageiro em função de dimensões lineares.
Bragantia, v. 71, n. 1, p. 47-51, 2012 b.
CONAGIN, C. H. T. M.; MENDES, A. J. T. Pesquisas citológicas e genéticas em três espécies de Coffea:
auto-incompatibilidade emCoffea canephora Pierre ex Froehner.
Bragantia, v. 20, n. 34, p. 787-804, 1961.
CRUZ, C. D. GENES: a software package for analysis in experimental statistics and quantitative genetics. Acta Scientiarum. Agronomy. v. 35, n. 3, p. 271-276, 2013.
FERRÃO, R. G.et al. Cultivares de café conilon. In: FERRÃO et al.Café conilon. Vitória: Incaper, 2007, p. 203-226. FERREIRA, M. C. et al. Determinação de área foliar e
retenção de líquido por folhas de café em pulverização a alto volume.Nucleus, v.7, n.1, p. 277-283, abr. 2010.
FONSECA, A. F. A. daet al. Divergência genética em café conilon.
Pesquisa Agropecuária Brasileira, v. 41, n. 4, p. 599-605, 2006.
KANDIANNAN, K.et al. Modeling individual leaf area of
ginger (Zingiber officinale Roscoe) using leaf length and
width.Scientia Horticulturae, v. 120, p. 532–537, 2009. LEVINE, D. M.et al.Estatística: teoria e aplicações usando Microsoft Excel em português. 6. ed. Rio de Janeiro: LTC Editora, 2012. 832 p.
PARTELLI, F. L.et al. Estimativa da área foliar do cafeeiro
conilon a partir do comprimento da folha.Revista Ceres, v. 53,
n. 306, p. 204-210, 2006.
PEKSEN, E. Non-destructive leaf area estimation model for faba bean (Vicia faba L.).Scientia Horticulturae, v. 113, n. 4,
p. 322-328, 2007.
POSSE, R. P. et al. Total leaf area of papaya trees
estimated by a nondestructive method.Scientia Agricola, v. 66, n. 4, p. 462-466, 2009.
QUEIROGA, J. L.et al. Estimativa da área foliar de feijão vagem
(Phaseolus vulgaris L.) por meio da largura máxima do folíolo central.Horticultura Brasileira, v. 21, n. 1, p. 64-68, 2003.
SCHMILDT, E. R. et al. Análise comparativa de equações
para estimativa da área foliar em cafeeiros.Coffee Science, v. 9, n. 2, p. 152-164, 2014.
SEDAR, Ü; DEMIRSOY, H. Non-destructive leaf area estimation in chestnut.Science Horticulturae, v. 108, n.2, p. 227-230, 2006. SEZER, I.; ONER, F.; MUT, Z. Non-destructive leaf area measurement in maize (Zea mays L.). Journal of Environmental Biology, v. 30, n. 5, p. 785-790, 2009.
SILVA, A. R.; LEITE, M. T.; FERREIRA, M. C. Estimativa da área foliar e capacidade de retenção de calda fitossanitária em cafeeiro.Bioscience Journal, v. 24, n. 3, p. 66-73, 2008.
STORCK, L. et al. Experimentação vegetal. 2. ed. Santa Maria: UFSM, 2006. 198 p.