Non-destructive linear model for leaf area estimation
in
Vernonia ferruginea
Less
Souza, MC.
a,b*
and Amaral, CL.
caPrograma de Pós-graduação em Ciências Biológicas (Biologia Vegetal), Departamento de Botânica,
Instituto de Biociências, Universidade Estadual Paulista – UNESP, Avenida 24 A, 1515, Bairro Bela Vista, CEP 13506-900, Rio Claro, SP, Brazil
bDepartamaneto de Ciências Farmacêuticas, Faculdade de Ciências Farmacêuticas de Ribeirão Preto, Universidade de
São Paulo – USP, Avenida do Café, s/n, Bairro Monte Alegre, CEP 14040-903, Ribeirão Preto, SP, Brazil
cPrograma de Pós-graduação em Agronomia (Produção Vegetal), Faculdade de Ciências Agrárias e Veterinárias,
Universidade Estadual Paulista – UNESP, Via de Acesso Prof. Paulo Donato Castellane, s/n, CEP 14884-900, Jaboticabal, SP, Brazil
*e-mail: [email protected] Received: June 11, 2013 – Accepted: October 10, 2013
(With 4 figures)
Abstract
Leaf area estimation is an important biometrical trait for evaluating leaf development and plant growth in field and pot experiments. We developed a non-destructive model to estimate the leaf area (LA) of Vernonia ferruginea using the length (L) and width (W) leaf dimensions. Different combinations of linear equations were obtained from L, L2,
W, W2, LW and L2W2. The linear regressions using the product of LW dimensions were more efficient to estimate
the LA of V. ferruginea than models based on a single dimension (L, W, L2 or W2). Therefore, the linear regression
“LA=0.463+0.676WL” provided the most accurate estimate of V. ferruginea leaf area. Validation of the selected model showed that the correlation between real measured leaf area and estimated leaf area was very high.
Keywords: Asteraceae, cerrado, savanna, statistical model, validation.
Modelo linear não-destrutivo para estimativa de área
foliar de
Vernonia ferruginea
Less
Resumo
A estimativa de área foliar é um importante traço biométrico para avaliação do desenvolvimento foliar e do crescimento vegetal em experimentos de campo e casa-de-vegetação. Foi desenvolvido um modelo linear não destrutivo capaz de estimar a área foliar (AF) de Vernonia ferruginea usando o comprimento (C) e a largura (L) foliar. Diferentes combinações de equações lineares foram obtidas a partir de C, C2, L, L2, CL e C2L2. As regressões lineares usando o
produto de dimensões CL foram mais eficientes para estimar a AF de V. ferruginea do que os modelos baseados em uma única dimensão (C, L, C2 ou L2). O modelo linear “AF = 0,463+0,676 CL” forneceu com maior precisão a AF de
V. ferruginea em relação aos demais modelos testados. A validação do modelo selecionado revelou elevada correlação entre a área foliar real e a área foliar estimada pelo modelo.
Palavras-chave: Asteraceae, cerrado, modelos estatísticos, savana, validação.
1. Introduction
The leaf area measurement is one of the most common parameters evaluated in green house and field ecophysiological studies (Wang and Zhang, 2012) on Brazilian savanna (locally know as “cerrado”) woody species, crops and weeds. Therefore, the accurate measurements of leaf area (LA) in field experiments may be time-consuming and generally requires the use of expensive equipment (e.g. portable leaf area meters). Such destructive methods require the excision of the leaves, thus removing the possibility of
the excision of the leaves can interfere with the results of other experiments that are sharing the same group of plants.
The use of non-destructive models to estimate the leaf area has been used to understand the ecophysiology of crops (e.g., Crocus sativus L. (Kumar, 2009), Juglans nigra L. (Zellers et al., 2012), terrestrial weeds (e.g. Merremia cissoides Lam. (Carvalho et al., 2011a) and aquatics (e.g. Pistia stratiotes L. (Carvalho et al., 2011b)), and more recently cerrado species (e.g. Styrax ferrugineus Nees & Mart and Styrax pholii A. DC. (Souza and Habermann, 2014)). Linear models based on length and width leaf measurements have been considered the most simple and efficient models to estimate the leaf area of some species (Demirsoy and Lang, 2010, Giuffrida et al., 2011, Wang and Zhang, 2012). However, models to estimate the leaf area of the cerrado species are almost absent. So, non-destructive models to estimate LA are not only required by agronomists, but also biologists and ecologists.
Vernonia ferruginea (Asteraceae) is a native species from Brazilian’s cerrado with a good distribution by the cerrado remains. This species is often found as an invasive species of wastelands, pastures and shoulders of highways in São Paulo state, Brazil. The aim of this study was to develop and validate an efficient and non-destructive model to estimate the leaf area of V. ferruginea using leaf length and width dimensions.
2. Material and Methods
2.1. Studied siteThis study was carried out in a field within Jaboticabal municipality, São Paulo state, Brazil (21°14’19’’S, 48°16’09’’W). The climate in this region may be classified as CWA with a wet season from October to March and a dry season from April to September. The mean annual temperature is approximately 23 °C and the total annual rainfall is approximately 1411 mm.
2.2. Plant samples and leaf measurements
We sampled a total of 200 well-developed leaves of 10 adult V. ferruginea plants in the beginning of March 2013. Immediately after cutting, leaves were carefully placed in plastic bags and transported to the laboratory. They were individually scanned at 300 dpi, using a HP Photosmart C3100 series scanner coupled to a microcomputer. Leaf area (LA), length (L) and width (W) of each leaf were determined using the software ImageJ (Rasband, 2013), where L is the maximum length along the midrib and W is the maximum value perpendicular to the midrib (Figure 1). The LA is expressed in cm2 while L and W
are expressed in cm.
2.3. Model building
We used the 200 leaf measurements described above, testing the relation between LA and L and/or W (Table 1). Leaf area (LA) was considered to be the dependent variable, while the independent variables were L, L2, W, W2, the
product of LW and L2W2. We tested the internal validity
of the models using the coefficient of determination (R2),
mean square error (MSE), error sum of squares (SSE) and predicted residual error sum of squares (PRESS) as described in Ghoreishi et al. (2012). Residuals were also analyzed to determine the presence of outliers and non-constant error variance (Rouphael et al., 2010). The best model was selected according to the combination of the higher R2 and the lowest MSE, SSE and PRESS
(Table 1, Figure 2).
When L and W were involved in the same model, we tested the co-linearity between them calculating the variance inflation factor (VIF) (Marquardt, 1970) and the tolerance value (T) (Gill, 1986). If the VIF value was higher than
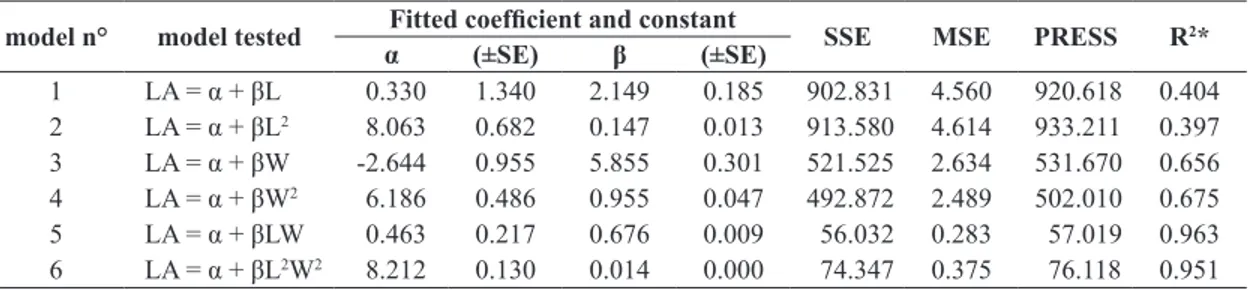
Table 1. Fitted coefficient and constant values of the models used to determine the leaf area of Vernonia ferruginea.
Coefficient of determination (R2), error sum of squares (SSE), mean square errors (MSE) and predicted residual error sum
of squares (PRESS).
model n° model tested Fitted coefficient and constant SSE MSE PRESS R2*
α (±SE) β (±SE)
1 LA = α + βL 0.330 1.340 2.149 0.185 902.831 4.560 920.618 0.404
2 LA = α + βL2 8.063 0.682 0.147 0.013 913.580 4.614 933.211 0.397
3 LA = α + βW -2.644 0.955 5.855 0.301 521.525 2.634 531.670 0.656
4 LA = α + βW2 6.186 0.486 0.955 0.047 492.872 2.489 502.010 0.675
5 LA = α + βLW 0.463 0.217 0.676 0.009 56.032 0.283 57.019 0.963
6 LA = α + βL2W2 8.212 0.130 0.014 0.000 74.347 0.375 76.118 0.951
Standard errors in parenthesis. L - length (cm), W - width (cm), LA - leaf area (cm2), * p<0.0001, n=200.
10 or if the T value was smaller than 0.10, the co-linearity may interfere with the final result, making necessary the exclusion of one of the variables from the model.
2.4. Model validation
To further validate the developed model, 185 extra leaves of V. ferruginea were sampled from the same site on the same year and season, but from different plants. The LA, L and W were measured according to the procedures previously described. The predicted leaf area (PLA) of each leaf was determined according to the parameters obtained from the selected model. We performed a linear regression using the PLA and the observed leaf area (OLA = LA measured with ImageJ) (Figure 3). The correlation between OLA and PLA was tested using a Spearman-Rank test (Souza and Habermann, 2014). The relative bias was estimated by the mean of differences (d) and the standard deviation of the differences (SD) (Figure 4). The distribution is considered normal if at least 97% of the differences in a population lie between the limits of agreement (Rouphael et al., 2010). Linear regressions between LA, L and W were performed using R 2.15.1 (R Core Team, 2012). The MSE and SSE were determined using the R package systemfit while the PRESS was determined using the R package asbio.
3. Results
The LA of V. ferruginea ranged from 6.73 to 22.97 cm2
(average = 14.43 cm2), the L ranged from 4.49 to 9.52 cm
(average = 6.93 cm) and the W ranged from 1.95 to 4.04 cm (average = 2.99 cm). The VIF was smaller than 10 (1.01) and T was higher than 0.1 (0.99), showing that the co-linearity between W and L may be considered negligible, and both variables may be included in the models n° 5 and 6.
All models were statistically significant (p<0.001). The regression analysis suggested that LA was strongly
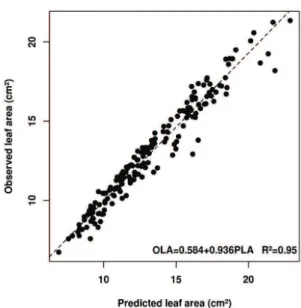
Figure 3. Validation of the model PLA = 0.463 + 0.676LW for estimating the leaf area of Vernonia ferruginea correlating observed leaf area (OLA) vs. predicted leaf area (PLA).
Figure 4. Difference between observed leaf area (OLA) and predicted leaf area (PLA) estimated by PLA = 0.463 + 0.676LW versus the OLA of Vernonia ferruginea (validation experiment). The solid line is the mean of the differences; the dotted lines are the limits of agreement, calculated as d ± 3SD. Where d is the mean of the differences and SD is the standard deviation of the differences.
Figure 2. Plot of the selected model for estimating the leaf area of Vernonia ferruginea.
correlated with LW and L2W2 but not so strongly correlated
with L, L2, W and W2 (Table 1). The model n°5 presented
the highest R2 and lowest SSE, MSE and PRESS in relation
To validate the selected model, we predicted the leaf area of 185 leaves of V. ferruginea using the model n° 5. The correlation between OLA and PLA was significant (rs=0.999) by Spearman-Rank test. We also observed significant correlation after applying a new linear correlation between OLA and PLA (R2=0.95, p<0.001)
(Figure 3). Considering that sometimes the correlation is an insufficient analysis to explain relationship between OLA and PLA, we plotted the differences between PLA and OLA against OLA (Figure 4). In the current study we observed that the differences between PLA and OLA were normally distributed and 98.4% of the plots lay between d ± 3SD (Figure 4).
4. Discussion
Regression analysis suggested significant correlations (p<0.001) between LA and L, L2, W, W2, LW and L2W2.
These correlations seem universal since they were previously observed in many models to estimate LA of crops (for references see Rouphael et al. 2010), bedding plants (Giuffrida et al., 2011) and woody species (Ghoreishi et al., 2012) among others). These significant relations were most evident between LA vs. LW and LA vs. L2W2, and
in both cases, we observed coefficients of determination (R2) higher than 0.95 (Table 1). The model based on the
relationship between LA vs. LW (model n° 5) was selected not only based on the higher R2 but also because it presented
smaller SSE, MSE and PRESS than the model between LA vs. L2W2. This criterion was used in accordance with
Rouphael et al. (2010) and Giuffrida et al. (2011). In this study, we clearly observed that models with a single measurement of L, L2, W and W2 were less acceptable
for estimating the LA of V. ferruginea, presenting R2 around
0.40 for the models using L and L2, and 0.66 for models
using W and W2. Souza and Habermann (2014) observed
a similar pattern when estimating the leaf area of Styrax ferrugineus (savanna species) and S. pohlii (riparian forest species). In fact, the differences observed for S. pohlii among the models using a single measurement (L or W) were not so discrepant as observed by V. ferruginea, producing the lowest R2 (0.82) observed for the model correlating LA
and W2. However, as observed in this paper, the lowest R2
(0.58) found among the models used to estimate the LA of S. ferrugineus was observed in the models that correlated LA and L, and LA and L2.
As observed by Rouphael et al., (2010), the shape coefficient of the selected model (model n°5, β = 0.68) can be described by a shape between an ellipse (0.78) and a triangle (0.50) of the same length and maximum width. Our shape coefficient (0.68) showed similarity to those calculated for native species and crops. Values of 0.68 have been reported by S. pohlii, 0.70 for S. ferrugineus (Souza and Habermann, 2014), 0.72 for Rosa hybrida L. (Rouphael et al., 2010), 0.68 for Helianthus annuus L. (Rouphael et al., 2007), 0.69 for Diospyros kaki L. (Cristofori et al., 2008) and 0.73 for Salvia sclarea L. (Kumar and Sharma, 2010).
5. Conclusion
A simple and efficient model (LA=0.463+0.676LW) was developed, and validated, to estimate the LA of Vernonia ferruginea. Considering that leaf length and width can be easily measured with a ruler, this model is an important tool for ecophysiological studies of V. ferruginea in the field or greenhouse experiments. The use of this model would enable researches to do non-destructive measurements and repeat measurements in the same leaf, excluding the use of expensive electronic equipment such as leaf area meters.
Acknowledgements
The authors acknowledge the Fundação de Amparo à Pesquisa no Estado de São Paulo (FAPESP) and Coordenação de Aperfeiçoamento de Pessoal de Nível Superior (CAPES) for the PhD scholarships of MCS (Proc. FAPESP #2010/07809-1) and CLA. We are also grateful to Nara O. Vogado and to Katharine Carroll for the English review.
References
CARVALHO, LB., BIANCO, S., GALATI, VC. and PANOSSO, AR., 2011a. Determination of Merremia cissoides leaf area based on linear measurements of the leaflets. Acta Scientiarum. Agronomy, vol. 33, p. 473-476.
CARVALHO, L.B., SOUZA, M.C., BIANCO, M.S., and BIANCO, S., 2011b. Estimativa de área foliar de palntas daninhas de ambiante aquático: Pistia stratiotes. Planta Daninha, v. 29, no. 1, p. 65-68. http://dx.doi.org/10.1590/S0100-83582011000100008. CHABOT, BF. and HICKS, DJ., 1982. The ecology of leaf life spans. Annual Review of Ecology and Systematics, vol. 13, no. 1, p. 229-259. http://dx.doi.org/10.1146/annurev.es.13.110182.001305. CRISTOFORI, V., FALLOVO, C., MENDOZA-DE-GyVES, E., RIVERA, CM., BIGNAMI, C. and ROUPHAEL, y., 2008. Non-destructive, analogue model for leaf area estimation in persimmon (Diospyros kaki L.f.) based on leaf lenght and width measurement. European Journal of Horticultural Science, vol. 73, p. 216-221.
DEMIRSOy, H. and LANG, GA., 2010. Validation of a leaf area estimation model for sweet cherry. Spanish Journal of Agricultural Research, vol. 8, no. 3, p. 830-832. http://dx.doi.org/10.5424/ sjar/2010083-1285.
GILL, JL., 1986. Outliers, residuals, and influence in multiple regression. Journal of Animal Breeding and Genetics, vol. 103, no. 1-5, p. 161-175. http://dx.doi.org/10.1111/j.1439-0388.1986. tb00079.x.
GIUFFRIDA, F., ROUPHAEL, y., TOSCANO, S., SCUDERI, D., ROMANO, D., RIVERA, CM., COLLA, G. and LEONARDI, C., 2011. A simple model for nondestructive leaf area estimation in bedding plants. Photosynthetica, vol. 49, no. 3, p. 380-388. http://dx.doi.org/10.1007/s11099-011-0041-z.
sativus L.). Scientia Horticulturae, vol. 122, no. 1, p. 142-145. http://dx.doi.org/10.1016/j.scienta.2009.03.019.
KUMAR, R. and SHARMA, S., 2010. Allometric model for nondestructive leaf area estimation in clary sage (Salvia sclarea L.). Photosynthetica, vol. 48, no. 2, p. 313-316. http://dx.doi. org/10.1007/s11099-010-0039-y.
MARqUARDT, DW., 1970. Generalized inverse, ridge regression, biased linear estimation, and nonlinear estimation. Technometrics, vol. 12, no. 3, p. 591-612. http://dx.doi.org/10.2307/1267205. R CORE TEAM, 2012. R: A language and environment for statistical computing. Vienna, Austria: R Foundation for Statistical Computing. Available from: <http://www.R-project.org/>. Access in: 21 May2013.
RASBAND, WS., 2013. ImageJ. Bethesda, Maryland: US National Institutes of Health. Available from: <http://rsb.info.nih.gov/ij/ index.html>. Access in: 21 May 2013.
ROUPHAEL, y., COLLA, G., FANASCA, S. and KARAM, F., 2007. Leaf area estimation of sunflower leaves from simple linear
measurements. Photosynthetica, vol. 45, no. 2, p. 306-308. http:// dx.doi.org/10.1007/s11099-007-0051-z.
ROUPHAEL, y., MOUNEIMNE, AH., ISMAIL, A., MENDONZA-DE-GyVES, E., RIVERA, CM. and COLLA, G., 2010. Modeling individual leaf area of rose (Rosa hybrida L.) based on leaf length and width measurement. Photosynthetica, vol. 48, no. 1, p. 9-15. http://dx.doi.org/10.1007/s11099-010-0003-x.
SOUZA, MC. and HABERMANN, G., 2014. Non-destructive equations to estimate leaf area of Styrax pohlii and Styrax ferrugineus. Brazilian Journal of Biology, vol. 74, no. 1, p. 222-225. http://dx.doi.org/10.1590/1519-6984.17012.
WANG, Z. and ZHANG, L., 2012. Leaf shape alters the coefficients of leaf area estimation models for Saussurea stoliczkai in central Tibet. Photosynthetica, vol. 50, no. 3, p. 337-342. http://dx.doi. org/10.1007/s11099-012-0039-1.