ISSN 0100-2945 http://dx.doi.org/10.1590/0100-29452016802 Rev. Bras. Frutic., Jaboticabal - SP, v. 38, n. 4 : e-802
IRRIGATION DEPTHS AND YIELD RESPONSE FACTOR
IN THE PRODUCTIVE PHASE OF YELLOW MELON
1BENITO MOREIRA DE AZEVEDO2, GUILHERME VIEIRA DO BOMFIM2,
JOAQUIM RAIMUNDO DO NASCIMENTO NETO3, THALES VINÍCIUS DE ARAÚJO VIANA2,
DENISE VIEIRA VASCONCELOS2
ABSTRACT – Local knowledge about irrigation management in yellow melon can promote higher precision to water supply for irrigation purposes, increasing productivity and reducing production costs. The aim of this study was to evaluate the effects of different irrigation depths for yellow melon production and on yield response factor to water (Ky) in the productive phase. The experiment was carried out in Fortaleza, state of Ceará, Brazil, in complete randomized blocks with six treatments, four replicates and six plants per plot.
Treatments were applied from intermediate (III) to final (IV) physiological state with water depths equivalents
to 25%, 50%, 75%, 100%, 125% and 150% of the crop evapotranspiration (ETc). Ky was calculated according to FAO-33 report methodology in the range from 25% to 100% ETc. The variables analyzed were number of
fruits per plant, polar and equatorial diameters, fruit fresh weight, commercial yield, skin and pulp thickness, and soluble solids. Treatments influenced the number of fruits per plant, equatorial diameter, fruit fresh weight, commercial yield, and soluble solids. The best results were reached with commercial yield equal to
32.2 Mg ha-1, 1.46 fruits per plant, equatorial diameter equal to 16.3 cm, fruit fresh weight equal to 2.3 kg
and soluble solids equal to 12 ºBrix with 100.3% ETc in the productive phase. The crop was tolerant to water supply reduction on the productive phase (Ky < 1) through daily irrigation with controlled water deficit.
Index terms: Cucumis melo, evapotranspiration, drip irrigation.
PRODUÇÃO E FATOR DE RESPOSTA DO MELOEIRO AMARELO
A LÂMINAS DE IRRIGAÇÃO NA FASE PRODUTIVA
RESUMO – Informações locais sobre manejo hídrico em olerícolas podem oferecer maior precisão ao fornecimento de água pela irrigação, concorrendo para elevar a produtividade e reduzir os custos. Neste trabalho, foram avaliados os efeitos de distintos níveis de irrigação sobre a produção do melão-amarelo e
sobre o fator de resposta da cultura frente à irrigação deficitária (Ky). O experimento foi conduzido em Fortaleza, Ceará, utilizando o delineamento em blocos casualizados, com seis tratamentos, quatro repetições e parcelas de seis plantas. Os tratamentos foram diferenciados nas fases fenológicas intermediária (III) e final
(IV), com lâminas de água correspondentes a 25%, 50%, 75%, 100%, 125% e 150% da evapotranspiração da cultura (ETc). O Ky foi estimado pela metodologia do Boletim 33 da FAO, no intervalo de 25% a 100%
da ETc. Foram analisadas as variáveis número de frutos por planta, diâmetros polar e equatorial, massa
fresca do fruto, produtividade comercial, espessuras da casca e da polpa e sólidos solúveis. Os tratamentos
influenciaram significativamente sobre o número de frutos por planta, o diâmetro equatorial, a massa fresca
do fruto, a produtividade comercial e os sólidos solúveis. As irrigações com 100,3% da ETc na fase produtiva do meloeiro maximizaram a produtividade comercial, estimada em 32,2 Mg ha-1 e proporcionaram 1,46
fruto por planta com diâmetro equatorial de 16,3 cm, massa fresca de 2,3 kg e sólidos solúveis de 12 ºBrix.
A cultura mostrou-se tolerante à redução do suprimento de água na fase produtiva (Ky < 1) com a adoção,
da irrigação diária com déficit hídrico controlado.
Termos para indexação: Cucumis melo, evapotranspiração, gotejamento.
1(Paper 118-15). Received May 11, 2015. Accepted February 25, 2016.
2 Phd in Agricultural Engineering, from Federal University of Ceará, Agricultural Engineering Department, Fortaleza, Ceará, Brazil, Dom José Lourenço Street, Campus do Pici, Bloco 804, Mailbox: 12.168, Zip code: 60.450-760, E-mails: [email protected]; [email protected], [email protected]; [email protected]
INTRODUCTION
Yellow melon (Cucumis melo L.) is the main horticulture exported by the state of Ceará (CAMPELO et al., 2014). Regarding irrigation, water
depth quantification is a fundamental parameter,
since crop production can be impaired by water
deficit or excess. Water deficit reduces the number of
fruits (Mani, 2014), commercial productivity (PIRES et al., 2013), size, fresh weight (CAVALCANTI et al., 2015) and soluble solids (BAHADUR et al., 2011)
of fruits. Water excess reduces size, fresh weight
(CAVALCANTI et al., 2015) and soluble solids (SUASSUNA et al., 2011) of fruits, favors the loss of water and soil nutrients beyond the root zone (PIRES et al., 2013, FIGUEIRÊDO et al., 2014), increasing production costs.
In the melon cycle, the fruiting period, which
goes from fruit fixation to maturation, is the period
in which the highest water consumption occurs, and is therefore the most critical for irrigation. During this phase, problems related to irrigation
management or to difficult-to-control climatic factors
(excessive rains or prolonged droughts) may result in water stress and therefore may be decisive for crop production.
Experiments with water depths applied throughout the melon cycle (AL-MEFLEH et al., 2012; CAVALCANTI et al., 2015) or in part of it (SIMSEK; COMLEKCIOGLU, 2011) have shown distinct results. This divergence stems, among other factors, from irrigation management, the phenological phase of the crop and the edaphoclimatic variations of each region. This fact makes its generalization to
other regions difficult and ratifies the relevance of
local trials (PEREIRA FILHO et al., 2014; VALNIR JÚNIOR et al., 2013).
In northeastern Brazil, due to the fact that there are marked rainfall irregularities and scarcity of water resources, the irrigation strategy must take
into account possible deficient water supply to plants
at any stage of plant cycle. In this context, knowledge
of crop sensitivity to stress due to water deficiency
is fundamental to reduce impacts on production (MIORINI et al., 2011) and on irrigation costs (ALI et al., 2007). Experiments addressing this theme have shown positive results regarding melon tolerance to stress due to water scarcity (DOGAN et al., 2008; SHARMA et al., 2014).
The crop response factor (Ky) is the coefficient used to indicate plant sensitivity to water deficit at any stage of its cycle. For this reason, it is often used in irrigation management. Bulletins 33 (DOORENBOS; KASSAM, 1979)
and 66 (STEDUTO et al., 2012) of the United Nations Organization for Food and Agriculture do not have information on Ky for yellow melon. The few existing information (LEITE et al., 2014; SIMSEK; COMLEKCIOGLU, 2011), although
coinciding in the classification issue for indicating
low crop sensitivity to water scarcity, greatly differs in numerical terms. This difference may come from regional diversity and management as well as from the phases evaluated (each one or all of them). Silva et al. (2014) explain that the discrepancy between
Ky values in experiments is quite common in the
most diverse cultures and conditions, and Steduto et al. (2012) recommend their experimental estimation under local conditions.
Due to the scarcity of information on irrigation of yellow melon during the productive
period, intermediate (III) and final (IV) phenological
phases, this study aimed to evaluate the effects of irrigation on fruit production and on the response
factor (Ky) to controlled deficit irrigation under the
edaphoclimatic conditions of the coast of Ceará.
MATERIAL AND METHODS
The work was carried out between October 23, 2009 and December 28, 2009 in the experimental area of the Federal University of Ceará, Fortaleza,
Ceará (3º 44 ‘S, 38º 33’ W and 19.50 m asl). According to the Köppen classification, the climate of the region is Aw’ type, tropical rainy,
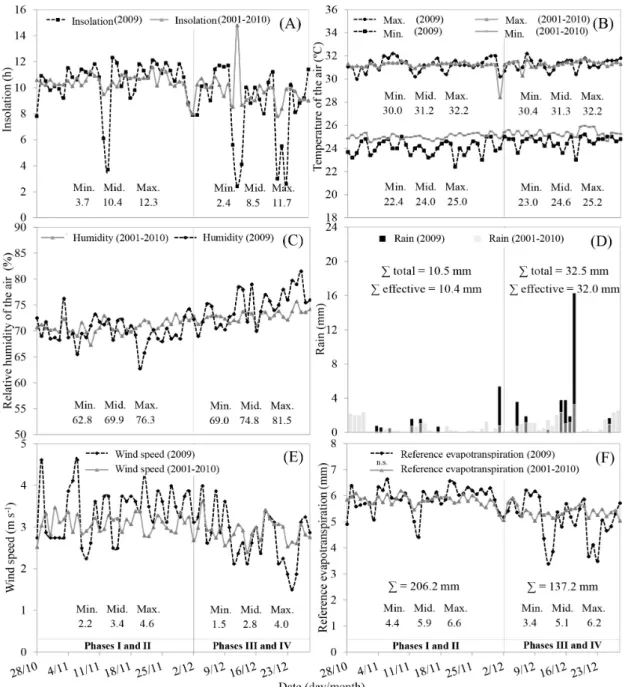
tropical savannah, with the driest period in the winter season and maximum rainfall in summer-fall. The data of the main agrometeorological variables during the experiment were representative of the region, since between the daily values of reference evapotranspiration estimated during the year 2009 and the estimated daily averages of a series of ten years, from 2001 to 2010, there was no difference
at 5% probability by the Student’s t-test (Figure 1).
The physicochemical characteristics of the Red-Yellow Argisol (SANTOS et al., 2006) in the
0.20 m layer were: fine sand (451 g kg-1); coarse
sand (364 g kg-1); silt (122 g kg-1); clay (63 g kg-1);
natural clay (63 g kg-1); specific weight (1.47 g cm -3);
moisture in the field capacity (3.64 g 100 g -1) and in
the wilting point (2.07 g 100 g -1); useful water (1.57
g, 100 g -1); flocculation (24 g 100 g-1); textural class
(sand); K + (92 mg dm-3); Na- (39 mg dm-3); Ca 2+
(1.7 cmolc dm-3); Mg 2+ (1.4 cmolc dm-3); Al 3 + (0.05
cmolc dm-3); PH
1: 0.25 (5.6); CE (0.49 dS m -1).
3 according to Allen et al. (2006), with daily data from an automated weather station near the experimental area. Kc, adopted by Miranda and Bleicher (2001), was 0.21 in phase I; from 0.21 to 1.21 in phase II (interpolated); 1.21 in phase III; and from 1.21 to 0.98 in phase IV (interpolated). Kr was estimated according to Keller and Karmeli (1974), with the coverage factor of 10% up to 21 days after sowing (DAS), from 10 to 100% (interpolated) up to 40 DAS and 100% up to 66 DAS.
The crude irrigation depth was calculated
by Equation 3, disregarding the need for leaching
(leaching ratio less than 0.1).
(3)
where:
LB is the crude irrigation depth (mm day-1);
RT the irrigation shift (1 day); and
EF is the water application efficiency (%).
EF of 85.5% was estimated with the product of
uniformity coefficients of Christiansen (estimated in
the experimental area at 0.95) and soil transmissivity (tabulated at 0.90) for arid climate, sandy texture soil and root depth less than 0.75 m, both determined by the methodology of Keller and Karmeli (1974).
The irrigation time was calculated by means
of Equation 4.
(4)
where:
Ti is the irrigation time (h); A is the area per plant (1 m2);
Qe is the emitter flow (1.3 L h-1); and
Nep is the number of emitters per plant (1).
The total water depth used to meet the water needs of yellow melon resulted from the sum of
effective precipitation and liquid irrigation depth,
since the crude irrigation depth only ensured its
adequate application.
The water supply in the initial (I = 22 days) and growth phenological phases (II = 18 days) was based on 100% ETc. On trays, from sowing to transplanting (23/10/2009 to 28/10/2009), seedlings were irrigated four times a day via hand sprayer
with 5 mm of water. In the field, from transplanting
to the end of the vegetative growth (28/10/2009 to 01/12/2009), plants received a total water depth of 31.4 mm.
Treatments were differentiated in the productive period, phenological stages III and IV (12/02/2009 to 12/28/2009), with total depths and non-self-compensating emitters (Azudline®
model 160). Drip tapes were distributed in the field
according to the spacing adopted for yellow melon, of 2.0 m between rows and 0.5 m between plants. Irrigation was carried out with one emitter per plant,
with mean flow rate of 1.30 L h-1 at 75 kPa nominal
pressure and application intensity of 1.3 mm h-1.
Hybrid ‘Gold Mine’ yellow melon was sown
on October 23, 2009 on styrofoam trays containing Hortimix ® substrate and kept in a screen that allowed
50% shading for adequate germination. On October
28, 2009, when properly developed and uniform, seedlings were transplanted to beds (or ridges) of 3.0 m x 1.0 m x 0.20 m, which were manually raised with the soil of the arable layer according to the crop spacing. These beds were constructed with the purpose of improving the distribution of water applied near the root system of the plants.
A complete randomized block design with six treatments and four replicates was used. The plots of each treatment had four useful plants, because
the first and the last plants were considered border
plants. There were no borders plants between rows, since the spacing adopted, together with the survey of beds, did not allow interference between treatments. These were differentiated in the productive phase, phenological stages III and IV of yellow melon, with water depths referring to 25, 50, 75, 100, 125 and 150% crop evapotranspiration (ETc) applied at different irrigation times.
Irrigation management was based on
simplified climatological water balance for the 24 h period (Equation 1).
LL = ETc - Pe (1)
where:
LL is the liquid irrigation depth (mm day-1);
ETc is the crop evapotranspiration (mm day-1) of
each treatment (Equation 2); and
Pe is the effective rainfall (mm day-1).
ETc = EToPM Kc Kr (2)
where:
EToPM is the reference evapotranspiration of Penman-Monteith (mm day-1);
Kc is the cultivation coefficient (dimensionless); and Kr is the coverage coefficient (dimensionless).
Pe, estimated according to Smith (1992), when above ETc, was considered excess water and, therefore, was not accumulated for irrigation on the
corresponding to 25%, 50%, 75%, 100%, 125% and 150 % ETc (Table 1).
The daily depths of each treatment were graphically compared with the available water capacity (CAD) and with the readily available water (AFD) in the soil to verify if plants were submitted to water stress conditions. CAD was calculated (CAD = [(cc - pmp) / 10] zd) at 6.92 mm, with gravimetric
moisture data in the field capacity (cc = 3.64 g 100
g -1) and in the wilting point (pmp = 2.07 g 100 g -1),
the effective root depth (z = 30 cm) and the specific
weight (d = 1.47 g cm -3). AFD was daily estimated
(AFD = CAD p) with depletion factor ‘p’ of yellow
melon corrected for daily ETc, as proposed in the FAO Bulletin 56 (p = 0.45 + 0,04 (5 - ETc)) by Allen et al. (2006).
Fertilization was carried out via fertigation with the following fertilizers: urea and calcium nitrate (120 kg ha-1 N and 64.8 kg ha-1 Ca); phosphoric acid
(240 kg ha-1 P); white potassium chloride (180 kg ha-1
K2O); magnesium sulfate (21.6 kg ha-1 Mg); boric
acid (1 g plant-1 Bo); zinc sulfate (2 g plant-1 Zn).
Fertilizers were weekly applied by fertigation (5, 12, 19, 26, 33, 40, 47, 54 and 61 days after sowing) with the same volume to maintain application uniformity in all plants. In the differentiation of treatments and only at 54 days after sowing, this management showed the need for irrigation of treatments 25% and 50% ETc, although Pe was above ETc. In this case, and because the excess water volume applied by fertigation was very low, it was not considered as
liquid irrigation depth.
Treatments were manual weeding, spraying with insecticides and fungicides, branching, fruit turning and harvest (66 and 69 days after sowing). Only commercial fruits, in this case, those of intense yellow color with fresh weight between 0.60 and 2.80 kg, free of diseases and physical injuries, were harvested.
The variables analyzed were: number of
fruits per plant, polar and equatorial diameters, fresh
fruit weight, commercial productivity, skin and pulp thickness and soluble solids. In the analysis of polar
and equatorial diameters, fresh fruit weight and
commercial productivity, all commercial fruits from the useful area of plots were used. In the examination of skin and pulp thickness and soluble solids, two fruits from each plot were randomly selected.
The number of fruits per plant was obtained by the ratio between the total fruits produced in the useful area and the total plants in the respective useful area of each plot. The fresh weight of fruits was obtained with a precision electronic scale (0.01 g resolution), calculating the arithmetic mean for
each plot. Commercial productivity was estimated from the fresh weight of fruits of plots for the area of
one hectare. Polar (fruit length) and equatorial (fruit
width) diameters were measured with a digital caliper (0.01 mm resolution), calculating the arithmetic mean for each plot. Using two fruits of each plot, skin and pulp thickness was measured using the caliper above, as well as soluble solids, with a portable digital refractometer (0.1% resolution). The mean data of variables were submitted to regression analysis of variance by the orthogonal polynomial method,
testing linear and quadratic models.
Water productivity or water use efficiency
in the productive phase was calculated by means of
Equation 5.
(5)
where:
EUA is the water use efficiency (Mg ha-1 mm-1);
Y the commercial yield (Mg ha-1); and
W is the total water depth in the productive
phase (mm).
The response factor of yellow melon in the productive phase was calculated according to
Equation 6 (DOORENBOS; KASSAM, 1979).
(6)
where:
Ky is the crop response factor (dimensionless); Yr is the actual yield (Mg ha-1);
Ym is the maximum yield (Mg ha-1);
ETr is the actual evapotranspiration in the productive phase (mm); and
ETm is the maximum evapotranspiration in the productive phase (mm).
The evapotranspiration data used in
Equation 6 were adapted, since the actual ETr
and ETm values were not measured. Therefore, to estimate Ky, it was assumed that the maximum evapotranspiration values were estimated with 100% ETc treatment, and the actual values were estimated with 25%, 50% and 75% ETc treatments.
After calculating the individual Ky values for the interval of this experiment (25% to 100% ETc), Ky values were estimated for the interval proposed by FAO Bulletin 33 (50% to 100% ETc). To compose this
interval, deficits of 50%, 60%, 70%, 80% and 90%
ETc were selected. The corresponding total water depth and commercial yield values were estimated
based on the polynomial regression equation obtained
5 for 25%, 50%, 75%, 100%, 125% and 150% ETc
treatments. The maximum values (ETm and Ym) were considered as those of the optimal water depth
estimated with this equation, and the actual values
(ETr and Yr), as those estimated with percentages of 50%, 60%, 70%, 80% and 90% ETc .
The absolute Ky value for the entire deficit interval was considered as the angular coefficient of the regression equation, adjusted by the origin,
between the relative yield drop (1 - Yr / Ym) and the
relative evapotranspiration deficit (1 - ETr / ETm )
(BILIBIO et al., 2010).
The sensitivity of the melon crop to water supply deficit was classified according to FAO Bulletins 33 (DOORENBOS; KASSAM, 1979) and 66 (STEDUTO et al., 2012). According to FAO
Bulletin 33, the crop may have ‘low’ sensitivity (Ky <0.85), ‘low-intermediate’ sensitivity (0.85 <Ky <1.00), ‘intermediate-high’ sensitivity (1.00 < Ky < 1.15) and ‘high’ sensitivity (Ky> 1.15). According to FAO Bulletin 66, the crop can be ‘very sensitive’ (Ky> 1), ‘proportionally sensitive’ (Ky = 1) and ‘little sensitive’ (Ky <1).
RESULTS AND DISCUSSION
The regression analysis of variance showed
significant influence of water depths on the number of fruits per plant, equatorial diameter, fresh fruit
weight, commercial productivity and soluble solids
(Table 2). These variables presented the quadratic
variation pattern validated by the determination
coefficient using the Student’s t-test (Figure 2).
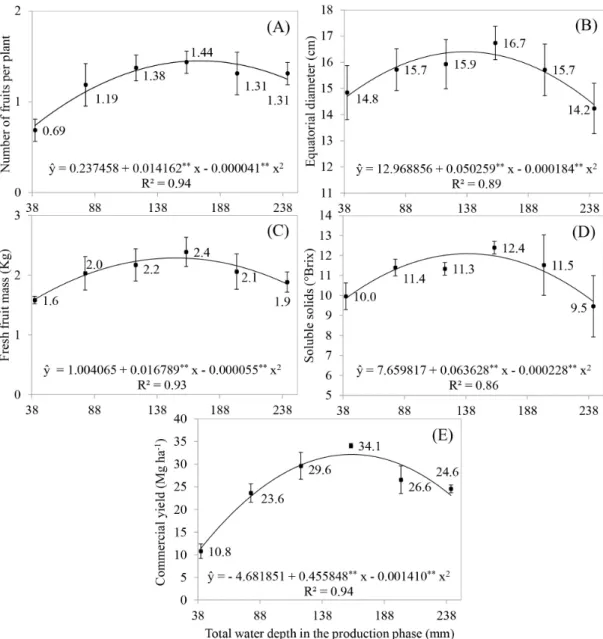
The highest amount of fruits produced (1.46 per plant) was estimated at the maximum point with total water depth of 172.7 mm or 107.2% ETc (Figure 2A). The remaining water depths, corresponding to 25%, 50%, 75%, 100%, 125% and 150% ETc treatments, reduced this value by 49.2%; 23.8%; 7.5%; 0.4%; 2.3%; and 13.4%, respectively.
In qualitative terms, the optimization of equatorial diameter (16.4 cm), fresh fruit weight
(2.3 kg) and soluble solids (12.1 ° Brix) of fruits was calculated at the maximum point with the respective total water depths of 136.6 mm (84.7% ETc), 152.6 mm (94.7% ETc) and 139.5 mm (86.6% ETc) (Figure 2B, 2C and 2D). The relative reductions caused by 25%, 50%, 75%, 100%, 125% and 150% ETc treatments were, in that order, 10.4%; 3.5%; 0.3%;
0.7%; 4.7%; and 12.4% in equatorial diameter,
30.4%; 12.5%; 2.4%; 0.2%; 5.7%; and 19.1% in fresh fruit weight and 18.6%; 6.5%; 0.7%; 0.9%; 7.2%; and 19.7% in soluble solids.
The commercial yield was maximized (32.2
Mg ha-1) with 161.6 mm (100.3% ETc) (Figure
2E). With 25%, 50%, 75%, 100%, 125% and 150%
ETc treatments, this value was reduced by 64.6%; 28.8%; 7.3%; 0.0%; 6.9%; and 28.1%, respectively. Considering commercial productivity as the most economically important variable, it could be said that the total water depth of 161.6 mm was the
most adequate for irrigation management without water restriction. Using equations in Figure 2, the
commercial fruit yield is estimated at 32.2 Mg ha-1
and the number of fruits per plant is estimated at
1.46, with equatorial diameter of 16.3 cm, fresh weight of 2.3 kg and soluble solids of 12.0 º Brix.
These characteristics, especially in relation to width and fresh weight of fruits, indicate their commercialization preferably in the domestic market.
The quadratic response of variables followed
the biological logic, that is, from the smallest water
depth to the maximum water requirement, the
variables evaluated increased in value at positive rates but gradually decreased, reaching the zero rate at the maximum point. From there, with water depths higher than the optimum, the variables decreased at negative rates. In terms of magnitude, variables were more negatively affected by 25% and 150% ETc treatments, which should have enhanced the
detrimental effects of the water deficit (25% ETc
treatment) and excess water (150% ETc treatment). These effects, considering the low water availability
capacity and the high infiltration rate of red-yellow
argisols (OTTONI FILHO, 2003), may have been
direct in water deficit conditions, rapidly reducing
the water availability in the root zone of plants, and indirect in excess water condition, increasing nutrient leaching below roots (Figure 3).
Figure 3 showed that the water depths of
treatment with the highest water deficit, 25% ETc, were not sufficient to restore AFD. In this condition,
according to Allen et al. (2006), the plant undergoes stress because its absorption occurs at rates lower than those of the transpirational demand. Under this type of stress, the morphological processes of yellow melon are impaired (PEREIRA FILHO et al., 2015), compromising production (SUASSUNA et al., 2011). In 50% ETc treatment, the irrigation levels also affected the crop; however, in a slightly less severe way, because in only a few periods, the water applied did not replace AFD. This lower severity of the deleterious effects was more evident in 75% ETc treatment, since the water depths applied were almost
always sufficient to restore AFD.
The complete replenishment of the water
required by the crop, with 100% ETc, was responsible
days, water depths were close to the upper limit of
AFD, in this case, the field capacity. Santos et al. (2013) explain that, in the field capacity, reducing the
energy expenditure of plants with water absorption avoids reductions in production.
Water depths of 125% and mainly 150% ETc treatments exceeded the field capacity during
most of the experimental phase. In order to allow the drainage of excess water by gravity (Alen et al., 2006) in sandy soil, may have favored the leaching of nutrients (ZENG et al., 2014), especially in weekly fertigation intervals. The adoption of high water depths in prolonged irrigation, with peaks over eight hours, should be cautious when fruits are not protected. In this work, some fruits that were close to emitters, those that presented rot, were not considered marketable, and were not included in the analyses.
According to results, it could be inferred that, if water is not a limiting factor, irrigation must fully restore the water needs of the crop to maximize commercial productivity. If otherwise, due to the occurrence of draughts, water must be supplied
in a deficit way in order to optimize the water use efficiency and maintain production sustainability.
In the present work, this efficiency presented
a cubic pattern with treatments (Figure 4).
The EUA maximization, estimated at 0.29 Mg ha-1 mm -1 with 72.9 mm water (45.2% ETc),
was not interesting for the crop, as it reduced the maximum commercial yield by 34.6%. EUA values of 25% and 50% ETc treatments, although high, were also not convenient, since they substantially reduced the optimum yield of the crop.
The adoption of a more moderate water
deficit, such as 75% ETc treatment, was the most
advantageous, since this treatment, in addition to
having provided high water use efficiency, caused
the lowest reduction in maximum productivity. This
indicates that the strategy of deficient irrigation in the
productive phase with 75% ETc could be used daily in yellow melon with minimal impacts on production. In this regard, Ahmadi-Mirabad et al. (2014) and Al-Mefleh et al. (2012) have shown that deficit irrigations with 80% and 75% ETc, respectively, can be statistically compared to irrigations with 100% ETc.
In a condition of moderate stress, yellow melon can present a certain morphophysiological dynamism (reduction of transpiration and root expansion, e.g.) to adapt to water scarcity (KUSVURAN, 2012; SHARMA et al., 2014). However, under extreme conditions, this adaptation may be limited by the scarcity of water availability. This could explain the drastic reduction of production
with 25% ETc and the less severe reduction with 50% and, in particular, 75% ETc.
According to Table 3, the decrease in commercial yield of yellow melon was less than proportional to the decrease in water use, since all Ky values were less than 1.
Ky values of 75%, 50% and 25% ETc treatments were 48%, 39% and 9% lower than the indicative limit of sensitivity. By mathematical optimization using linear regression (Ky = 0.8), this reduction reached 20% (Figure 5A).
In the deficit range recommended by FAO
Bulletin 33, Ky values remained low (Table 4). The
decrease in Ky value in the regression equation of
Figure 5B was 33% greater than that of Figure 5A, because the treatment that most negatively affected the culture (25% ETc) was neglected.
The results obtained and estimated in this work by treatment or by linear regression, have
indicated that the crop is tolerant (‘low sensitive’ or ‘little sensitive’) to prolonged daily irrigations
with controlled reduction of water supply (Ky <1) (DOORENBOS; KASSAM, 1979; STEDUTO et al., 2012). As explained by Lovelli et al. (2007), plants that present reduced Ky restrict less their yield with
water stress due to the greater water use efficiency
(Figure 3). Other experiments carried out under similar (LEITE et al., 2014) and different conditions
(SIMSEK, COMLEKCIOGLU, 2011), confirm, due
7
TABLE 1 - Total effective rainfall, adopted effective rainfall, liquid irrigation layer and total water depth
in each treatment at the productive phase (Phenological Phases III and IV) of hybrid ‘Gold Mine’ yellow melon.
Treatment 25% ETc 50% ETc 75% ETc 100% ETc 125% ETc 150% ETc Total effective rainfall (mm) 32.00 32.00 32.00 32.00 32.00 32.00 Adopted effective rainfall (mm) 11.15 17.78 20.64 22.11 23.59 25.06
Liquid irrigation layer (mm) 29.14 62.80 100.22 139.04 177.85 216.7
Total water depth (mm) 40.29 80.58 120.86 161.15 201.44 241.73 ETc: crop evapotranspiration.
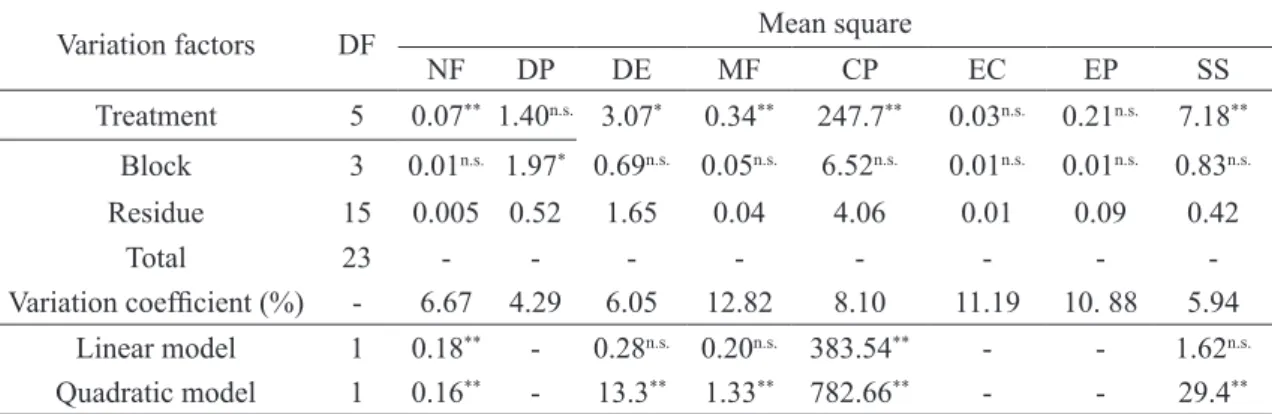
TABLE 2 - Summary of the regression analysis of variables of hybrid ‘Gold Mine’ yellow melon fruits.
Variation factors DF Mean square
NF DP DE MF CP EC EP SS
Treatment 5 0.07** 1.40n.s. 3.07* 0.34** 247.7** 0.03n.s. 0.21n.s. 7.18**
Block 3 0.01n.s. 1.97* 0.69n.s. 0.05n.s. 6.52n.s. 0.01n.s. 0.01n.s. 0.83n.s.
Residue 15 0.005 0.52 1.65 0.04 4.06 0.01 0.09 0.42
Total 23 - - -
-Variation coefficient (%) - 6.67 4.29 6.05 12.82 8.10 11.19 10. 88 5.94
Linear model 1 0.18** - 0.28n.s. 0.20n.s. 383.54** - - 1.62n.s.
Quadratic model 1 0.16** - 13.3** 1.33** 782.66** - - 29.4**
NF: number of fruits per plant (data transformed into square root); DP and DE: polar and equatorial diameters; MF: fresh fruit weight;
PC: commercial productivity; EC and PE: skin and pulp thickness; SS: soluble solids.
GL: degrees of freedom; n.s. Not significant at 5% by the F test; ** significant at 1% by the F test; * Significant at 5% by the F test.
TABLE 3 - Actual evapotranspiration (ETr), maximum evapotranspiration (ETm), relative evapotranspiration
deficit (1 - ETr / ETm), actual yield (Yr), maximum yield (Ym), relative yield decline (1 - Yr / Ym) and crop response factor to water deficit (Ky) of hybrid ‘Gold Mine’ yellow melon
during the productive phase (phenological stages III and IV).
Treatment ETr (mm) ETm (mm) (1 - ETr/ETm) Yr (Mg ha-1) Ym (Mg ha-1) (1 - Yr/Ym) Ky
25% ETc 49.29 161.15 0.75 10.81 34.08 0.68 0.91
50% ETc 80.58 161.15 0.50 23.64 34.08 0.31 0.61
75% ETc 120.86 161.15 0.25 29.62 34.08 0.13 0.52
ETc: crop evapotranspiration.
TABLE 4 - Estimated actual evapotranspiration values (ETr), maximum evapotranspiration (ETm), relative
evapotranspiration deficit (1 - ETr / ETm), actual yield (Yr), maximum yield (Ym), relative yield decline / Ym) and water deficit response factor (Ky) of hybrid ‘Gold Mine’ yellow melon
in the productive phase (phenological phases III and IV).
Treatment ETr (mm) ETm (mm) (1 - ETr/ETm) Yr (Mg ha-1) Ym (Mg ha-1) (1 - Yr/Ym) Ky
50% ETc 80.58 161.65 0.50 22.89 32.16 0.29 0.58
60% ETc 96.69 161.65 0.40 26.21 32.16 0.19 0.46
70% ETc 112.81 161.65 0.30 28.80 32.16 0.10 0.35
80% ETc 128.92 161.65 0.20 30.65 32.16 0.05 0.23
90% ETc 145.04 161.65 0.10 31.77 32.16 0.01 0.12
FIGURE 1 - Daily average values for one cycle of hybrid ‘Gold Mine’ yellow melon cultivation in 2009
and in the last 10 years (2001-2010): insolation (A), maximum and minimum air temperatures (B), relative air humidity (C), rainfall (D), wind speed (E) and Penman-Monteith reference evapotranspiration (F).
n.s.: the daily reference evapotranspiration values of 2009, statistically compared with the daily mean values of the 2001-2010 series,
9
FIGURE 2 - Number of fruits per plant (A), equatorial diameter (B), fruit fresh weight (C), soluble solids
(D), and commercial productivity (E) of hybrid ‘Gold Mine’ yellow melon as a function of
water depth (25%, 50%, 75%, 100%, 125% and 150% of crop evapotranspiration).
FIGURE 3 – Total water depth (liquid water depth and effective precipitation) of 25%, 50%, 75%, 100%,
125% and 150% ETc treatments in the productive phase (phenological phases III and IV) of
hybrid ‘Gold Mine’ yellow melon compared to the water availability capacity (CAD = 6.92 mm)
in soil and readily available water (AFD) recommended by Allen et al. (2006).
FIGURE 4 – Water use efficiency of hybrid ‘Gold Mine’ yellow melon in the productive phase (phenological
phases III and IV) as a function of the total water depth (liquid water depth and effective
precipitation) of 25%, 50%, 75% , 100%, 125% and 150% ETc treatments.
11
CONCLUSIONS
With no restriction to water application,
yellow melon cultivated under the edaphoclimatic conditions of the coast of Ceará can be irrigated daily
by low-flow drip tape with full replenishment of ETc
in the productive phase to maximize fruit production.
If there is water use restriction and for being
tolerant to water deficiency in the productive phase
(Ky <1), daily irrigation strategies with controlled
water deficit can be used.
ACKNOWLEDGMENTS
To the National Council for Scientific and Technological Development (CNPq), for financing
the project and granting of scholarships.
FIGURE 5 - Response factor to water deficit (Ky) of hybrid ‘Gold Mine’ yellow melon in the productive
phase (phenological phases III and IV), for treatments with 25%, 50% and 75% ETc (A) and estimated at 50%, 60%, 70%, 80% and 90% ETc (B). ETc: crop evapotranspiration.
REFERENCES
AHMADI-MIRABAD, A.; LOTFI, M.; ROOZBAN, M.R. Growth, yield, yield components and water-use
efficiency in irrigated cantaloupes under full and
deficit irrigation. Electronic Journal of Biology,
Bielefeld, v.10, n.3, p.79-84, 2014.
ALI, M.H.; HOQUE, M.R.; HASSAN, A.A.;
KHAIR, A. Effects of deficit irrigation on yield,
water productivity, and economic returns of wheat.
Agricultural Water Management, Amsterdam, v.92, n.3, p.151-161, 2007.
ALLEN, R.G.; PEREIRA, L.S.; RAES, D.; SMITH, M. Evapotranspiración del cultivo: guías para la
determinación de los requerimientos de agua de
los cultivos. Roma: Organización de las Naciones Unidas para la Agricultura y la Alimentación, 2006. 300 p. (Estudio FAO Riego y Drenaje, 56).
AL-MEFLEH, N.K.; SAMARAH, N.; ZAITOUN,
S.; AL-GHZAWI, A. A. M. Effect of irrigation levels
on fruit characteristics, total fruit yield and water
use efficiency of melon under drip irrigation system.
Journal of Food, Agriculture and Environment, Helsinki, v.10, n.2, p.540-545, 2012.
BAHADUR, A., CHATTERJEE, A., KUMAR, R., SINGH, M., NAIK, P. Physiological and biochemical basis of drought tolerance in vegetables. Vegetable Science, Jakhini, v.38, n.1, p.1-16, 2011.
C A M P E L O , A . R . ; A Z E V E D O , B . M . d e ; NASCIMENTO NETO, J.R. do; VIANA, T.V. de A.; PINHEIRO NETO, L.G.; LIMA, R.H. Manejo da
cultura do melão submetida a frequências de irrigação
e fertirrigação com nitrogênio. Horticultura
Brasileira, Brasília, v.32, n.2, p.138-144, 2014.
CAVALCANTI, N.M. da S.; DUTRA, A.F.; MELO,
A.S. de; SILVA, F.G. da; DUTRA, W.F.; NUNES
JUNIOR, E. da S. Aspectos agronômicos do meloeiro
‘Mandacaru’ cultivado em ambiente protegido sob
irrigação. Irriga, Botucatu, v.20, n.2, p.261-272, 2015.
DOGAN, E.; KIRNAK, E.H.; BEREKATOGLU,
E.K.; BILGEL, E.L.; SURUCU, E.A. Water stress
imposed on muskmelon (Cucumis melo L.) with subsurface and surface drip irrigation systems under semi-arid climatic conditions. Irrigation Science, New York, v.26, n.2, p.131-138, 2008.
DOORENBOS, J.; KASSAM, A.H. Yield response to water. Rome: Food and Agriculture Organization of the United Nations, 1979. 257 p. (Irrigation and Drainage Paper, 33).
FIGUEIRÊDO, M.C.B. de; BOER, I.J. de; KROEZE, C.; BARROS, V. da S.; SOUSA, J.A. de; ARAGÃO, F.A.S. de; POTTING, J. Reducing the impact of irrigated crops on freshwater availability: the case of Brazilian yellow melons. The International Journal of Life Cycle Assessment, New York, v.19, n.2, p.437-448, 2014.
KELLER, J.; KARMELI, D. Trickle irrigation design parameters. Transactions of the ASAE, St. Joseph, v.17, p.678-684, 1974.
KUSVURAN, S. Effects of drought and salt stresses on growth, stomatal conductance, leaf water and osmotic potentials of melon genotypes (Cucumis melo L.). African Journal of Agricultural Research, Nigeria, v.7, n.5, p.775-781, 2012.
LEITE, K. N.; CABELLO, M. J.; VALNIR JÚNIOR, M.; TARJUELO, J. M.; DOMÍNGUEZ, A. Modelling
sustainable salt water management under deficit
irrigation conditions for melon in Spain and Brazil.
Journal of the Science of Food and Agriculture, Oxford, v.95, p.2307-2318, 2014.
LOVELLI, S.; PERNIOLA, M.; FERRARA, A.; DI TOMMASO, T. Yield response factor to water (Ky)
and water use efficiency of Carthamus tinctorius
L. and Solanum melongena L. Agricultural Water Management, Amsterdam, v.92, n.1, p.73-80, 2007.
MANI, F. Evaluation of drought stress on yield and physiological attributes in Cantaloupe crop (Cucumis melo L.). Agriculture, Sousse, v.4, n.12, p.6-10, 2014.
MIORINI, T.J.J.; SAAD, J.C.C.; MENEGALE, M.L. Supressão de água em diferentes fases fenológicas do feijoeiro (Phaseolus vulgaris L.). Irriga, Botucatu, v.16, n.4, p.360-368, 2011.
M I R A N D A , F. R . d e ; B L E I C H E R , E .
Evapotranspiração e coeficientes de cultivo e de irrigação para a cultura do melão (Cucumis melo L.) na região litorânea do Ceará. Fortaleza: Embrapa Agroindústria Tropical, 2001. 17 p.
OTTONI FILHO, T. Uma classificação físico-hídrica
dos solos. Revista Brasileira de Ciência do Solo, Viçosa, MG, v.27, n.2, p.211-222, 2003.
PEREIRA FILHO, J.V.; BEZERRA, F.M.L.; CHAGAS, K.L.; SILVA, T.C. da; Pereira, C.C.M.
de S. Trocas gasosas e fitomassa seca da cultura do
meloeiro irrigado por gotejamento nas condições semiáridas do Nordeste. Revista Brasileira de Agricultura Irrigada, Fortaleza, v.9, n.3, p.171-182, 2015.
PEREIRA FILHO, J.V.; BEZERRA, F.M.L.; SILVA, A.R.A.; SOUSA, C.C.M. de; CASTRO, J.M. de.
Frequência de irrigação e aplicação de N em meloeiro
irrigado por gotejamento nas condições semiáridas do Nordeste. Científica, Jaboticabal, v.42, n.1, p.11-22, 2014.
PIRES, M.M.M.L.; SANTOS, H.A.; SANTOS, D.F.; VASCONCELOS, A.S.; ARAGÃO, C.A.Produção do meloeiro submetido a diferentes manejos de água com o uso de manta de tecido não tecido.
13 SANTOS, C.S. dos; SILVA, P.F. da; SANTOS,
J.C.C.dos; SILVA, C.H. da; BARROS, A.C. Estimativa da umidade na capacidade de campo em vasos e em laboratório. Revista Verde de Agroecologia e Desenvolvimento Sustentável, Pombal, v.8, n.2, p.151-160, 2013.
SANTOS,H.G. dos; JACOMINE, P.K.T.; ANJOS, L.H.C. dos; OLIVEIRA, V.Á. de; COELHO, M.R.; LUMBRERAS, J.F.; CUNHA, T.J.F. (Ed.). Sistema
brasileiro de classificação de solos. 2.ed. Rio de Janeiro: EMBRAPA-SPI, 2006. 306 p.
SHARMA, S.P.; LESKOVAR, D.I.; CROSBY, K.M.; VOLDER, A.; IBRAHIM, A.M. H. Root growth,
yield, and fruit quality responses of reticulatus
and inodorus melons (Cucumis melo L.) to deficit subsurface drip irrigation.Agricultural Water Management, Amsterdam, v.136, p.75-85, 2014.
SILVA, A.R.A. da; BEZERRA, F.M.L.; FREITAS, C.A.S. de; AMORIM, A.V. de; CARVALHO, L.C.C.;
PEREIRA FILHO, J.V. Coeficientes de sensibilidade ao déficit hídrico para a cultura do girassol nas
condições do semiárido cearense. Revista Brasileira de Agricultura Irrigada, Fortaleza, v.8, n.1, p.38-51, 2014.
SIMSEK, M.; COMLEKCIOGLU, N. Effects of different irrigation regimes and nitrogen levels on
yield and quality of melon (Cucumis melo L.).
African Journal of Biotechnology, Lagos, v.10, n.49, p.10009 -10018, 2011.
SMITH, M. Cropwat: a computer program for irrigation planning and management. Rome: Food and Agriculture Organization of the United Nations, 1992. 126 p.
STEDUTO, P.; HSIAO, T.C.; FERERES, E.; RAES, D. Crop yield response to water. Rome: Food and Agriculture Organization of the United Nations, 2012. 500 p.(Irrigation and Drainage Paper, 66).
SUASSUNA, J.F.; MELO, A.S.; COSTA, F.S.; FERNANDES, P.D.; FERREIRA, R.S.; SOUSA,
M.S.S. Eficiência fotoquímica e produtividade de
frutos de meloeiro cultivado sob diferentes lâminas de irrigação. Semina: Ciências Agrárias, Londrina, v.32, n.4, p.1251-1262, 2011.
VALNIR JÚNIOR, M.; LIMA, V.L.A. de; GOMES FILHO, R.R.; CARVALHO, C.M. de; SOARES, F.A.L.; LIMA, S.C.R.V. Lâminas de irrigação e
frequência de aplicação no crescimento do meloeiro.
Revista Brasileira de Agricultura Irrigada, Fortaleza, v.7, n.1, p.42-53, 2013.
ZENG, W.; XU, C.; WU, J.; HUANG, J. Soil