Revista Brasileira de
Engenharia Agrícola e Ambiental
Campina Grande, PB, UAEA/UFCG – http://www.agriambi.com.br
v.22, n.2, p.95-100, 2018
Tomato water stress index as a function of irrigation depths
Cícero J. da Silva
1, César A. da Silva
1, Carlos A. de Freitas
2,
Adelmo Golynski
1, Luiz F. M. da Silva
1& José A. Frizzone
3 DOI: http://dx.doi.org/10.1590/1807-1929/agriambi.v22n2p95-100A B S T R A C T
Infrared thermometry allows evaluating plants under water stress, by measuring the canopy temperature, without the need of physical contact with the leaves. The aim of this study was to determine the water stress index of the tomato crop for industrial processing (Hybrid ‘BRS Sena’), as a function of irrigation depths applied by subsurface drip irrigation, in Southern Goiás, Brazil, in 2015 and 2016. The experiment was conducted in a randomized block design, with four replicates. The treatments consisted in five irrigation depths: 50, 75, 100, 125 and 150% of crop evapotranspiration. The water stress index of the tomato crop was evaluated using two methodologies, as a function of the canopy temperature, air temperature and other local meteorological parameters, as well as the relationship between water stress index and crop yield. Theoretical and empirical methods estimate CWSI similarly in tomato. In the hottest hours of the day, even under adequate soil moisture conditions, the ‘BRS Sena’ tomato showed CWSI above 0.2. CWSI is a good indicator to evaluate the water status of the tomato crop for industrial processing and to recommend the moment of irrigation. The higher the CWSI, the lower the yield of ‘BRS Sena’ tomato.
Índice de estresse hídrico de tomateiro
em função de lâminas de irrigação
R E S U M O
A termometria infravermelha permite avaliar o estresse hídrico das plantas através da medição da temperatura do dossel, sem necessidade de contato físico com as folhas. Objetivou-se neste trabalho determinar o índice de estresse hídrico do tomateiro industrial (híbrido BRS Sena) em função de lâminas de irrigação aplicadas por gotejamento subsuperficial, na região Sul de Goiás, nos anos 2015 e 2016. O delineamento experimental foi em blocos ao acaso, com quatro repetições. Os tratamentos consistiram de cinco lâminas de irrigação, iguais a 50, 75, 100, 125 e 150% da evapotranspiração da cultura. Avaliou-se o índice de estresse hídrico do tomateiro por meio de duas metodologias, em função da temperatura no dossel, temperatura do ar e demais parâmetros meteorológicos locais, e também a relação dos valores do índice de estresse hídrico com a produtividade da cultura. Os métodos teórico e empírico estimam de maneira semelhante o CWSI no tomateiro. Nas horas mais quentes do dia, mesmo em condições de umidade adequada no solo, o tomateiro BRS Sena apresentou CWSI acima de 0,2. O CWSI é um bom indicativo para avaliar o estado hídrico do tomateiro industrial e indicar o momento de realizar a irrigação. Quanto maior o CWSI, menor foi a produtividade do tomateiro BRS Sena.
Key words:
subsurface drip industrial tomato canopy temperature Solanum lycopersicom L. crop evapotranspiration
Palavras-chave:
irrigação sub-superficial tomateiro industrial temperatura do dossel Solanum lycopersicom L. evapotranspiração de cultura
1 Instituto Federal Goiano/Campus Morrinhos. Morrinhos, GO. E-mail: [email protected] (Corresponding author); [email protected];
[email protected]; [email protected]
2 Universidade Estadual Paulista “Júlio de Mesquita Filho”/Faculdade de Ciências Agrárias e Veterinárias. Jaboticabal, SP. E-mail: [email protected] 3 Universidade de São Paulo/Escola Superior de Agricultura “Luiz de Queiroz”. Piracicaba, SP. E-mail: [email protected]
Introduction
Fast and accurate assessment of plant water status is very useful in irrigation management, especially in crops such as industrial tomato (Solanumlycopersicom L.), which is highly sensitive to water stress (Ramírez et al., 2015).
Using infrared thermometers is a fast, practical, reliable and non-destructive technique that allows to adjust irrigation management and measure crop water stress index (CWSI), which varies from zero (plant under no water stress) to one (plant under severe water stress). Canopy temperature, under both water stress and no stress conditions, may provide information on crop water status and favor irrigation management (Idso et al, 1981; Jackson et al., 1981, 1988; López et al., 2009a, b; Sezen et al., 2014; Ghaemi et al., 2015).
CWSI is the most used index to quantify water stress in plants. It determines the actual transpiration base line of a crop through the difference between canopy and air temperatures, vapor pressure deficit, characteristics of the crop and atmospheric conditions, which allows to quantify the water stress levels in the leaves (López et al., 2009a, b; Sezen et al., 2014; Ramírez et al., 2015).
There is a direct relationship between CWSI and yield. The higher the index, the lower the yields of crops, as observed by López et al. (2009b) with husk tomato (Physalis ixocarpa
Brot.) in Mexico; Ghaemi et al. (2015) with eggplant (Solanum melongena L.) in Iran; Erdem et al. (2005), Ünlü et al. (2011), Sezen et al. (2014) and Çolak et al. (2015) in Turkey, with watermelon (Citrullus lanatus Thumb. Mansf.), cotton (Gossypium hirsutum L.), red pepper (Capsicum annuum L.) eggplant, respectively.
The present study aimed to determine CWSI of industrial tomato (Hybrid ‘BRS Sena’), through theoretical and empirical methods, as a function of irrigation depths applied by subsurface drip in a Latosol in Southern Goiás, Brazil.
Material and Methods
The experiment was carried out in 2015 (June to October) and 2016 (May to September) at the Federal Institute of Goiás, Campus of Morrinhos-GO, Brazil (17º 49’ 19.5” S; 49º 12’ 11.3” W; 885 m). The climate of the region is Aw, semi-humid tropical, with rainy season and dry winter, according to Köppen’s classification.
The study was conducted in an area of Latosol, with apparent density of 1.16 kg dm-3, moisture of 0.36 m3 m-3
(-10 kPa) at field capacity and 0.23 m3 m-3 (-1500 kPa) at
permanent wilting point, in the 0-30 cm layer. Soil tillage
was conventionally performed in 2015, and no-tillage was adopted in 2016. Soil fertilization was performed according to soil analyses (Table 1), aiming at expected yield of 130 t ha-1
(CFSGO, 1988).
In 2015, liming was applied broadcast at 51 days before transplanting. In 2016, it was necessary to correct the soil. In both years, fertilizers were applied in the planting furrow, three days before transplanting, whereas top-dressing fertilizations were applied through fertigation, 50% at 22 days after transplanting (DAT) (urea and potassium chloride - fertigation) and 50% at 35 DAT (calcium nitrate and potassium chloride - fertigation).
Seedlings were transplanted at 26 days after sowing to the furrow of the dripper and fertilizer, already covered with soil at field capacity. Until 8 DAT, plants were daily irrigated and, from 8 DAT on, they were irrigated in alternate days, replacing 100% of crop evapotranspiration (ETc), to guarantee seedling establishment. From 25 DAT on, the crop was subjected to irrigation depths of 50, 75, 100, 125 and 150% ETc (treatments), in a randomized block design, with four replicates.
Each experimental unit was composed of three 5.5-m-long plant rows spaced by 1.10 m. Plants were spaced at 0.30 m in the planting row, totaling 18 plants per row, 54 plants per plot. Blocks and plots were spaced by 6 and 4 m, respectively.
Subsurface drip system was installed at 0.20-m depth, using one pressure-compensating emitter per plant, with flow rate of 2.2 L h-1 and with the anti-siphon system, operating at 150-kPa
pressure. ETc was determined through the weight variation of five weighing lysimeters, with capacity for 52 L, diameter of 32.5 cm and accuracy of 10 g, which were filled with air-dried soil of the experimental area (0-15 cm layer) and cultivated with one tomato plant. Irrigation times of each treatment were calculated based on ETc, wet strip width, spacing, dripper flow rate and irrigation depth (treatments). Meteorological data were monitored by an automatic weather station, located approximately 400 m away from the experiment.
Cumulative values of ETc, obtained in the lysimeters, were equal to 474.0 and 492.2 mm, whereas those of reference evapotranspiration (ETo), calculated through Penman-Monteith, according to Allen et al. (1998), were 490.2 and 426.9 mm, in 2015 and 2016, respectively. Irrigation depths (treatments) varied proportionally to ETc, in both years of study. The relationship between ETc and ETo was used to estimate the mean values of Kc (0.62, 0.94, 1.12, 1.17 and 0.77), relative to both years, for the stages of 0-10 DAT (initial), 11-40 DAT (vegetative), 41-70 DAT (flowering), 71-97 DAT (fruiting) and 98-125 DAT (maturation), respectively.
Methodology used: pH - Electrode in soil:water suspension (1:2.5); P, K and Na - Mehlich 1; Ca, Mg and Al - Potassium chloride; H + AL - Calcium acetate at pH 7.0; Organic matter - Wet oxidation (organic carbon content x 1.724)
Sample
Chemical analysis
Organic matter g dm-3
Granulometric analysis
pH water P K Na Ca Mg Al H + Al Sand Silt Clay
mg dm-3 cmolcdm-3 g kg-1
2015
0-20 cm 5.7 2.6 44.0 9.0 2.9 1.2 0.0 2.6 31.1 486 100 414
20-40 cm 5.5 1.5 35.0 8.0 1.8 0.8 0.1 2.9 26.0 494 121 385
2016
0-20 cm 6.4 13.3 94.4 87.0 3.2 1.2 0.0 1.7 37.8 - -
-20-40 cm 5.7 13.3 6.5 88.0 0.8 0.8 0.0 2.3 32.6 - -
After the 100 DAT, irrigations were suspended and harvest was performed at 125 DAT. Crop water stress index (CWSI) for the ‘BRS Sena’ tomato and the relationship between CWSI and yield were evaluated.
CWSI was evaluated at 31, 36, 44, 64, 78, 85 and 100 DAT. Canopy temperature was measured with a portable infrared thermometer (Benetech, model GM300) with 1.5 ºC accuracy, placed at 1.0 m from the tomato canopy and inclined about 45º in relation to the horizontal direction. Readings were taken from 11:00 to 13:00 h, three per plot, obtaining the mean value. Mean temperature of crop canopy (Tc) in each treatment, mean air temperature (Ta) during the evaluation period and other meteorological data were used to calculate the CWSIT (theoretical model), through the methodology proposed by Jackson et al. (1988), according to Eq. 1:
CWSIE (empirical method) was calculated using Eq. 1, by substituting the lower base line of temperature (Tc - Ta)LBL by the lowest difference between crop canopy temperature (Tc) and mean air temperature (Ta), and the upper base line of temperature (Tc - Ta)UBL by the maximum differences between Tc and Ta, as proposed by Idso et al. (1981). It makes this methodology easier to use, compared with the theoretical method, which has more complex calculations.
CWSI data were subjected to analysis of variance (Fisher’s F test), at 5% significance level (p < 0.05), using the software SISVAR (Sistema de Análise de Variância) (Ferreira, 2011). When there was significant effect of treatments (irrigation depths) on CWSI, polynomial regression analysis was used. The regression model was selected based on the significance level of up to 0.05 probability level by F test and highest coefficient of determination (R2). Both CWSI evaluation methods were
compared and its relationship with tomato yield was assessed through linear correlation analysis.
Results and Discussion
Irrigation depths had significant effect on CWSIT and CWSIE (p ≤ 0.01), in both years of evaluation. Exceptions occurred at 64 DAT, in 2015 (p ≤ 0.05) and at 44 DAT, in 2015, and 100 DAT, in 2016, when CWSI did not show significant difference for any of the methods evaluated. The evaluation periods with no influence of treatments on CWSI coincided with cloudy days, with low solar radiation, low temperature and high relative humidity, and at 100 DAT in 2016 there was rainfall of 14.8 mm on the day prior to evaluation, which certainly equalized soil moisture, not characterizing significant difference of canopy temperature between treatments.
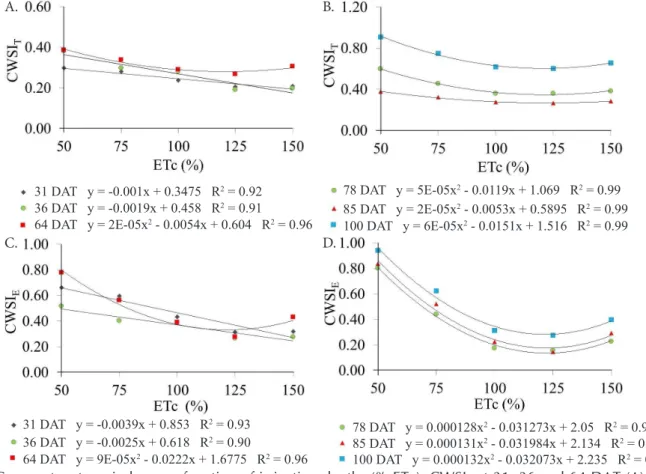
The quadratic equation showed the best fit to the CWSI, regardless of the methodology used, at 68, 78, 85 and 100 DAT, in 2015 and 2016, and at 36 and 44 DAT, in 2016. On the other hand, at 31 and 36 DAT, in 2015, and at 31 DAT, in 2016, a decreasing linear effect occurred as the irrigation depths increased. The lowest CWSIT and CWSIE in 2015 were estimated as: 0.24 and 0.33 (64 DAT); 0.36 and 0.14 (78 DAT); 0.24 and 0.18 (85 DAT); and 0.56 and 0.29 (100 DAT), with replacements of 135 and 122%, 119 and 122%, 132.5 and 122%, and 126 and 121.5% ETc, respectively (Figures 1A, B, C, D).
In the second year of evaluation, the lowest CWSIT and CWSIE were estimated as: 0.36 and 0.15 (36 DAT); 0.66 and 0.53 (44 DAT); 0.30 and 0.31 (64 DAT); 0.46 and 0.20 (78 DAT); and 0.60 and 0.19 (85 DAT), with replacements of 137 and 139%, 114 and 115%, 129 and 131%, 118 and 117% and 111 and 110% ETc, respectively (Figures 2A, B, C, D).
Regardless of period and method of determination, the highest CWSI values were obtained in plants under water deficit. This result corroborates with those found by López et al. (2009b) with husk tomato in Mexico, Ghaemi et al. (2015) with eggplant in Iran, Ramírez et al. (2015) with cherry tomato in Piracicaba-SP, and also those found by Erdem et al. (2005), Ünlü et al. (2011) and Çolak et al. (2015) in Turkey,
CWSI
T T T T
T T T T
c a c a LBL
c a UBL c a LBL =
(
−)
−(
−)
−
(
)
−(
−)
where:
(Tc - Ta)LBL - lower base line of temperature; and, (Tc - Ta)UBL - upper base line of temperature.
Lower base lines of temperature were calculated through the theoretical method, equation of Jackson et al. (1981), considering stomatal resistance as equal to zero, completely wet canopy, according to Eq. 2.
T T R G r
Cp
VPD
c a LBL
n a ar −
(
)
=(
−)
+∆ − +∆ . ργ γ γ
1 1
where:
ra - aerodynamic resistance, s m-1;
γ - psychrometric constant, kPa ºC-1;
Rn - net radiation balance, W m-2;
G - heat flux in the soil = zero;
ρar - air density at constant pressure, kg m-3;
Cp - air specific heat at constant pressure, J kg-1 ºC-1 =
1013;
∆ - slope of the saturation water vapor pressure curve at the temperature, kPa ºC-1; and,
VPD - vapor pressure deficit, kPa.
Aerodynamic resistance (ra) was calculated using the methodology proposed by Jackson et al. (1988), considering wind speed > 2 or ≤ 2 m s-1. The other parameters in Eq. 2 were
determined according to Allen et al. (1998). Mean temperature to calculate the slope of the vapor pressure curve (∆) was calculated considering mean canopy temperature and mean air temperature (oC), according to Jackson et al. (1988).
Upper base line of temperature (Tc - Ta)UBL, which represents the difference of temperature a waterproofed plant surface, corresponding to the temperature of the dry surface, i.e., resistance close to infinite, was calculated (Eq. 3) according to the methodology of Jackson et al. (1981, 1988).
T T R G r
Cp
c a UBL
A. B.
C. D.
31 DAT y = -0.001x + 0.3475 R2 = 0.92
36 DAT y = -0.0019x + 0.458 R2 = 0.91
64 DAT y = 2E-05x2 - 0.0054x + 0.604 R2 = 0.96
78 DAT y = 5E-05x2 - 0.0119x + 1.069 R2 = 0.99
85 DAT y = 2E-05x2 - 0.0053x + 0.5895 R2 = 0.99
100 DAT y = 6E-05x2 - 0.0151x + 1.516 R2 = 0.99
31 DAT y = -0.0039x + 0.853 R2 = 0.93
36 DAT y = -0.0025x + 0.618 R2 = 0.90
64 DAT y = 9E-05x2 - 0.0222x + 1.6775 R2 = 0.96
78 DAT y = 0.000128x2 - 0.031273x + 2.05 R2 = 0.99
85 DAT y = 0.000131x2 - 0.031984x + 2.134 R2 = 0.98
100 DAT y = 0.000132x2 - 0.032073x + 2.235 R2 = 0.99
Figure 1. Crop water stress index as a function of irrigation depths (% ETc): CWSIT at 31, 36 and 64 DAT (A); 78, 85 and 100 DAT (B) and CWSIE at 31, 36 and 64 DAT (C), 64, 78, 85 and 100 DAT (D) in 2015
A. B.
C. D.
31 DAT y = -0.0015x + 0.419 R2 = 0.89
36 DAT y = 5E-05x2 - 0.0145x + 1.359 R2 = 0.94
44 DAT y = 7E-05x2 - 0.017x + 1.6265 R2 = 0.82
64 DAT y = 2E-05x2 - 0.0044x + 0.5805 R2 = 0.97
78 DAT y = 6E-05x2 - 0.0134x + 1.2445 R2 = 0.97
85 DAT y = 6E-05x2 - 0.0133x + 1.364 R2 = 0.92
31 DAT y = -0.0057x + 0.8815 R2 = 0.89
36 DAT y = 0.0001x2 - 0.0292x + 2.184 R2 = 0.93
44 DAT y = 1E-04x2 - 0.0223x + 1.7945 R2 = 0.80
64 DAT y = 9E-05x2 - 0.0245x + 1.9115 R2 = 0.96
78 DAT y = 0.0001x2 - 0.0307x + 1.992 R2 = 0.96
85 DAT y = 0.0002x2 - 0.0354x + 2.152 R2 = 0.91
Figure 2. Crop water stress index as a function of irrigation depths (% ETc): CWSIT at 31, 36 and 44 DAT (A); 64, 78 and 85 DAT (B) and CWSIE at 31, 36 and 64 DAT (C), 64, 78, 85 and 100 DAT (D) in 2016
with watermelon, cotton and eggplant, respectively. This is certainly due to the lower soil moisture in these treatments, which causes the plant to decrease leaf transpiration due to the
probably results from the stress caused by the excess of water in the soil. This was also observed by López et al. (2009b), evaluating replacements from 40 to 120% of reference evapotranspiration (ETo) in husk tomato in Mexico and by Ünlü et al. (2011), testing replacements from 0 to 600 mm of irrigation in the cotton crop in Turkey.
The high CWSI values of the tomato crop, especially in phenological stages from 44 to 100 DAT, are certainly due to the increase in leaf area, flowering and fruiting, associated with increments in temperature and vapor pressure deficit (Ramírez et al., 2015). Possibly, tomato plants in hotter times and days are not able to meet the high water demand of the atmosphere (ETo), even with ideal moisture content in the soil, a fact also observed by Marin et al. (2005) in coffee and by Marin & Angelocci (2011), in Tahiti lime, in Piracicaba, SP.
Plant transpiration tending to stabilize, not following the atmospheric demand, causes an increase in canopy temperature
due to the partial stomatal closure. Such observation should be further investigated because it contradicts the current assertions of the studies, relating ETc and ETo by a constant Kc for atmospheric water demand conditions, as has been assumed for annual crops (Allen et al., 1998).
In general, the theoretical method estimated higher CWSI values compared with the empirical method, which was also found by Ramírez et al. (2015) with cherry tomato in Piracicaba-SP, and by Ghaemi et al. (2015) with eggplant in Iran. However, regardless of year and evaluation periods, there is a strong linear correlation (R2 = 0.99) between both methods.
This is an indication that it is possible to use the theoretical and empirical methods with accuracy to estimate CWSI in ‘BRS Pena’ tomato, for the edaphoclimatic conditions of the experimental area (Figures 3A, B, C and D).
Similar results were found by Ramírez et al. (2015) in Piracicaba-SP and by Ghaemi et al. (2015) in Iran, comparing
A. B.
2015 y = -146.24x + 156.08 R2 = 0.30
2016 y = -140.92x + 162.59 R2 = 0.31
2015 y = -49.464x + 106.68 R2 = 0.31
2016 y = -63.316x + 115.91 R2 = 0.35
Figure 4. Dispersion between fruit yield and CWSIT (A) and CWSIE (B) in 2015 and 2016
A. B.
C. D.
31 DAT y = 0.2538x + 0.1277 R2 = 0.99
36 DAT y = 0.7577x - 0.0107 R2 = 0.99
64 DAT y = 0.2491x + 0.1949 R2 = 0.99
78 DAT y = 0.3676x + 0.2978 R2 = 0.99
85 DAT y = 0.1646x + 0.2381 R2 = 0.99
100 DAT y = 0.4532x + 0.4785 R2 = 0.99
31 DAT y = 0.7481x + 0.2623 R2 = 0.99
36 DAT y = 0.4861x + 0.2822 R2 = 0.99
44 DAT y = 0.2635x + 0.1922 R2 = 0.99
64 DAT y = 0.4532x + 0.4785 R2 = 0.99
78 DAT y = 0.3676x + 0.2978 R2 = 0.99
85 DAT y = 0.1646x + 0.2381 R2 = 0.99
both CWSI determination methodologies. These results make the empirical method for CWSI calculation advantageous, due to its easy use compared with the theoretical method.
Fruit yield of the crop is correlated with the mean values of CWSIT and CWSIE, regardless of the evaluation year. ‘BRS Sena’ tomato yield linearly decreases as the CWSI increases (Figures 4A and B).
The results found are similar to those reported by López et al. (2009b) with husk tomato (Physalis ixocarpa Brot.) in Mexico, and Ghaemi et al. (2015) with eggplant (Solanum melongena L.) in Iran, who concluded that the higher the CWSI, the lower the yield of the crops.
Conclusions
1. The highest crop water stress indices in ‘BRS Sena’ tomato occurred in the treatments with highest water restrictions.
2. The theoretical and empirical methods similarly estimate the CWSI in ‘BRS Sena’ tomato, which makes the empirical method advantageous, due to its easy application.
3. In the hottest hours of the day, even under adequate soil moisture conditions, the ‘BRS Sena’ tomato showed CWSI above 0.2.
4. CWSI can be a good indication to evaluate the water status of the tomato crop for industrial processing and indicate the moment for irrigation.
5. The higher the CWSI, the lower the yield of ‘BRS Sena’ tomato.
Literature Cited
Allen, R. G.; Pereira, L. S.; Raes, D.; Smith, M. Crop evapotranspiration: Guidelines for computing crop water requirements. Rome: FAO, 1998. 300p. Irrigation and Drainage Paper, 56
Çolak, Y. B.; Yazar, A.; Çolak, I.; Akça, H.; Duraktekin, G. Evaluation of crop water stress index (CWSI) for eggplant under varying irrigation regimes using surface and subsurface drip systems. Agriculture and Agricultural Science Procedia, v.4, p.372-382, 2015. https://doi.org/10.1016/j.aaspro.2015.03.042
CFSGO - Comissão de Fertilidade de Solos de Goiás. Recomendações de corretivos e fertilizantes para Goiás. 5.ap. Goiânia: UFG/ EMGOPA, 1988.10p. Informativo Técnico, 1
Erdem, Y.; Erdem, T.; Orta, A.; Okursoy, H. Irrigation scheduling for watermelon with crop water stress index (CWSI). Journal of Central European Agriculture, v.6, p.449-460, 2005.
Ferreira, D. F. Sisvar: A computer statistical analysis system. Ciência e Agrotecnologia, v.35, p.1039-1042, 2011. https://doi.org/10.1590/ S1413-70542011000600001
Ghaemi, A.; Moazed, H.; Rafiee, M. R.; Nasab, S. B. Determining CWSI to estimate eggplant evapotranspiration and yield under greenhouse and outdoor conditions. Iran Agricultural Research, v.34, p.49-60, 2015.
Idso, S. B.; Jackson, R. D.; Pinter Júnior, P. J.; Reginato, R. J.; Hatfield, J. L. Normalizing the stress-degree-day parameter for environmental variability. Agricultural Meteorology, v.24, p.45-55, 1981. https:// doi.org/10.1016/0002-1571(81)90032-7
Jackson, R. D.; Idso, S. B.; Reginato, R. J.; Pinter Júnior, P. J. Canopy temperature as a crop water stress indicator. Water Resources Research, v.17, p.1133-1138, 1981. https://doi.org/10.1029/ WR017i004p01133
Jackson, R. D.; Kustas, W. P.; Choudhury, B. J. A reexamination of the crop water stress index. Irrigation Science, v.9, p.309-317, 1988. https://doi.org/10.1007/BF00296705
López, R. L.; Ramirez, R. A.; Peña, M. A. V.; Cruz, I. L.; Cohen, I. S. Indice de estrés hídrico como um indicador del momento de riego em cultivos agrícolas. Agricultura Técnica em México, v.35, p.97-111, 2009a.
López, R. L.; Ramirez, R. A.; Peña, M. A. V.; Cruz, I. L.; Cohen, I. S; Garcia, A. R. Índice de estrés hídrico del cultivo de tomate de cáscara (Physalis ixocarpa Brot.). Revista Chapingo, v.15, p.259-267, 2009b.
Marin, F. R.; Angelocci, L. R. Irrigation requirements and transpiration coupling to the atmosphere of a citrus orchard in Southern Brazil. Agricultural Water Management, v.98, p.1091-1096, 2011. https:// doi.org/10.1016/j.agwat.2011.02.002
Marin, F. R.; Angelocci, L. R.; Righi, E. Z.; Sentelhas, P. C. Evapotranspiration and irrigation requirements of a coffee plantation in southern Brazil. Experimental Agriculture, v.41, p.187-197, 2005. https://doi.org/10.1017/S0014479704002480 Ramírez, A. J. F.; Coelho, R. D.; Pizani, M. A. M.; Silva, C. J. da.
Determinação do índice de estresse hídrico em tomateiros cereja (Lycopersicum Solanum var. Cerasiforme.) com câmara infravermelha. Revista Brasileira de Agricultura Irrigada, v.9, p.218-224, 2015. https://doi.org/10.7127/rbai.v9n400356 Sezen, S. M.; Yazar, A.; Dasgan, Y.; Yucel, S.; Akyildiz, A.; Tekin, S.;
Akhoundnejad, Y. Evaluation of crop water stress index (CWSI) for red pepper with drip and furrow irrigation under varying irrigation regimes. Agricultural Water Management, v.143, p.59-70, 2014. https://doi.org/10.1016/j.agwat.2014.06.008