Análise Acústica das Vogais do Pirahã
Fernando O. de Carvalho
Universidade Federal do Rio de Janeiro Universidade Federal do Rio de JaneiroUniversidade Federal do Rio de Janeiro Universidade Federal do Rio de Janeiro Universidade Federal do Rio de Janeiro Universidade de Brasília Universidade de Brasília Universidade de Brasília Universidade de Brasília Universidade de Brasília
Resumo
Os resultados de uma investigação preliminar acerca das propriedades acústicas das vogais da lingual Pirahã são apresentados. Por meio de representações gráficas e escores numéricos, as características do espaço vocálico da lingua são expressas em termos das dimensões padrão de F1, F2, F1-F0 e F2-F1 assim como em termos de medidas centrais de valores transformados para a escala Bark. Padrões de diferenças sexuais são avaliados tanto para as distribuições de valores de formantes quanto para os dados relativos ao pitch intrínseco das vogais. Neste ultimo conjunto de dados, um resultado não esperado é apresentado e discutido.
Palavras-chave
Vogais, Pirahã , Acústica , Pitch Intrínseco.
Abstract
The results of a preliminary investigation of Pirahã vowel acoustics are reported. Properties of the language’s vowel space are shown in numerical and graphic representations, couched in terms of the standard dimensions of F1, F2 and F2-F1, F1-F0, as well as in terms of averages of Bark-transformed values. These properties include dispersion, clustering and patterns of sex-difference. Pitch measurements are also provided, with a somewhat unexpected and sex-specific pattern of intrinsic pitch being found and subject to discussion and analysis.
Keywords
T
0. Introduction 0. Introduction0. Introduction 0. Introduction 0. Introduction
he singularities of the class of phonetic events generally referred to as ‘vowels’, as opposed to consonants, have always attracted the attention of linguists (LINDBLOM, 1986; LINDAU, 1978) and speech scientists and psycholinguists alike (CHIBA; KAJIAMA, 1941; TORO et al, 2008). It is true, then, that the study of vowels from a typological standpoint, and especially as it relates to the description of endangered and poorly described languages (LADEFOGED; EVERETT, 1996) carries much weight in the ultimate task of understanding the status of vowels in human language.
In the present work we provide a preliminary analysis of vowel properties in the Pirahã language.
1. The Pirahã language 1. The Pirahã language1. The Pirahã language 1. The Pirahã language 1. The Pirahã language
The Pirahã language belongs to the Mura (or Múra) linguistic family and is spoken by a few hundred individuals living along the Maici river, in the state of Amazonas, Brazil. The language has been alternatively called Mura (e.g., MADDIESON, 1986 , p. 107) or Mura-Pirahã (EVERETT, 1986). We follow Everett (1986) in using Pirahã as a reference to the sole living language of the family named Mura.
The Pirahã language has been the focus of quite intense debate lately, the ultimate source of dispute being claims by linguist D. Everett that the language’s grammar is peculiar in ways that have far-reaching consequences for mainstream grammatical theory (EVERETT, 2005). Some of the hotly debated points include the putative absence of syntactic embedding, the absence of color terms and the qualification of the language’s pronominal inventory as the simplest inventory known (for a lengthy discussion on these points, cf. NEVINS; PESETSKY; RODRIGUES, 2007; for Everett’s response cf. EVERETT, 2007).
The language’s phonology has also attracted a lot of attention, specially due to its small inventory of phonemes (3 vowels and 8 consonants), the existence of some phonetic rarities in its system of allophones (such as a double flap with the tongue tip hitting the alveolar ridge and the lower lip, thus coming out of the mouth; Everett (1982)), and because the language seems to have an onset-sensitive system of syllable weight assignment (EVERETT; EVERETT, 1984). Of particular concern to the present work, Everett (1986, p. 316) describes Pirahã vowels in the following way (using standard auditory-kynesthesic labels): “i mid-high front; a low close central; o mid-high close back rounded. i ranges freely over [ ì ], [ e ] , [ E ], [ i ]. o is realized as a high close back rounded [ u ] after h or k preceeding i. Elsewhere, it is a mid close back rounded. All vowels are optionally nasalized following x (glottal stop) or h”. In this sense, Pirahã stands along other three-vowel languages such as Amuesha and Alabaman in having / o/ instead of /u/ as its back vowel (cf. CROTHERS, 1978).
2. Aims and Methods 2. Aims and Methods2. Aims and Methods 2. Aims and Methods2. Aims and Methods
The primary aim of the present study is to provide information on the acoustics of vowels in the Pirahã language.
The data on which this study was based comprises part of the speech sound files on the Pirahã language homed at the website of the UCLA Phonetics Lab Archive (2007). The data used correspond to the first wordlist (see Appendix B) of the first two male speakers (Hixahoixoi and Xisao) and the first female speaker (Xiaapixoi). The recordings were made in June 26-28, 1995, by Peter Ladefoged, Daniel Everett, and Keren Everett, at the Pirahã settlement. The original recordings were made on a 48K DAT.
The archives were downloaded and then segmented into smaller files of the recorded tokens for each item in the wordlist. A total of 180 vowels were subject to analysis. It should be noted that, although far from ideal, the small number of sampled subjects in this preliminary study is, in no way, at variance with the norm in acoustic phonetic studies, as shown for example by the sample of studies reviewed by Whalen & Levitt (1994).
Acoustic analysis was carried with the Praat software (BOERSMA; WEENINCK, 2006). Formant and pitch values for vowels in the first syllable of each token were taken, with measurements obtained over the central portions
of steady state vowel segments. Formant estimation was carried on broad-band spectrograms using the default values of an LPC-based algorithm (default value: analysis window of 5 msc) except for the dynamic range (value used: 50.0 dB). The usual aid of visual inspection of spectrograms was also applied. The standard setting for the ‘maximum formant value’ was lowered from 5500 Hz to 4500 for the analysis of male speech. Mean pitch was estimated using the Praat algorithm, with a slight change in frequency range (Hz) to detect small pitch values in the vicinity of glottal stops (range used: 30 – 350 Hz). The domain corresponding to the central portion of the vowel (identified by checking steady-state formant patterns in spectrograms and periodic excitation in spectrograms and waveforms) was selected for the computation of mean pitch.
The statistical descriptive and exploratory analysis of the data was carried out on the SPSS 14.0 software.
2.1. Data Analysis 2.1. Data Analysis2.1. Data Analysis 2.1. Data Analysis 2.1. Data Analysis
No significance tests were run during data analysis for the present study. Although null-hypothesis significance testing (NHST) seems to have a major role in the data analytical tools of many studies on acoustic phonetics (e.g., OLSON; MIELKE, 2007; PICANÇO, 2005), it is simply not clear that they have been properly used or that they are anything but useless, even in areas where training with statistical techniques is far more widespread (cf. THOMPSON, 1998; WILKINSON et al., 1999).
As related to their proper use, the assumptions built into parametric tests (e.g., equal variances, normality) are seldom checked or the implications of deviations taken into account. Second, the “significance” of the results is often naïvely interpreted in a ‘vernacular sense’, as implying that ‘differences are considerable’. What is often missed altogether is that ‘alpha-level’ cutoff points for significance (usually .01 or .05) merely describe the probability of one having equal or more extreme results than those under analysis given the assumptions built into the model itself (the ‘null hypothesis’) which are usually known, in advance, to be false (COHEN, 1994; BAKAN, 1966). Calculated p values are always dependent on sample sizes, and in many respects if the aim of original research boils down to the quest for ‘significant results’, then one’s research may be reduced to the effort of collecting large amounts of data (BAKAN, 1966). It is not surprising then, that for a number of researchers (SCHMIDT, 1996;
WILKINSON et al, 1999) tests of statistical significance should be banned from publications or at least handled with greater care than usual.
One of the antidotes against the rash application of significance tests lies in an increased reliance on exploratory data analytical techniques (COHEN, 1994, p. 1001). This was the path taken in this preliminary work.
After the identification of outliers or extreme deviations from central tendency in the data for each formant, these cases were subject to acoustic re-analysis in order to look for mistakes in formant estimation or in writing down the results of the analyses. In case the correctness of the original measurements was confirmed, other causes for the divergent measurements were sought. The computation of Means and Standard Deviations was carried out only after the removal of outliers, since these are statistics which are highly sensitive to infrequent large deviations in data; however, some of the outliers are shown in the vowel spaces drawn in the next sections.
3. Results and Discussion 3. Results and Discussion3. Results and Discussion 3. Results and Discussion3. Results and Discussion
3.1. V 3.1. V3.1. V
3.1. V3.1. Vowel Spectra and Spectrogramsowel Spectra and Spectrogramsowel Spectra and Spectrogramsowel Spectra and Spectrogramsowel Spectra and Spectrograms
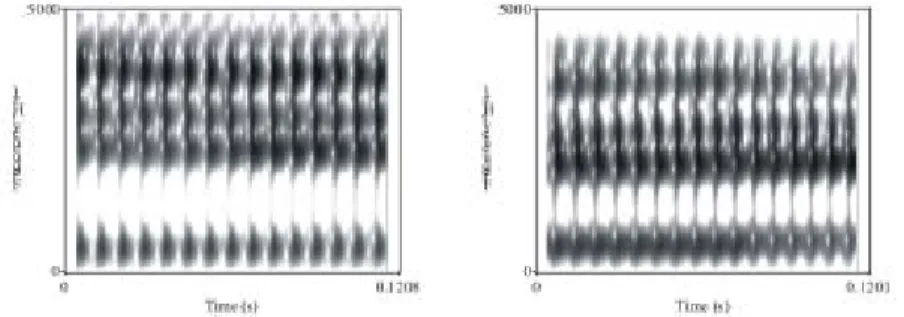
Sample spectra for each vowel category are provided in Appendix A. Spectrograms for tokens of the two vowels /i/ and /o/ are given below, showing the F2 difference between the more posterior /o/ (right side) and the more anterior /i/ (left side):
Sample spectrogram for a single token of vowel /a/:
FIGURE 2 - Spectrogram for token of vowel /a/. 3.2. V
3.2. V3.2. V 3.2. V
3.2. Vowel Spacesowel Spacesowel Spacesowel Spacesowel Spaces
In order to draw the vowel space for the Pirahã language as taken from our sample values, the values for the F2-F1 and F1-F0 differences were computed as speaker-independent measures of anterior/posterior position and openness, respectively (Ladefoged & Maddieson (1990), Traunmüller(1981)). The vowel space is presented in figure 3 below:
FIGURE 3 - Vowel space for Pirahã language over studied sample (F2-F1 x F1-F0); (× /i/ , ο /a/ , Δ /o/).
Many researchers, employing different measurement scales and dispersion metrics, have found that among the so-called “point vowels” the token space for /i/ tends to be much more tightly-clustered (or less dispersed) than those of either /a/ or /u/ (cf. GENDROT; ADDA-DECKER, 2007; AL-TAMIMI; FERRAGNE, 2005). Preliminary visual inspection of the vowel space above seems to suggest that this is also the case in Pirahã. Intra-vowel Standard Deviations were computed over raw F1 and F2 values after the identification and elimination of extreme outliers in a first-step graphical exploratory analysis (summing a total of three tokens). The S.D. values are displayed below:
TABLE 1
Standard-deviations for each formant dimension
F1/i/ F2/i/ F1/a/ F2/a/ F1/o/ F2/o/
S.D. 83,735 148,911 155,536 221,818 77,836 179,724 The values confirm that, for F2 at least, /i/ seems to be acoustically more stable. The token space for /o/ is the least variable in the F1 dimension. An adequate comparison with other studies is, however, not warranted in this preliminary work, since only a quite restricted set of prosodic and segmental contexts have been targeted in the present study.
Another interesting feature displayed by the vowel space above is the clustering of both /o/ and /a/ in the back portion of the vowel space. One of the generalizations emerging from Crother’s sample of vowel systems states that height distinctions tend to be more important cross-linguistically to front vowels (CROTHERS, 1978, p. 122). The Pirahã vowel space, at least as depicted above clearly stands outside this generalization, height being more important to set /a/ and /o/ tokens apart from each other; indeed, the tight space along the F1 dimension over which /o/ tokens spread may be an effect of this vowel’s underlying specification for this feature (KEATING, 1990). The same data is displayed below in the more usual F1 x F2 space (PETERSON; BARNEY, 1952). This representation has the additional advantage of being more useful for cross-linguistic comparisons, since much work in acoustic phonetics employs these parameters for the description of vowel spaces (e.g., CROWHURST, 2002; ANSARIN, 2004; OLSON; MIELKE, 2007).
FIGURE 4 - F1 x F2 vowel space derived from sample tokens (× /i/ , ο /a/, Δ /o/). Here, the auditory impression that /a/ is pretty much centralized is confirmed (cf. section 1). An extremely posterior F2 value for a token of /i/ was found in the data (the first vowel in the word igiai as spoken by the second male informant). As the item is heard in the recordings, it seems that hypoarticulation (LINDBLOM, 1990) is a good explanation for the pattern observed. Tokens of /o/ were found to be closer to [u] after [h] (especially marked by a strong reduction of F1) and after [k] (with a stronger reduction of F2, consistent with rounding). Some outlying tokens of /o/ with too high F2 values, well within the range for /i/ tokens, were identified. During acoustic re-analysis, it was found that the original formant measurements were made too close to vowel onset which, in the case of the item hoopogi, meant that the vowel was slightly nasalized close to [h], as asserted by Everett (1986). This is problematic, given that the LPC-based formant estimation tool used is not adequate, in its standard values, for the analysis of nasalized vowels. Another high-F2 outlying vowel was taken from the center portion of koo’io. Everett describes vowels as being optionally nasalized after glottal stops but, in this token at least, the vowel seems to be partially nasalized before a glottal stop.
It is interesting to note that the place occupied by /a/ tokens lies much more back when information on pitch (F0) is added. This is significant from the perspective of models and hypotheses which claim that pitch information may have a role in enhancing vowel distinctiveness (DIEHL; KLUENDER, 1989; KINGSTON, 1993; HOMBERT, 1977).
The size or overall dispersion of the Pirahã vowel space was computed by adding the Euclidean distances between the mean Bark values for each of its three vowels. As a first step, formant values in Hz were converted into the psychoacoustic Bark scale using the expressions given in Traunmüller (1990) (where Z stands for value in Bark, F for value in Hertz):
Z = [26.81 F / (1960 + F)] – 0.53 (1)
The formula has an added correction factor for values of Z < 2.0:
Z’ = Z + 0.15 (2 – Z) (2)
The two dimensional Euclidean distances in Bark between the mean values for adjacent vowels are given below:
TABLE 2
Euclidean distances between mean values for adjacent vowels /i/ - /o/ /o/ - /a/ /a/ - /i/
D 5,47 3,74 3,86
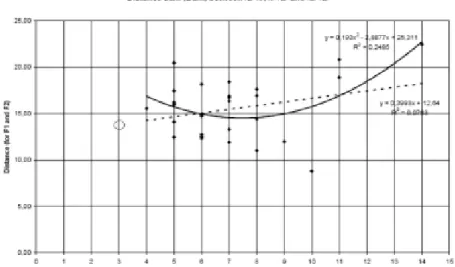
When added to serve as a measure of vowel space dispersion and compared with the values derived from a study of an independent sample of 28 languages (LIVIJN, 2000), the data from Pirahã provide no evidence for a size-dependent effect on the dispersion of vowel spaces: the value of 13.07 resulting from a sum of the Bark values in the table above is well above the values reported for some languages with 8 or 10 vowels. Our analysis thus supports Livijn’s conclusion that no direct effect of inventory size on the acoustic dispersion of point vowels can be detected. In appendix C, we show the plot with the values of the dispersion measure as a function of inventory size with approximate place of Pirahã signaled with a colored circle.
Weitzman (1992, p. 123) suggested that if one were to find pairs of vowels differing by less than one critical band (approximated by one Bark) then one would have good reasons to suppose that other factors beyond perceptually-transformed spectral peak values (e.g., pitch, duration) play a role in vowel discrimination. Our data on distances between Z values for the means of each vowel category in Pirahã are compatible with the idea that information present in spectral peaks is sufficient to support vowel discrimination in the contexts sampled by our preliminary study. The same conclusion could be foreshadowed by the presentation of figure 4 displaying the language’s vowel space based on F1 and F2 measurements.
We analyzed the extreme values for the pooled F1 and F2 distributions in an attempt to uncover the effect of particular phonetic and phonological contextual variables. One interesting pattern which arose from the data is that for tokens of /a/, the largest values for F1 and the smallest values for F2 were attained in long vowels. A similar, but not equal pattern was found for /i/: the largest F1 values and the largest F2 values were all taken from long vowels.
Sex-differences in vowel spaces have been reported for a number of different languages (HENTON, 1995; DIEHL et al., 1996; SIMPSON; ERICSDOTTER, 2007). As becomes evident after visual inspection of the F1 x F2 vowel spaces below, the general pattern having females with larger vowel spaces than males holds of Pirahã too. This impression is confirmed by an analysis of the mean/median formant values for the three speakers presented in the table after the graph (the unique exception being the values for F2 /a/ which are higher for male speaker 2 than for the female speaker):
FIGURE 5 - F1xF2 vowel spaces for each speaker (× /i/ , ο /a/, Δ /o/). TABLE 3
Mean/median formant values for each speaker and the pooled means/medians
F1/i/ F2/i/ F1/a/ F2/a/ F1/o/ F2/o/
Male Speaker 1 373/378 2268/2243 801/812 1521/1509 460/466 893/912 Male Speaker 2 394/387 2357/2368 697/700 1912/1882 492/484 1115/1092 Female Speaker 1 518/577 2550/2544 1035/1031 1616/1605 568/571 1010/977 Pooled 421/392 2360/2391 801/676 1663/1691 514/509 1139/1029
Vowel spaces based on mean Bark values for each speaker are given below:
FIGURE 6 - Mean formant values (F2xF1) expressed in Bark (Critical Band) scale. (× /i/ , ο /a/, Δ /o/).
As cross-linguistic evidence shows, the reported sex-differences in vowel spaces display interesting language-internal non-uniformities. Not only the magnitudes of the differences are subject to cross-linguistic variation, but distinct vowels are differentially affected (HENTON, 1995). We display below the (non-transformed) Euclidean distances between mean formant values for the male (pooled mean for the two subjects) and the female means:
TABLE 4
Non-transformed Euclidean Distances between mean formant values for males and the female subject
F1/a/ F2/a/ F1/i/ F2/i/ F1/o/ F2/o/
D 288 40 129 222 74 15
The data display in a quite direct manner a pattern similar to that found in other languages: the difference between male and female vowel spaces tends to increase as formant values increase. That is, the F1 difference is larger for more open vowels and the F2 difference is larger for more fronted vowels (cf., e.g., SIMPSON; ERICSDOTTER, 2007).
3.3. V 3.3. V3.3. V
3.3. V3.3. Vowel Pitchowel Pitchowel Pitchowel Pitchowel Pitch
As a general typological trend, high vowels have higher pitches than low vowels, even in languages that use variations in vocoid segmental phonatory state for linguistic or grammatical purposes, such as lexical tone languages or pitch-accent languages (LEHISTE, 1970; WHALEN; LEVITT, 1995; VERHOEVEN; Van HOOF, 2007). It may be the case that the correlation between pitch and vowel height works as a redundant cue to vowel height (HOMBERT, 1977).
Variation as a function of sex is of course well documented and obvious to anyone: women’s speech is on the average higher pitched than men’s speech (DIEHL et al., 1996; TRAUNMÜLLER; ERIKSSON, 1995) even in peculiar speech registers such as baby-talk. Differently from the intrinsic pitch of vowels, the physiological bases for this sex effect are relatively well understood (TITZE, 1989).
In Pirahã, we have found, as predicted, that the mean (and the median) pitch values for our female speaker are well above those for the two male speakers. Also the range of variation in the pitch realizations is larger for the female speaker when compared to males (cf. table 5 below).
TABLE 5
Average Mean Pitch values for each speaker as a function of vowel type (mean/median (range)).
/a/ /i/ /o/
Male 1 135/134 (36) 138/136 (32) 134/136 (52) Male 2 123/121 (44) 127/123 (64) 126/121 (47) Female 218/210 (72) 246/239 (101) 193/202 (112)
Both the higher average values and the larger ranges in pitch realizations for women when compared to men are attested in a number of distinct languages (TRAUNMÜLLER; ERIKSSON, 1995; SIMPSON; ERICSDOTTER, 2007).
The mean pitch values for the language are given below: TABLE 6
Average Mean Pitch for each vowel category (mean/median (range)).
/a/ /i/ /o/
150/134 (157) 160/144 (204) 147/136 (122)
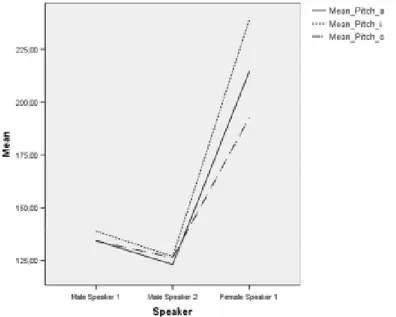
When the mean pitch values for the three speakers were graphically displayed, an interesting pattern concerning intrinsic pitch arose: in both male speakers the mean pitch value for /o/ is higher than that for /a/ (although less so in male speaker 2) but the pattern is reversed in the female speaker, where /a/ has a mean pitch well above that of /o/:
FIGURE 7 - Line graph of variation in mean pitch (Hz) for each vowel as a function of speaker
We can imagine a few explanations for this pattern. First of all, this could be an artifact brought about by messy data: the inflation of the mean pitch for / a/ in the female speaker could be the result of a disproportionate amount of high-end outliers in the female sample. Although the data for the /a/ vowel of the female speaker is positively skewed, it is not more than that of the first male speaker (skewness of 1,246 for female; 2,121 for male speaker 1). Also, the distribution of /a/ values for the female has a kurtosis value close to zero (,414) while the two male speakers have higher positive values (4,901 for male speaker 1; 1,381 for male speaker 2). This means that the female distribution is not affected to a greater extent by infrequent extreme deviations when compared to the male distributions. When all outliers and extreme values were removed, the difference, albeit diminished, remained in the same direction: /a/ still had a mean pitch higher than that of /o/ for the female speaker (/a/: 208 ; /o/: 204).
A second, if more interesting hypothesis, appeals to the non-linear representation of the physical frequency-space (measured in Hertz) in terms of psychoacoustic scales (measured in Critical Bands, for example). That is, when
displayed in terms of the “perceptually-real” topography of scales that describe how the properties of physical stimuli are encoded in the auditory systems of speakers-hearers, the differences may turn out to align themselves with the theoretically predicted patterns of intrinsic pitch variation. Much to our surprise, the representation of the mean values in terms of the critical band Bark scale actually increased the separation between /o/ and /a/ means in female speech. The differences between the two male speakers were, on the other hand, almost completely diluted:
FIGURE 8 - Line graph showing interindividual variation in Bark-scaled mean pitch values for each vowel
A third hypothesis which assigns these unexpected patterns to the uncontrolled action of lexical (underlying) pitches seems unlikely. This could be the case if the speech samples for each speaker were selectively and differentially affected by a disproportionate presence of, say, low pitched tokens of /o/ or high pitched tokens of /a/. But it seems that this is not the case, since as reported in the Methods section, the samples for all three speakers correspond to the same list of lexical items.
Based on our discussion on perceptually-based distances in the previous section, it could be the case that the female speaker enlarges the mean pitch difference between the realization of /a/ and /o/ in order to compensate for poor discrimination based solely on formant frequencies (cf. VERHOEVEN; Van HOOF, 2007). This would explain a larger difference in mean pitch in the female as opposed to the male speakers, but not the fact that /a/ has a higher mean pitch than /o/. However, the female distance in Barks between the mean Z values for /o/ and /a/ scores 4,24, i.e., more than 4 critical bands.
On a tentative basis, we resort to the position that these patterns may be due to uncontrolled variation in speech clarity during elicitation (cf. e.g., MADDIESON, 2006). Control for this sort of independent variable is always required and more easily attained in experimental settings; when doing fieldwork among a mainly monolingual community outside the lab this sort of control is hardly a realistic goal. In principle, it may be the case that co-variations among phonetic features (articulatory and/or acoustic) may hold only of ‘clear’ speech but not in hypo-articulated or ‘reduced’ utterances. As it happens, the speech of Pirahã women in the UCLA archive sample was felt to be pretty much hypo-articulated, as if the informants were mainly ‘uninterested’ or simply (and understandably) unwilling to produce speech at normal or more paced articulatory rates.
As it stands, the question of the intrinsic pitch of vowels in Pirahã deserves further study.
4. Conclusion 4. Conclusion4. Conclusion 4. Conclusion4. Conclusion
This work gave a preliminary exposition of patterns concerning the acoustic and perceptual organization of vowels in the Pirahã language. The statement of these patterns was approached a typological vein, comparing in them to more general cross-linguistic findings. We hope that much of the present investigation stands as a plea for a more accurate and thorough investigation of Pirahã phonetics, which constitutes an unavoidable step towards a deeper understanding the way this language organizes sound structure.
References ReferencesReferences References References
AL-TAMIMI, J.- E.; FERRAGNE, E. Does Vowel Space Size Depend on Language Vowel Inventories? Evidence from Two Arabic Dialects and French. Proceedings
of Interspeech’ 2005, 2465-2468, 2005.
ANSARIN, A. A. An Acoustic Analysis of Modern Persian Vowels. SPECOM’ 2004:
9th Conference Speech and Computer, St. Petersburg, Russia, September 20-22,
2004. No page numbering. Available at: http://www.isca-speech.org/archive. BAKAN, D. The Test of Significance in Psychological Research. Psychological Bulletin 66 (6): 423-437, 1996.
BOERSMA, P.; WEENINCK, D. PRAAT. Doing Phonetics by Computer. www.praat.org, 2006.
CHIBA, T.; KAJIYAMA, M. The Vowel: Its Nature and Structure. Tokyo-Kaiseikan, Tokyo, 1941.
COHEN, J. The Earth is Round (p < .05). American Psychologist 49 (12): 997-1003, 1994.
CROTHERS, J. Typology and Universals of Vowel Systems. In: Greenberg, J. (ed.) Universals of Human Language, Vol. 2: Phonology. 93-152. Stanford University Press, 1978.
CROWHURST, M. Un Intercambio de Vocales Altas en el Sirionó (Tupí-Guaraní).
Liames 2: 7-29, 2002.
DIEHL, R.; KLUENDER, K. On the Objects of Speech Perception. Ecological
Psychology 1: 121-144, 1989.
DIEHL, R.; LINDBLOM, B; HOEMEKE, K.; FAHEY, R. On Explaining Certain Male-Female Differences in the Phonetic Realization of Vowel Categories. Journal
of Phonetics 24: 187-208, 1996.
EVERETT, D. Phonetic Rarities in Pirahã. Journal of the International Phonetic
Association, December. 94-96, 1982.
EVERETT, D. Pirahã; in: Derbyshire, R. & G. K. Pullum, Handbook of Amazonian Languages. Vol.1., pp. 200-325. Mouton de Gruyter, The Hague, 1986.
EVERETT, D. Cultural Constraints on Grammar and Cognition in Pirahã. Current
Anthropology 46 (4); 621-646, 2005.
EVERETT, D. Cultural Constraints on Grammar in Pirahã: A Reply to Nevins, Pesetsky and Rodrigues. http://ling.auf.net/lingBuzz/000427, 2007.
EVERETT, D.; EVERETT, K. On the Relevance of Syllable Onsets to Stress Placement. Linguistic Inquiry 15: 705-711, 1984.
GENDROT, C.; ADDA-DECKER, M. Impact of Duration and Vowel Inventory Size on Formant Values of Oral Vowels. Proceedings of the XVIth International
Congress of Phonetic Sciences, p.1417-1420, Saarbrücken, 2007.
HENTON, C. Cross-Language Variation in the Vowels of Male and Female Speakers.
Proc. XIIIth ICPhS Vol. 4, 420-423, 1995.
HOMBERT, J.-M. Development of Tones from Vowel Height. Journal of Phonetics 5: 9-16, 1977.
KEATING, P. The Window Model of Coarticulation: Articulatory Evidence; in Kingston, J. & M. Beckman, Papers in Laboratory Phonology I: Between the
Grammar and the Physics of Speech, pp.451-470. Cambridge University Press, 1990.
KINGSTON, J. The Phonetics and Phonology of Perceptually Motivated Articulatory Covariation. Language and Speech 35: 99-113, 1993.
LADEFOGED, P.; MADDIESON, I. Vowels in the World’s Languages. Journal
of Phonetics 18: 93-122, 1990.
LADEFOGED, P.; EVERETT, D. The Status of Phonetic Rarities. Language 72 (4): 794-800, 1996.
LEHISTE, I. Suprasegmentals. MIT Press, Cambridge, 1970. LINDAU, M. Vowel Features. Language 54 (3): 541-563, 1978.
LINDBLOM, B. Phonetic Universals in Vowel Systems; in Ohala, J & Jaeger (eds.) Experimental phonology, pp.13-44. Academic Press, San Diego, 1986. LINDBLOM, B. Explaining Phonetic Variation: A Sketch of the H&H Theory; in Hardcastle, Marchal (eds.) Speech production and speech modeling, pp. 403-439. Kluwer Academic, Dordrecht, 1990.
LIVJIN, P. Acoustic Distribution of Vowels in Differently Sized Inventories – Hot Spots or Adaptive Dispersion?. XIIIth Swedish Phonetics Conference Proceedings,
p. 93-96. Skövde, Sweden, 2000.
MADDIESON, I. The Size and Structure of Phonological Inventories: Analysis of UPSID; in Ohala, J & Jaeger (eds.) Experimental phonology, pp. 105-123. Academic Press, San Diego, 1986.
MADDIESON, I.Variation in Co-Variation: The Search for Explanatory Principles.
LabPhon 10. No page numbering, 2006.
NEVINS, A.; PESETSKY, D.; RODRIGUES, C. Pirahã Exceptionality: A Reassessment. http://ling.auf.net/lingBuzz/000411, 2007.
OLSON, K.; MIELKE, J. Acoustic Properties of the Kagayanen Vowel Space.
Proceedings of the XVIth International Congress of Phonetic Sciences. Saarbrücken,
845-848, 2007.
PETERSON, G.; BARNEY, H. Control Methods Used in the Study of Vowels. Journal
of the Acoustical Society of America 24: 175-184, 1952.
PICANÇO, G. Mundurukú: Phonetics, Phonology, Synchrony, Diachrony. Doctoral Thesis, University of British Columbia, 2005.
SCHMIDT, F. Statistical Significance Testing and Cumulative Knowledge in Psychology: Implications for the Training of Researchers. Psychological Methods 1: 115-129, 1996.
SIMPSON, A.; ERICSDOTTER, C. Sex-Specific Differences in f0 and Vowel Space. Proceedings of the XVIth international congress of phonetic sciences. No page numbers, 2007.
THOMPSON, B. Statistical Significance and Effect Size Reporting: Portrait of a Possible Future. Research in the Schools 5 (2): 33-38, 1998.
TORO, J., NESPOR, M., MEHLER, J. & BONATTI, L. Finding Words and Rules in a Speech Stream: Functional Differences Between Vowels and Consonants.
Psychological Science 19 (2): 137-144, 2008.
TRAUNMÜLLER, H. Perceptual Dimension of Openness in Vowels. Journal of
the Acoustical Society of America 69: 1465-1475, 1981.
TRAUNMÜLLER, H. Analytical Expressions for the Tonotopic Sensory Scale.
Journal of the Acoustical Society of America 88: 97-100, 1990.
TRAUNMÜLLER, H.; ERIKSSON, A. The Frequency Range of the Voice Fundamental in the Speech of Male and Female Adults. Manuscript, 1995. UCLA Phonetic Lab Archive. Los Angeles, CA: UCLA Department of Linguistics. http://archive.phonetics.ucla.edu/, 2007.
VERHOEVEN, J.; VAN HOOF, S. Intrinsic Vowel Pitch in Dutch and Arabic.
Proceedings of the XVI ICPhS, p. 1785-1788, 2007.
WEITZMAN, R. Vowel Categorization and the Critical Band. Language and Speech 35: 115 – 125, 1992.
WHALEN, D.; LEVITT, A. The universality of Intrinsic F0 of Vowels. Haskins
laboratories status report on speech research, SR-117/118, pp.1-14, 1994.
WILKINSON, L.; TASK FORCE ON STATISTICAL INFERENCE. Statistical Methods in Psychology Journals. American Psychologist 54 (8): 594-604, 1999.
Appendix A Appendix AAppendix A Appendix AAppendix A
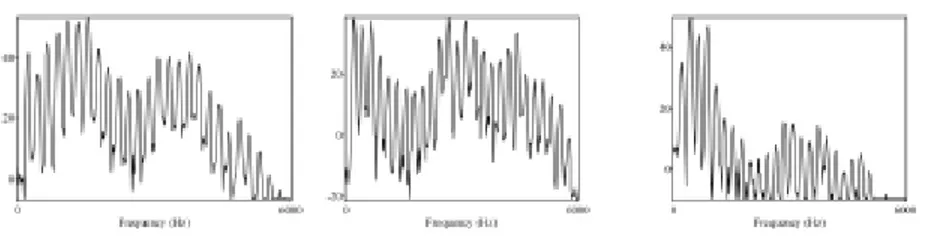
FIGURE 9 - Sample spectra for the three Pirahã vowel categories (from left to right: /a/, /i/, /o/.
Appendix B Appendix B Appendix B Appendix B Appendix B 1. tii ‘residue’ 2. ‘ii ‘wood/thing’ 3. bii ‘blood’ 4. gíiso ‘this’
5. ‘ísiisí ‘fat/body oil’ 6. hiisí ‘sun’
7. paahóisi ‘ palm frond’ 8. taahoasi ‘sand’ 9. kaa’ai ‘macaw’ 10. ‘áapahai ‘bird arrow’ 11. báagisó ‘many’ 12. gáatahaí ‘can’ (noun) 13. ‘ísaahái ‘candle’ 14. poogahai ‘arrow’ 15. toogi’i ‘hoe’ 16. koó’io ‘inside’ 17. xopóogi ‘Ingá’ (fruit) 18. boopai ‘throat/neck’ 19. goó ‘what’s up’ 20. ‘isoobái ‘down’ (noun) 21. pibaói ‘otter’ 22. tigaiti ‘bushmastersnake’ 23. ‘igíai ‘OK’ 24. bigí ‘earth’ 25. ‘ísibíoí ‘liver’ 26. hí’í ‘rat’ 27. pá’ai ‘fish’ 28. tagasága ‘machete’ 29. ‘agíi ‘cold’ 30. bágiái ‘thief’ 31. gagáia ‘orange’ 32. ‘isapaí ‘animal head’ 33. po’o’oi ‘small anteater’ 34. tokaaga ‘tocandeira ant’ 35. kosi ‘eye’
36. ‘ogií ‘big’ 37. bogí ‘hat’ 38. gogíi ‘what’s up’ 39. ‘isopói ‘claw’ 40. bogí ‘breast’ 41. ti ‘1st pers. Sg. 42. bíigió ‘underground’ 43. kaba ‘not/no’ 43. kaábi ‘full’
Appendix C Appendix CAppendix C Appendix CAppendix C
FIGURE 10 - Plot of acoustic distance among point vowels (ordinate) as a function of inventory size (abscissa) for 28 languages taken from Livijn (2000). The colored
circle shows the approximate location of Pirahã, following the computation of the same dispersion measure presented here.