Licenciado sob uma Licença Creative Commons DOI: http://dx.doi.org/10.1590/1980-5918.030.003.AO09
Analysis of agreement between peak expiratory flow
meters and comparison of reference values
Análise da concordância entre aparelhos de pico de luxo
expiratório e comparação dos valores de referência
Daniela Ike[a], Claudia Eliane Cordeiro Bueno[b], Jorge Cutlac Neto[c], Bruna Varanda Pessoa-Santos[d], Mauricio Jamami[a]*
[a] Universidade Federal de São Carlos (UFSCar), São Carlos, SP, Brazil [b] Faculdade Anhanguera de Piracicaba, Piracicaba, SP, Brazil
[c] Universidade Federal do Triângulo Mineiro (UFTM), Uberaba, MG, Brazil [d] Universidade Sagrado Coração (USC), Bauru, SP, Brazil
[R] Abstract
Introduction: The peak expiratory flow (PEF) is a practical method that evaluates the caliber of the proxi
-mal airways. The ease in handling and the low cost of portable PEF meters made their use frequent. However, few studies have examined the correlation between the different equipment and compared their reference values. Objective: Analyze the correlation of three portable meters of PEF and check if the reference values
are applicable in the studied population. Methods: 168 healthy individuals, of both genders, ranging in
age from 20 to 80 years, had their PEF measured in Mini-Wright®, Assess® and AirZone® and the values obtained were compared to those predicted by Leiner et al. (1963) and Nunn and Gregg (1989). Statistical analysis was performed by the Kolmogorov-Smirnov tests, ANOVA, Wilcoxon test, Spearman correlation and analysis of agreement of Bland-Altman (p< 0.05). Results: There was significant difference in the values of
PEF obtained between the Mini-Wright® and Assess® meters in both genders, between the AirZone® and
* DI: PhD, e-mail: [email protected]
CECB: BS, e-mail: [email protected] JCN: BS, e-mail: [email protected]
Assess® only in men and between the Mini-Wright® and AirZone® only in women. The predicted values in the three meters have overestimated the obtained in both genders; there was no correlation between the values obtained from three meters due to the great variation of agreement limits and large interindividual variation. Conclusion: The values obtained in the three meters are not interchangeable and the predicted
values were unsuitable for the sample.
Keywords: Peak Expiratory Flow. Reference Values. Respiratory Function Tests. Physiotherapy.
Resumo
Introdução: O pico de fluxo expiratório (PFE) é um método acessível que avalia o calibre das vias aéreas pro -ximais. A facilidade no manuseio e o baixo custo dos medidores portáteis de PFE tornaram seu uso frequente, entretanto, poucos estudos analisaram a concordância entre os diferentes equipamentos e compararam seus valores de referência. Objetivo: Analisar a concordância de três medidores portáteis de PFE e verificar se os
valores de referência são aplicáveis na população estudada. Métodos: 168 indivíduos saudáveis, de ambos os
gêneros, na faixa etária de 20 a 80 anos, realizaram medidas de PFE nos aparelhos Mini-Wright®, Assess® e AirZone® e comparou-se os valores obtidos aos previstos por Leiner et al. (1963) e Nunn e Gregg (1989). A análise estatística foi realizada pelos testes Kolmogorov-Smirnov, ANOVA, teste de Wilcoxon, correlação de Spearman e análise de concordância de Bland-Altman (p<0,05). Resultados: Constatou-se diferença signifi -cativa nos valores de PFE obt idos entre os medidores Mini-Wright® e Assess® em ambos os gêneros, entre o AirZone® e o Assess® apenas nos homens e entre o Mini-Wright® e o AirZone® somente nas mulheres, sendo que os valores previstos nos três aparelhos superestimaram os obtidos em ambos os gêneros; não se verificou concordância entre os valores obtidos dos três medidores devido à grande variação dos limites de concordância e grande variação interindividual. Conclusão: Os valores obtidos nos três medidores não são intercambiáveis
e os valores previstos se mostraram inadequados para a amostra estudada.
Palavras-chave: Pico do Fluxo Expiratório. Valores de Referência. Testes de Função Respiratória.
Fisioterapia.
Introduction
Peak expiratory flow (PEF) is an instantaneous air stream, approximately 20% of the forced vital capac
-ity, corresponding mainly to the bronchial airflow, being too small the contribution of the small airways. The PEF, which has important effort-dependent com
-ponent, is determined by the volume and elasticity of the lungs, by dimension and compliance of central intrathoracic airways and the strength and speed of contraction of expiratory muscles (1).
The PEF evaluates the strength and speed of the air inside the lungs, detects the narrowing of the air
-ways and can be useful to monitor asthma, classify its severity and evaluate the response to treatment (2, 3).
Compared to the spirometry, PEF requires only the completion of maximum inspiration followed by
maximum and forced expiration, and does not re
-quire a lot of training and experience to be handled (4). Although not recommended for the diagnosis of airflow obstruction (5, 6), recent studies suggest that measures of PEF can be a handy method of screening and initial identification of severe cases of chronic ob
-structive pulmonary disease (COPD) for subsequent confirmation by spirometry (7, 8).
Currently, the portable PEF meters have been widely used due to its low cost and ease of handling, however there is a wide variety of equipment and few studies examining the correlation between the different devices. Much of the literature studies compared the values obtained from different me
The criteria for inclusion in the study were: non or former smokers (10 years of smoking cessation); sed
-entary or insufficiently active (not performed any kind of exercise at least three times a week for 20 minutes, according to recommendations from the American College of Sports Medicine (15); body mass index (BMI)< 30 kg/m2; absence of neurological diseases,
respiratory and/or temporomandibular joint disor
-ders (information collected according to the account of the patients during the evaluation) that could affect the values of PEF; absence of inflammation of the up
-per airways in the last 14 days; those who -perform properly the maneuvers for getting the values of PEF.
The volunteers were invited to participate in the
study through outreach in posters, radio and internet,
and the researchers performed the evaluation “in loco” at events and health fairs. All volunteers re -ceived orientation and explanation regarding the
pro-cedures of the study and signed an Informed Consent Form, in accordance with determinations from the Resolution 466/12, from the National Health Council, after approval of the Ethics on Research Committee of the institution (statement 13.222/2012).
Experimental Procedure
Initially, an assessment was performed to collect personal data, anthropometric data (body mass, height, body mass index-BMI), life habits, personal and family pathological antecedents. Later, the vol
-unteers were instructed on the handling of the me
-ters and measures of PEF were made at random (the order of devices was determined by the examiner drawing envelopes), in Mini-Wright®, Assess® and
AirZone®, new and factory-calibrated devices, re
-specting the limit of 200 blows on each device (16). With the volunteer standing (17) and with the head positioned on the midline, without the use of nasal clip (18), was requested a maximum forced and fast expiration assuming maximum lung volume (Total lung capacity), advising him not to flex the neck or obstruct the nozzle with the tongue during forced expiration (19). During the maneuver, the volunteers received a standardized verbal command from a trained researcher. A pause of 30 seconds between each measure was given to prevent the respiratory muscle fatigue (19). Were considered three reproduc
-ible maneuvers, however, if the two highest values of three measures presented difference greater than 40 be derived from spirometry, because both methods
are not comparable.
For appropriate interpretation of results, it is nec
-essary to use reference values that are representative of the studied population, since such values differ from one population to another, or even between different regions of a country, considering anthro
-pometric differences, cultural habits, socioeconomic levels, climatic conditions and nutritional status (2).
Generally, portable equipment come with a spe
-cific reference equation, which often does not corre
-spond to the studied population. In the case of meters used in this study, the equations were established from North American (12) and European populations (13). Studies comparing the values obtained from different populations (2, 4, 14) to those predicted by the equation of Nunn and Gregg (13) found significant difference and the values obtained were lower than those predicted by these authors.
Considering that the measure of the PEF is use
-ful in respiratory physiotherapy clinical practice, the choice of equipment, as well as of appropriate refer
-ence values, is essential for the correct interpretation of the results. However, few studies have compared the correlation between the different equipment and evaluated the applicability of the equations of Leiner et al. (12) and (13) and Gregg Nunn in the Brazilian population.
Therefore, the aim of this study was to compare the values obtained and analyze the agreement of three portable PEF meters, beyond checks if the ref
-erence values that accompany these devices are ap
-plicable for a sample of adults from three cities in the Southeast region of Brazil. The hypothesis is that there are differences between the values obtained with three meters of PEF and also in the compari
-son of values obtained with those predicted by the equations, since they were derived from popula
-tions with characteristics that are different from the Brazilian population.
Methods
Sample
L/min, two additional measures were carried out, be
-ing five maneuvers the established limit. The highest value obtained was registered for data analysis (19).
The values obtained in each one of the devices were compared to those predicted in accordance with the reference table that accompanies each equip
-ment: Mini-Wright® (12), AirZone® (12), Assess®(13).
Statistical analysis
First, the Kolmogorov-Smirnov test for normality were applied. Then, the ANOVA test for repeated mea
-sures with post hoc Bonferroni correction was used for comparison of values obtained in different equip
-ments; and, for comparison of the values obtained with those predicted, the Wilcoxon test was applied, as well as the Spearman correlation. The programs used were SPSS version 17.0 (SPSS Inc., Chicago, IL,
USA), and the Graph Pad Instat®, version 3.5 (Graph
Pad Software Inc.).
The graphic analysis of Bland-Altman was used to determine the agreement between the different equip
-ment of PEF (20). The program used was the MedCalc, version 9.4.1.0 (MedCalc, Mariakerke, Belgium). It was considered a significance level of 5% (p< 0.05).
Results
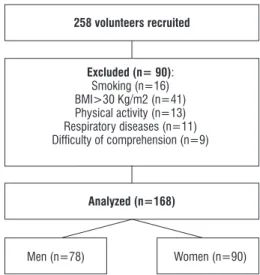
258 individuals were evaluated, and 90 were ex
-cluded because they did not meet the inclusion cri
-teria of the study. The flowchart of the participants of the study is shown in Figure 1.
258 volunteers recruited
Analyzed (n=168)
Men (n=78) Women (n=90)
Excluded (n= 90):
Smoking (n=16) BMI>30 Kg/m2 (n=41) Physical activity (n=13) Respiratory diseases (n=11) Dificulty of comprehension (n=9)
Figure 1 - Flowchart of the participants of the study.
Demographic and anthropometric characteristics of individuals evaluated are separated by gender and arranged in Table 1.
Table 1 - Demographic and anthropometric characteristics of the sample
Variable Women (n= 90) Men (n= 78)
Age (years) 44.8±19.0 42.1±18.9
Corporal Mass (kg)
62±9.8 74.8±12.1
Height (m) 1.6±0.1 1.7±0.1
BMI (Kg/m2) 24.2±3.6 24.8±3.0
Note: Data presented as mean±Standard Deviation. BMI: Body mass index; n: number of individuals.
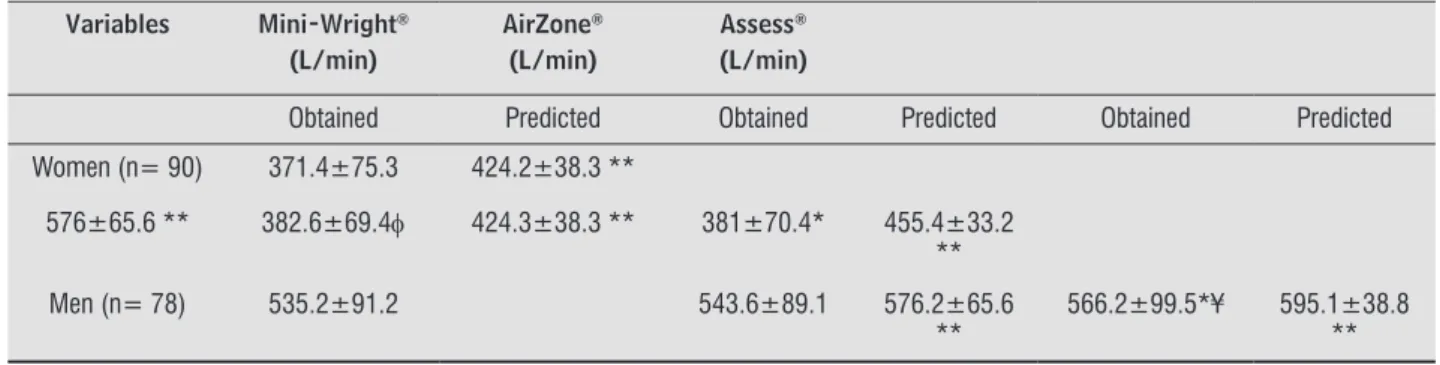
The analysis between the values obtained in PEF observed significant difference between values of PEF obtained by Mini-Wright® and Assess® in both genders,
between the obtained by AirZone® and Assess® only in
men and among those obtained by Mini-Wright® and
AirZone® only in women (Table 2). It was also found
that the values of PEF predicted in the three devices were found to be significantly higher than the values of PEF obtained in both genders (Table 2).
Moderate significant correlations were found between the values of PEF obtained and predicted in both genders (Table 3). We found strong correla
-tions between the values of PEF obtained in Mini-Wright® device with the Assess® (r = 0.913) and with
the AirZone® (r = 0.916) and among those obtained by Assess® and AirZone® (r = 0.934); and among
those obtained by Mini-Wright® with the Assess® (r
= 0.838) and with the AirZone® (r = 0.908) and among those obtained by Assess® and AirZone® (r = 0.813)
in women and men, respectively.
As noted in Figure 2, it was not possible to see agreement between the values of PEF obtained in all three analyses, since, the average of difference between the averages with (1.96) standard devia
-tion between Mini-Wright®, AirZone® and Assess®
were 1.6 (25.4 L/min); 11.2 (30.2 L/min) and 9.6 (60.4 L/min) for women, and -22.6 (58.5 L/min); 8.5 (38.7 L/min) and 31.0 (54.8 l/min) for men, respec
Figure 2 - Agreement between obtained values PEF by the AirZone®, Assess® and Mini Wright® meters in women (n=90) (2A) and in men (n=78) (2B), according to Bland-Altman analysis.
Table 2 - Obtained and predicted PEF values in the Mini-Wright®, Assess® and AirZone® in the evaluated individuals
Variables Mini-Wright®
(L/min)
AirZone®
(L/min)
Assess®
(L/min)
Obtained Predicted Obtained Predicted Obtained Predicted Women (n= 90) 371.4±75.3 424.2±38.3 **
576±65.6 ** 382.6±69.4φ 424.3±38.3 ** 381±70.4* 455.4±33.2 **
Men (n= 78) 535.2±91.2 543.6±89.1 576.2±65.6 **
566.2±99.5*¥ 595.1±38.8 **
Note: Data expressed in mean±Standard Deviation. n= number of indivíduals. Wilcoxon Test= ** Obtained PEF ≠ Predicted PEF. ANOVA repeated measures with post hoc Bonferroni correction: * = Mini-Wright® obtained ≠ Assess® obtained; ¥ = AirZone® obtained≠ Assess® obtained; φ = Mini-Wright® obtained ≠ AirZone® obtained.
Table 3 - Spearman correlation between the obtained and predicted values in the Mini-Wright®, Assess® and AirZone® meters
Predicted Values
Women Men
Obtained Values
r p r p
Mini-Wright® 0.467 <0.01 0.432 <0.01 Assess® 0.407 <0.01 0.467 <0.01 AirZone® 0.457 <0.01 0.519 <0.01
Discussion
According to the guidelines for pulmonary func
-tion tests (18), the various brands of PEF generally differ in the results observed for the same individ
-ual, and often exhibit non-linearity on the meters (21). In this study we compared the values obtained from three different devices of PEF and significant difference was observed between the Mini-Wright® and Assess® meters in both genders, between the
AirZone® and Assess® only in men, and between the
Mini-Wright® and AirZone® only in women.
These differences can be attributed to the fact that Mini-Wright® meter presented the lowest values
of PEF in men and women, and due to men having achieved high values of PEF, especially on Assess®
meter because although they were insufficiently ac
-tive, some exceeded the AirZone® range of 720 L/min,
consisting a limiting factor in the use of this meter, that differs from the scale of most adult meters (100
to 850 L/min). It should be noted, in this way, the im
-portance of the choice of standardized equipment and scales appropriate to the population being studied.
The existing studies in the literature have com
-pared the different meters of PEF to values predicted by spirometry and observed contradictory results (10, 22, 23). Some authors have found that the mea
-surements obtained by the portable device Mini-Wright® are more reliable than those obtained by
other types of equipments (18, 24 - 27). However, in the study of Pesola et al. (11) it was observed that the values obtained through the Mini-Wright® were much
higher than predicted by spirometry in healthy indi -viduals, suggesting that the predicted values should
not be derived from the spirometry, since both meth
-ods are not comparable.
The study by Takara et al. (9), when comparing the values obtained with the Galemed®, Air Zone®, Personal Best® and Vitalograph® meters concluded
that both the Galemed® and the Air Zone® provided
significantly different results, and have great varia
-tion in its limits of agreement. And Kulnik et al. (28) compared the accuracy of four portable meters (Mini-Wright®, Assess®, SpiroUSB® and Microlab
spirometers) concluding that depending on the measuring instrument used, absolute values of peak cough flow recorded in literature should not be com
-pared directly.
In our results, although strong and significant cor
-relations were observed between the values of PEF
obtained, it has not been possible to observe
agree-ment between them, according to the graphic analysis of Bland-Altman (Figure 2), due to the great varia
equations included only children and teenagers (32, 33).
According to Kodgule et al. (2), even between different regions of a country there are also differ
-ences in the values of PEF. Indians of the South region showed lower values of PEF if compared to the north
-ern region, probably due to differences of genetic, cli
-matic, and nutritional characteristics between these populations, suggesting the use of regional equations in clinical practice.
These results show the importance of proper choice of standardized equipment with appropriate scales and reference values according to the studied population, since the evaluation of peak expiratory flow is widely used in clinical practice of physiother
-apy and also in the routine of asthmatic patients to control crisis. Also highlights the need for future mul
-ticenter studies, involving several regions of Brazil, with the purpose of developing reference values of PEF that represent the Brazilian population.
The evaluation of individuals of some cities of a single region in Brazil (Southeast) and the impossibil
-ity of performing spirometry tests for assessment of pulmonary function of the sample studied are limita
-tions of the present study.
Conclusion
According to the obtained results, it is concluded
that the Mini-Wright®, Assess® and AirZone® meters are not interchangeable in both genders, and the
equations proposed by Leiner et al. (12) and Nunn and Gregg (13) were not able to predict the values obtained from the sample.
References
1. Lebowitz MD, Sherrill DL, Kaltenborn W, Burrows B. Peak expiratory flow from maximum expiratory flow volume curves in a community population: cross-sec
-tional and longitudinal analyses. Eur Respir J Suppl. 1997;24:29S-38S.
2. Kodgule RR, Singh V, Dhar R, Saicharan BG, Madas SJ, Gogtay JA, et al. Reference values for peak expira
-tory flow in Indian adult population using a Euro
-pean Union scale peak flow meter. J Postgrad Med. 2014;60(2):123-9.
variation, which suggests that a patient should always be evaluated with the same model of device and that there should be difference in predictive equations according to the meter.
In addition, when comparing the values obtained to those predicted in each meter, we found an over
-estimation of Leiner et al. (12) (Mini-Wright® and
AirZone®) and Nunn and Gregg (13) (Assess®) in both
genders, which reinforces the findings of Menezes et al. (16) that evaluated adults over 40 years-old, residents in the city of Pelotas (RS), and also found it difficult to compare their values of PEF with the study done by Nunn and Gregg (13), because the found data was lower than those parameters recommended by the English authors.
The same result was found in the study of Kodgule et al. (2), which compared the values obtained from the Indian population to equations of Nunn and Gregg (13), for Europeans, and NHANES III (29), for Caucasian Americans. The values obtained were 30 and 20% lower, respectively. In the study of Paes et al. (30) that compared the reference values according to different authors with the values obtained from a sample of the population of São Carlos and found that the values predicted in 1963 (12), 1989 (13) and 2001 (31), in the age group of 20-30 years for the male, overestimated the values obtained.
These findings show that the predictive equations must be representative of the population we want to assess and, since the variables that most commonly determine the derivation of the equations of PEF are gender, age and height and whereas the equations that accompany this study evaluated meters were predicted for European (12) and North American (13) population, it can be said that the anthropo
-metric differences between these populations and our sample may have influenced the values of PEF.
Considering that even though the studied sample was healthy, most of the volunteers reached, on aver
-age, only 85% of predicted, it is expected that indi
-viduals with pulmonary dysfunctions would have a performance below that percentage, which indicates the inconsistency of these equations, as they may overestimate the severity of the clinical condition, leading to unnecessary intervention.
3. Manjunath CB, Kotinatot SC, Manjunatha B. Peak ex
-piratory flow rate in healthy rural school going chil
-dren (5-16 years) of Bellur region for construction of normogram. J Clin Diagn Res. 2013;7(12);2844-6. 4. Tian J, Zhou Y, Cui J, Wang D, Wang X, Hu G, et al. Peak
expiratory flow as a screening tool to detect airflow obstruction in a primary health care setting. Int J Tu
-berc Lung Dis. 2012;16(5):674-80.
5. Aggarwal AN, Gupta D, Jindal SK. The relationship be
-tween FEV1 and peak expiratory flow in patients with airways obstruction is poor. Chest. 2006;130:1454–61. 6. Hegewald MJ, Lefor MJ, Jensen RL, Crapo RO,
Kritchevsky SB, Haggerty CL, et al. Peak expiratory flow is not a quality indicator for spirometry: peak ex
-piratory flow variability and FEV1 are poorly correlat
-ed in an elderly population. Chest. 2007; 131:1494–9. 7. Jithoo A, Enright PL, Burney P, Buist AS, Bateman ED,
Tan WC, et al. Case-finding options for COPD: Results from the burden of obstructive lung disease study. Eur Respir J. 2013;41(3):548-55.
8. Perez-Padilla R, Vollmer W, Vázquez-García J, Enright P, Menezes A, Buist A, et al. Can a normal peak expiratory flow exclude severe chronic obstructive pulmonary disease? Int J Tuberc Lung Dis. 2009;13(3):387-93. 9. Takara GN, Ruas G, Pessoa BV, Jamami LK, Di Lorenzo
VAP, Jamami M. Comparison of five portable peak flow meters. Clinics 2010; 65(5):469-74.
10. Pothirat C, Chaiwong W, Phetsuk N, Liwsrisakun C, Bumroongkit C, Deesomchok A, et al. Peak expira
-tory flow rate as a surrogate for forced expira-tory volume in 1 second in COPD severity classification in Thailand. Int J Chron Obstruct Pulmon Dis. 2015; 10(1):1213-18.
11. Pesola GR, O’Donnell P, Pesola GR, Chinchilli VM, Saari AF. Peak expiratory flow in normals: comparison of the mini Wright versus spirometric predicted peak flows. J Asthma. 2009;46(8):845-8.
12. Leiner GC, Abramowitz S, Small MJ, Stenby VB, Lewis WA. Expiratory peak flow rate. Standard values for normal subjects. Use a clinical test of ventilatory func
-tion. Am Rev Respir Dis. 1963;88:644-51.
13. Nunn AJ, Gregg I. New regression equations for predicting peak expiratory flow in adults. BMJ. 1989;298:1068-70.
14. Menezes AM, Victoria CG, Horta BL, Rigatto M. Va
-lores de referência para o pico de fluxo expiratório em adultos acima de 40 anos, Pelotas, RS. J Pneumol. 1995; 21(2):119-22.
15. Garber CE, Blissmer B, Deschenes MR, Franklin BA, Lamonte MJ, Lee IM, et al. American College of Sports Medicine. American College of Sports Medicine po
-sition stand. Quantity and quality of exercise for developing and maintaining cardiorespiratory, mus
-culoskeletal, and neuromotor fitness in apparently healthy adults: guidance for prescribing exercise. Med Sci Sport Exerc. 2011;43(7):1334-59.
16. Shapiro SM, Hendler JM, Ogirala RG, Aldrich TK, Sha
-piro MB. An evaluation of the accuracy of Assess and Mini-Wright peak flow meters. Chest. 1991;99:358-62. 17. McCoy EK, Thomas JL, Sowell RS, George C, Finch
CK, Tolley EA, et al. An evaluation of peak expira
-tory flow monitoring: a comparison of sitting versus standing measurements. J Am Board Fam Med. 2010; 23(2):166-70.
18. Sociedade Brasileira de Pneumologia e Tisiologia. Di
-retrizes para testes de função pulmonar. J Pneumol. 2002;28(Supl. 3):1-238.
19. Quanjer PH, Lebowitz MD, Gregg I, Miller MR, Peder
-sen OF. Peak expiratory flow: conclusions and recom
-mendations of a Working Party of the European Respi
-ratory Society. Eur Respir J. 1997;10(24):2-8 (Supl). 20. Bland JM, Altman DG. Statistical methods for assessing
agreement between two methods of clinical measure
-ment. Lancet. 1986;1:307-10.
21. Ayres JG, Turpin PJ. Measurement, recording and anal
-ysis of peak flow records. In: Peak flow measurement. Chapman & Hall Medical. 1997;13-32.
22. Fonseca ACCF, Fonseca MTM, Rodrigues MESM, Las
-mar LMLBF, Ca-margos PAM. Pico de fluxo expiratório no acompanhamento de crianças asmáticas. J Pediatr. 2006;82(6):465-9.
23. Rosa FW, Sales NBB, Batista AKMS, Camelier AA. Com
-paração entre dois dispositivos mensuradores de pico de fluxo expiratório em jovens sadios. Rev Pesq em Fisiot. 2012;2(2):93-106.
25. Miller MR, Pedersen OF. The Peak Flow Working Group: The characteristics and calibration of devices for recording peak expiratory flow. Eur Respir J. 1997; 10(24):17S-22S.
26. Folgering H, Brink W, Heeswijk O, Heerwarden C. Eleven peak flow meters: A clinical evaluation. Eur Respir J. 1998;11(1):188-93.
27. Ruchkys VC, Dias RM, Sakurai E, Camargos PAM. Acurácia de medidores de pico de fluxo expiratório (peak flow) da marca Mini-Wright. Jornal de Ped. 2000; 76(6):447-52.
28. Kulnik ST, MacBean V, Birring SS, Moxham J, Rafferty GF, Kalra L. Accuracy of portable devices in measuring peak cough flow. Physiol Meas. 2015;36(2):243-57. 29. Hankinson JL, Odencrantz JR, Fedan KB. Spirometric
reference values from a sample of the general US pop
-ulation. Am J Respir Crit Care Med. 1999;159:179-87. 30. Paes CS, Pessoa BV, Jamami M, Di Lorenzo VAP, Mar
-rara KT. Comparação de valores de PFE em uma amostra da população da cidade de São Carlos, São Paulo, com valores de referência. J Bras Pneumol. 2009;35(2):1-6.
31. Abascal CME, Grau AR, La Rosa DA. Valores normales de flujo expiratório forzado em la población de Ran
-chuelo. Rev Cuba Med. 2001;40(4):243-52.
32. Boaventura CM, Amuy FF, Franco JH, Sgarbi ME, Matos LB, Matos LB. Valores de referência de medidas de pico de fluxo expiratório máximo em escolares. Arq Med ABC. 2007;32(Supl. 2):S30-4.
33. Fritscher CC, Martins FP, Kahan F. Pico de fluxo ex
-piratório em escolas de Porto Alegre, RS. Rev Med PUC-RS. 1996;6(4):19-23.
Received in: 12/06/2015 Recebido em: 06/12/2015