Geometric and Seabed parameter estimation using a
Vector Sensor Array - Experimental results from
Makai experiment 2005
Paulo Santos*, Jose Joaot, Orlando C. Rodrfguez*, Paulo Felisberto* and Sergio M. Jesus* *Institute for Systems and Robotics
University of Algarve, 8005-139 Faro, Portugal Email: {pjsantos.orodrig.pfelis.sjesus}@ualg.pt
tInstituto Superior de Engenharia University of Algarve, 8005-139 Faro, Portugal
Email: [email protected]
Abstract-A vector sensor is constituted by one omni direc tional pressure sensor and three velocity-meters that are sensitive in a specific direction -x, y or z. Since a vector sensor is able
to measure the three particle velocity directional components it acts as a spatial filter and therefore is advantageous in three dimensional direction of arrival (DOA) estimation. The potential gain obtained in DOA estimation can be extended to other geometric parameters such as source range and depth, as well as seabed parameters. The objective of this paper is to present experimental results of a four element vertical vector sensor array (VSA) data set collected during MakaiEx'05 experiment for geometric (range and depth) and seabed geoacoustic parameter estimation (sediment compressional speed, density and compres sional attenuation). The parameter estimation problem is posed as an inversion method based on an extension of the conven tional pressure only Bartlett estimator to particle velocity. The developed VSA based Bartlett estimator is proportional to the pressure only Bartlett estimator response by a directivity factor, providing an improved side lobe reduction or even suppression when compared with the pressure only response. This behavior will be illustrated for geometric and seabed parameters clearly showing the advantages of the use of VSA over hydrophone arrays. In source localization the VSA outperforms an array of hydrophones of same number of sensors. Moreover, when the VSA Bartlett estimator is applied for seabed parameter estimation, it will be shown that the estimation resolution of these parameters increased significantly, even for density and compressional attenuation, parameters difficult to estimate using an array of hydrophones.
Index Terms-Vector Sensor Array processing, Geoacoustic inversion; range and depth source localization.
I. INTRODUCTION
Acoustic vector sensors emerged in 1980s and due to their ability to measure both the acoustic pressure and the three particle velocity components, they are a potential alternative to traditional omni directional hydrophones, which measured the acoustic pressure only. Their practical usage in underwater ap plications started in the last two decades, where several authors conducted research on theoretical aspects of vector sensor processing [1]-[3]. The major advantage of vector sensors over hydrophones is that they capture directional information and act as a spatial filter, which allow for high performance
978·1-61284-4577-0088-0/11/$26.00 ©2011 IEEE
small aperture Vector Sensor Arrays (VSA). The VSA has been proposed for three dimensional direction of arrival (DOA) estimation taking into account that it is able to estimate both elevation and azimuth angles, eliminates the well known left/right ambiguity and provides a better estimation resolution than hydrophone arrays. This behavior was presented in [4], where the horizontal plane orientation of the array axis of the VSA was determined using plane wave beamforming and the DOA of both low and high frequency sources were estimated. More recently, the VSA has been proposed in other underwater acoustic fields like underwater acoustic surveillance and port entrance security [5], underwater communication [6], [7] and geoacoustic inversion [8]-[10].
The objective of this paper is to present VSA data pro cessing results in geometric (range and depth) and seabed (sediment compressional speed, density and compressional at tenuation) parameter estimation, with low and high frequency signals. The potential gain of combining particle velocity with acoustic pressure for parameter estimation was presented in [10], where a VSA Bartlett estimator was developed. Herein, it will be seen that the VSA Bartlett estimator provides a higher estimation resolution of geometric and seabed parameters, not possible using an array of same number of hydrophones. Furthermore, the advantages of the VSA in seabed character ization are shown using high-frequency signals. These results suggest that is possible to obtain seabed geoacoustic properties estimates in this considered high-frequency band (8-14 kHz) using a small aperture VSA with a few elements. The data considered herein was acquired with a four-element vertical VSA, from Wilcoxin TV-OOl [5], in the 100-14000 Hz band, in a shallow water area off the Kauai Island, Hawaii (USA) during the Makai experiment [11], from 15 September to 2 October 2005.
This paper is organized as follows: Section II reviews the vector sensor measurement model and the theory related to the VSA-based Bartlett estimator for generic parameter esti mation. The derived Bartlett-based estimators are applied for seabed parameter estimation in simulated context to
demon-strate the capabilities of using the VSA for inversion problems. Section III makes a general description of the bathymetry and the geometry of Makai experiment 2005, as well as of the received signals used in this paper. The experimental results of source range and depth localization of ship's noise and the estimation results of seabed parameters using high-frequency signals are also presented. Finally, Section IV draws some conclusions.
II. THEORETICAL FRAMEWORK
The theory related with the measurement model, which merged the particle velocity components with the acoustic pressure and the extended VSA - based Bartlett estimator was presented in [10]. This data model and the estimator was derived considering an existing Gaussian beam physical model specifically modified to account for particle velocity - TRACED model [12]. This section reviews the particle velocity - pressure joint model and presents the improvement that is made with the VSA based Bartlett estimator relative to the conventional pressure only Bartlett estimator. Next, the advantages of the VSA Bartlett estimator are illustrated in simulated context for seabed parameter estimation using high frequency signals.
A. Measurement model
A vector sensor measures the acoustic pressure
p(t)
(omni directional part of the vector sensor) and the three particle velocity componentsvx(t), vy(t)
andvAt)
(directional part of the vector sensor) in a particular point of space. Considering that the source emitting the signal impinging in the vector sensor is in the far-field and is band limited, the particle velocityv
can be calculated from the linear acoustic equation (Euler's equation) through the relationship with the acoustic pressure as:i
v
= --'Vp, (1)wp
where p represents the density of the watercolumn, w is the working frequency of the propagating acoustic wave and
v
=[vx, vy, vzl
are the particle velocity components.Assuming a small aperture array and a generic set of environmental parameters
(80)
that characterizes the channel, including geometric or geoacoustic parameters, the particle velocity can be written as:v(80)
=u(80)p,
(2)where the vector
u
is a unit vector related to the pressure gradient [10].Following, it is assumed that the propagation channel can be represented by a linear time-invariant system and that a sound source emits a narrowband signal s at frequency w (the
frequency dependence is omitted in the sequel), for a particular set of channel parameters
80.
The field measured at L vectorsensor elements, combining the acoustic pressure part
y p
and the particle velocity part Yv is given by [10]:y".(8o)
�[ �:��:ll
�[
u(
�
,)
1
"hp(8o)s+
[
:
:
l;
where
hp(80)
is the channel frequency response at the Lpressure sensors, 0 is the Kronecker product and np and
nv are the additive noise for pressure and particle velocity, respectively. It is assumed that the additive noise is zero mean and white, both in time and space (both between VSA elements and between sensors within each element), with variance
0";
and uncorrelated with the signal s.B. VSA Bartlett estimator
Parameter estimation can be casted as an inversion problem, which uses the measured data to infer the parameter values that characterize the ocean. A cornmon signal processing tech nique, initially proposed for source localization and extended for other parameters such as seabed parameters, is Matched Field Inversion (MFI). The basic idea is to use a replica of the received acoustic field as given by a dully calibrated propa gation model. This technique directly correlates the measured data with the modeled replica data (typically with the acoustic pressure data), maximizing the output power for a given input signal [13].
Taking into account the maximization problem described in [10], [13], the Bartlett estimator when only the acoustic pressure part of the vector sensors are considered (p-only), can be written as:
h{; (8)Rp(80)hp(8)
h:(8)hp(8)
Bp(8)0"� + O"�,
(4) whereBp(8)
is the noise-free beam pattern for acoustic pressure.Considering only the velocity component of the VSA data model (3) and using the same formulation described for the acoustic pressure, it was shown in [10] that the Bartlett esti mator when only the particle velocity (v-only) is considered, can be given by:
ex (5)
where
Bp(8)
is the beam pattern for p-only defined in (4),8
is the angle between the replica vectoru(8)
and the data vectoru(80),
taking into account that the inner product between two vectors is proportional to the cosine of the angle between these vectors. Based on this equation, it can be concluded that the v-only Bartlett estimator response is proportional to the p-only Bartlett estimator response by a directivity factor (in this case[cos2(8)]),
which provides an improved side lobe reduction (or even suppression) when compared with the p-only response.The effect of merging the acoustic pressure and the particle velocity in the data model (3) can be seen on the VSA Bartlett estimator, which is given by [10]:
Fig. 1. Simulation scenario based on typical setup of Makai experiment with a large mixed layer, characteristic of Hawaii. The source is bottom moored at 98 m depth and 1830 m range. The VSA is deployed with the deepest element at 79.9m .
ex ex
One can conclude that when the VSA Bartlett estimator is considered, the output response is proportional to the p only Bartlett response, where the constant of proportionality is the directivity factor
[4 cos4
(
� )].
This directivity factor provides a wider main lobe as shown in (6) when compared to the v-only Bartlett estimator (5), due to the cosine of the half angle. However, the inclusion of the acoustic pressure on the estimator eliminates the ambiguities caused by the[cos2(8)]
even when frequencies higher than the array design frequency (at which array spacing equals a half wavelength) are used. This behavior was presented in [10], where the Bartlett estimators previous described were applied for DOA and seabed parameters estimation. The VSA based Bartlett estimator provides clearly an increased estimation resolution of ocean parameters than the p-only estimator. Next section presents a brief study of the application of these estimators for seabed parameter estimation in a simulated context.C. Simulations results
The highlighted advantages of the VSA Bartlett estimator over hydrophone arrays are tested for seabed parameter esti mation' considering the simulation scenario shown in Fig. l.
This scenario is partially based on the MakaiEx setup (for which results on experiment data will be presented in Section III), has a deep mixed layer characteristic of Hawaii and the bathymetry at the site is range independent with a water depth of 104 m. The source is bottom moored at 98 m depth and 1830 m range. The lOcm spacing four-element vertical VSA is deployed with the deepest element at 79.9 m depth. The frequency used in this simulation is 13000 Hz.
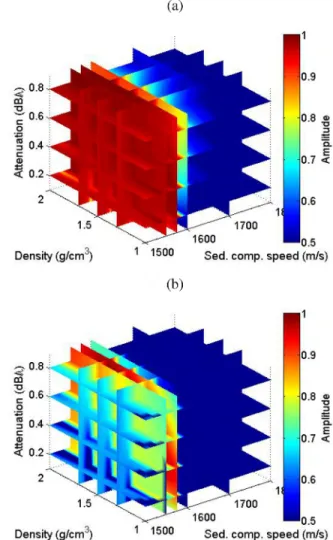
Fig. 2. Three dimensional representation of the simulation results obtained with the power Bartlett estimator for the three seabed parameters at frequency of 13 kHz considering: p-only (Eq. 4) with 4 hydrophones (a) and the full VSA (Eq. 6) (b).
The seabed parameters to be considered herein are sediment compressional speed
(cp),
density(p)
and compressional atten uation(O:p).
The true values for these parameters considered in simulation were taken as:cp
= 1575 mis,p
= 1.5 glcm3and
O:p
= 0.6 dBl
A. The Bartlett estimators presented inSection II-B are used to estimate these parameters, taking into account that the field replicas are generated using the TRACEO Gaussian beam model [10], [12].
The Bartlett estimator power,
PB(O:p, p, cp),
is determined when parameters vary in the following range: [0.1,0.9] dBI
A for compressional attenuation, [1,2] g/cm3 for density and [1500,1800] mls for sediment compressional speed. The Bartlett estimator power,PB (O:p, p, cp),
depends on three parameters so, a three dimensional representation can be illus trated by a cube. As shown in Fig. 2 for the Bartlett estimator power with several slices for each parameter, considering the p-on1y estimator with 4 hydrophones (a) and the full VSA estimator (b).estimator has a very large main lobe with an amplitude power above 0.9, for sediment compressional speed values below 1600 rnIs and for any value of the attenuation and density, making it very difficult to obtain an estimate of the three seabed parameters. However, when this representation is compared with the full VSA Bartlett estimator, Fig. 2 (b), it can be seen that the main lobe is reduced mainly for the sediment compressional speed. The tests show that the Bartlett estimator is decreasingly sensitive to sediment compressional speed, density and compressional attenuation as expected, but when the full VSA Bartlett estimator is used the estimation resolution of these parameters increases. This performance is better understood when the 2D-cross sections ambiguity surfaces are obtained.
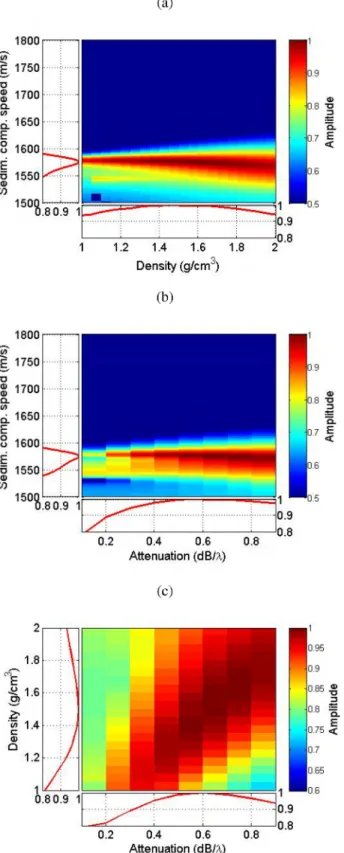
Fig. 3 and Fig. 4 show the 2D cross-sections ambiguity surfaces for: sediment compressional speed versus density, sediment compressional speed versus compressional attenua tion and density versus compressional attenuation. The p-only estimator results are presented in Fig. 3 while the full VSA Bartlett estimator results are presented in Fig. 4. On the left and below each ambiguity surface we show the ID cross section in order to understand the estimation power variation for each parameter. These figures illustrate the improvement that is obtained with the full VSA Bartlett estimator when compared with the p-only estimator, which presents wide main lobes with an amplitude power above 0.95 for all parameters, Fig. 3. The full VSA Bartlett estimator shows an improved estimation resolution for sediment compressional speed compared to that of the p-only, where a narrow main lobe can be seen in Fig. 4 (a) and (b) and confirmed by
1 D cross-section on left side of these plots. Even for density and compressional attenuation (parameters with very difficult estimation using the p-only estimator, Fig. 3 (c)), the full VSA Bartlett estimator increases considerably the estimation resolution with an amplitude power above 0.8, Fig. 4 (c). One can conclude that the VSA increases the estimation resolution of the three seabed parameters and its parameter estimation capability is demonstrated using a few elements VSA.
The potential gain of using the VSA in inverse problems can be highlighted when the individual components of the particle velocity are used. Observing the ambiguity surfaces ID cross-sections for each parameter, Fig. 5, considering the individual particle velocity components, the v-only and the full VSA Bartlett estimator, some conclusions can be drawn. First, the v-only Bartlett estimator (green line) has a narrower main lobe than the full VSA Bartlett estimator (red line) due to the directivity factors obtained in Eqs. 5 and 6. The directivity factor
[4COS4(�)]
provides a wider main lobe than[cos2(8)]
but eliminates possible ambiguities (similarly as for DOA estimation in [10]). Second, the plots obtained for horizontal particle velocity components Vx (dashed line) and Vy (circles)
are coincident (and they are similar to the acoustic pressure response), since these components mostly depend on low-order modes, thus on the rays which have little or no interaction with the seabed. Third and the most importantly, the vertical component Vz (blue line) has a much higher sensitivity to
Fig. 3. 2D cross-sections of ambiguity surfaces estimation simulation results obtained with the p-only Bartlett estimator (Eq. 4) with 4 hydrophones, at frequency of 13000 Hz, for the true values parameters (cp = 1575 mis, p =
1. 5g1cm3 and Ctp = 0.6dB/'>") fixing the compressional attenuation (a), fixing the density (b) and fixing the sediment compressional speed (c). In the left and down side of the ambiguity surfaces are presented the 1 D cross sections for each parameter.
Fig. 4. 2D cross-sections of ambiguity surfaces estimation simulation results obtained with the full VSA Bartlett estimator (Eq. 6) at frequency of 13000 Hz, for the true values parameters (cp = 1575m1s, P = 1.5g1cm3 and O!p =
0.6 dB/>..) fixing the compressional attenuation (a), fixing the density (b) and fixing the sediment compressional speed (c). In the left and down side of the ambiguity surfaces are presented the ID cross-sections for each parameter.
ocean bottom parameters than the others components and than v-only or than the full VSA estimator. In fact, this sensitivity is influenced by the high-order modes with a larger contribution to the vertical component due to their grazing angles. Fig. 5 suggests that vertical (vz) particle velocity only component based Bartlett estimator potentially provides highest estimation resolution observed for all three seabed parameters.
III. EXPERIMENTAL RESULTS
The data analyzed herein was acquired by a four-element vertical VSA in the 100-14000 Hz band, during the Makai experiment (MakaiEx) [11], off Kauai Island, Hawaii (USA), on September 20th, 2005. The vertical VSA used during MakaiEx consisted of a four element with 10 cm spacing and collected data emitted from both towed and fixed acoustic sources. The VSA was deployed during three periods but only the experimental results of 20th September are presented here.
A. Experimental setup
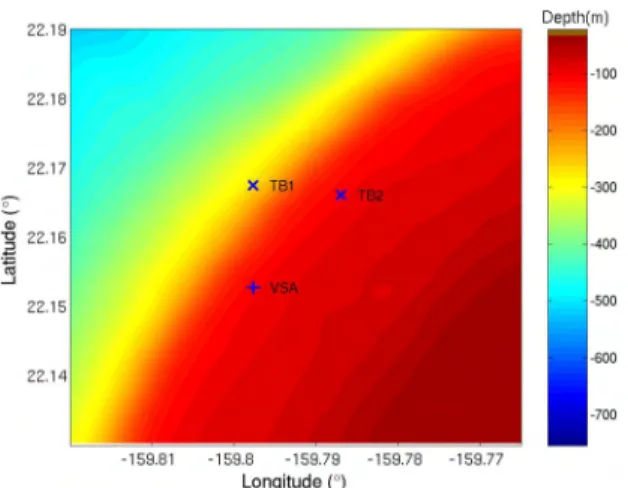
The bathymetry map of the MakaiEx area and the location of the equipment on September 20th are depicted in Fig. 6. On this day, the VSA was fairly close to the stern of RN
Kilo Moana, tied to a vertical cable and with the deepest element positioned at 79.9 m in a water depth of approximately 104 m. The VSA acquired data from two acoustic sources testbed TB 1 and TB2, which were bottom moored at 201.5 m and 98 m depth and 1650 m and 1830 m range, respectively, Fig. 6. Herein, only the signals emitted by TB2 were used to process the data due to the range independent bathymetry of approximately 104 m. The emitted signals were a sequence of LFM's, multitones, M-sequence and communication signals in the 8-14 kHz band.
Fig. 7 presents the spectrogram of lOs block of the acoustic source TB2 emitted signal and acquired by the pressure sensor of the deepest vector sensor element. The tones were used to process the VSA data for seabed parameter estimation. In addition, lower band signals are presented in Fig. 8 (a) and the respective power spectrum (b), where two dominant frequencies - 180 and 300 Hz appear. These frequencies were used to process the VSA data for geometric parameter esti mation and were assumed to be part of ship's noise signature (noise generated by RN Kilo Moana), which were used to find the horizontal plane orientation of the x and y-axis, otherwise unknown [4].
B. Three dimension ship's noise source localization
The three dimension localization is formulated based on the geometric parameter estimation of range and depth of the ship's noise signature, taking as reference the knowledge of the ship's noise DOA, previously estimated [4]. The results were obtained for the low frequency of 180 Hz on September 20th, Fig. 8 (a) and presented in [14].
Fig. 9 presents the normalized ambiguity surfaces for noise source range and depth obtained with the Bartlett estimators described in section II-B, using the p-only (a) and the full VSA (b) Bartlett estimators. The ambiguity surface (a), when
Fig. 5. Ambiguity surfaces ID cross-sections obtained witb tbe normalized Bartlett estimator at frequency of 13000 Hz, considering: individual data componentes (v"" Vy and vz), v-only (Eq. 5) and full VSA (Eq. 6) for
sediment compressional speed (a), density (b) and compressional attenuation (c).
Fig. 6. MakaiEx batbymetry map of tbe area witb tbe position of tbe acoustic sources TBl, TB2 and tbe VSA on September 20tb 2005.
Fig. 7. Sample of tbe signal emitted by acoustic source TB2 and received in tbe pressure sensor at the deepest vector sensor: a sequence of LFM's, multitones and M-sequence in tbe 8-14 kHz band.
p-only estimator is considered, Eq. 4, presents multiple side lobes becoming difficult to define a maximum for the source range and depth. On the other hand, when the full VSA is used, Eq. 6, a well defined narrow main lobe is obtained, Fig. 9 (b). The improved side lobe reduction provided by the VSA, clearly outperforms an array of hydrophones with the same number of sensors, for range and depth source localization purposes.
Fig. 10 presents the ID cross-sections of the ambiguity surface obtained with the full VSA Bartlett estimator, Fig. 9 (b), for several instants in time providing that the maximum of source range and depth appears at the same position. This figure illustrates the stability of the results during the period of data acquisition (on September 20th, the VSA acquired almost two hours of data), which maximum appears at 8.6 m for depth and 35.7 m for range (black arrow in Fig. 10). The range is in agreement with RIV Kilo Moana dimensions, which has a length of approximately 57 m. The noise source is assumed to
Fig. 8. Sample of the RfV Kilo Moana noise in the lower band (bellow 500 Hz) as received in the pressure sensor at the deepest vector sensor (a) and the respective power spectrum (1 s averaging time) of noise detected, where two dominant lower frequencies (180 and 300Hz) are presented (b).
be in the middle of the ship so, 35.7 m is the distance between the VSA (which was tied to a vertical cable) and the middle of the ship. Relatively to 8.6 m depth, this value is high but the result is in agreement with the elevation angle obtained for the ship's noise DOA, [4], bearing in mind that VSA was deployed with the deepest element positioned at 79.9 m. Some displacements of VSA from its vertical position may cause this error.
C. Seabed parameters estimation
The observed advantages of the VSA Bartlett estimator rel atively to hydrophone arrays for seabed parameters estimation in Section II-C, will be presented using the experimental VSA data acquired on September 20th, where the signal was emitted by the acoustic source TB2, Fig. 7. The data tone at 13078 Hz was used.
The Bartlett estimators described in Section II-B are applied to the estimation of the sediment compressional speed, density and compressional attenuation. It was seen in simulated
con-Fig. 9. Normalized ambiguity surfaces for range and depth at frequency 180Hz of noise source on September 20th, obtained with Bartlett estimator considering: p-only (Eq. 4) (a) and the full VSA (Eq. 6) (b).
text and verified with experimental results that the estimator has a higher sensitivity to the variability of the sediment compressional speed than to that of density or compressional attenuation. Thus, several ambiguity surfaces were generated to find the best match between the three parameters.
The sediment compressional speed can be obtained with higher estimation resolution than density or compressional attenuation, thus it was searched taking into account the maxima of the Bartlett estimator power,
PB (ap, p, Cp).
Fig.II presents the ambiguity surfaces cross-sections for the sediment compressional speed throughout almost two hours of data acquisition, considering the p-only (a), the full VSA (b) and the vertical particle velocity only component (c) Bartlett estimators. These plots show the stability of the results during the data acquisition period and estimate that sediment com pressional speed points to values of approximately 1575 mis, with an increased order of estimation resolution from the p only to the vertical particle velocity component only estimator. As already seen in the simulations, the vertical particle velocity component has a narrow main lobe due to the higher sensitivityFig. 10. Normalized ID cross-sections at frequency 180Hz on September 20th for several time intervals during data acquisition, considering the full VSA Bartlett estimator (Eq. 6) for estimation of: depth (a) and range (b). The black arrow indicates the maximum value obtained for each estimated parameter.
to bottom structure, Fig.l l (c). Note that, the p-only estimator, Fig.l l (a), presents two lobes but one of them appears at the estimated value of sediment compressional speed 1575 mls -at the same position of the others estim-ators. Considering this estimated value for sediment compressional speed, the estima tion of density and compressional attenuation is determined.
Fig. 12 shows the ambiguity surface of geometric mean over time of estimates during the period of data acquisition for compressional attenuation and density, considering the estimated value of 1575 mls for sediment compressional speed, using: the p-only Bartlett estimator (a), the full VSA Bartlett estimator (b) and the vertical particle velocity only component estimator (c). Fig. 12 (a) presents a large main lobe, which results in a poor information about the seabed parameters. On the other hand, the full VSA estimator, Fig. 12 (b), presents a narrow main lobe concluding that both parameters, compressional attenuation and density can be obtained with better estimation resolution than with the p-only estimator.
Fig. 11. Measured data normalized ambiguity surfaces for sediment compres sional speed during data acquisition period (almost two hours), considering the Bartlett estimators: p-only (a), full VSA (b) and vertical particle velocity only component (c).
Fig. 12. Measured data normalized ambiguity surfaces for compressional attenuation and density using the geometric mean over time of estimates along the acquisition period, taking into account the sediment compressional speed value of 1575 mis, considering the p-only (a), the full VSA (b) and the vertical particle velocity component only Bartlett estimators (c).
As already seen with simulation results, the vertical particle velocity only component, Fig. 12 (c), confirms this result but with a even narrower main lobe than the other estimators. It is possible to estimate the values for density and compressional attenuation, as expected with less sensitivity than sediment compressional speed, however it can be observed in Fig. 12 (c), that the density points to values of approximately 1.35 g/cm3 and the compressional attenuation to 0.5 dB/A.. These results show that a few elements VSA allows to estimate the three seabed parameters with a much higher resolution than that obtained with an array of same number of hydrophones. Reliable estimates can be attained using only the vertical particle velocity component, resulting in a crucial advantage of the use of vector sensors in ocean parameter estimation. The results are in agreement with those presented in [10] and with the historical data of the area.
IV. CONCLUSION
This paper presents experimental results of VSA data ac quired in shallow water area off the Island of Kauai, Hawaii (USA), during the MakaiEx 2005 experiment, for geometric (range and depth) and seabed parameters estimation. The proposed inversion problem based on VSA Bartlett estimator was used to estimate source range and depth and seabed parameters such as sediment compressional speed, density and compressional attenuation. The classical Bartlett estimator adapted to vector sensor information provides better estimation results for geometric and seabed parameters than hydrophone arrays with the same aperture. The results for range and depth noise source localization were presented, where the full VSA Bartlett estimator shows higher estimation resolution than the p-only estimator with 4 hydrophones and these are consistent over a significant time interval. It was seen that the estimation of sediment compressional speed produced from the verti cal particle velocity only component has a better estimation resolution and are stable during the data acquisition period (almost two hours). Furthermore, the VSA-based measure ments also produced reliable estimates of sediment density and compressional attenuation, mainly when the vertical particle velocity only component is used. Note that these parameters are normally difficult to estimate with pressure measurements alone. The particle velocity information enhances geometric and seabed geoacoustic parameters estimation, resulting in a better parameter estimation resolution. The band of the probe signal used here was well above that traditionally used in geoa coustic inversion, thus an interesting outcome of this paper is that the channel impulse response has sufficient structure to support estimation of seabed geoacoustic parameters in this frequency band.
ACKNOWLEDGMENTS
The authors would like to thank Michael Porter, chief scien tist for the Makai Experiment, Jerry Tarasek at Naval Surface Weapons Center for the vector sensor array used in this work. The authors also thank Bruce Abraham at Applied Physical Sciences for providing assistance with the data acquisition and
the team at HLS Research, particularly Paul Hursky for their help with the data used in this analysis. This work is funded by National funds through FCT - Foundation for Science and Technology under project SENSOCEAN (PTDCIEEA ELC/l 04561/2008).
REFERENCES
[1] A. Nehorai and E. Paldi, "Acoustic vector-sensor array processing,"
IEEE Trans. Signal Processing, vol. 42, no. 9, pp. 2481-2491, Septem ber 1994.
[2] c. Wan, A. Kong, and C. Liu, "A comparative study of DOA estima tion using vector/gradient sensors," in Proceedings of Oceans06, Asia, Pacific, May 16--19 2007, pp. 1-4.
[3] B. A. Cray and A. H. Nuttall, "Directivity factors for linear arrays of velocity sensors," 1. Acoust. Soc. Am., vol. 110, no. 1, pp. 324-331, July 2001.
[4] P. Santos, P. Felisberto, and P. Hursky, "Source localization with vector sensor array during Makai experiment," in Proceedings of 2nd Inter national Conference and Exhibition on Underwater Acoustic Measure ments: Technologies and Results, Heraklion,Greece, June 25-29 2007, pp. 985-990.
[5] J. C. Shipps and B. M. Abraham, "The use of vector sensors for underwater port and waterway security," in Proceedings of Sensors for Industry conference, New Orleans, Louisiana, USA, January 27-29 2004, pp. 41-44.
[6] A. Abdi, H. Guo, and P. Sutthiwan, "A new vector sensor receiver for underwater acoustic communication," in Proceedings MTSIIEEE Oceans, Vancouver, BC, Canada, 2007, pp. 1-10.
[7] A. Song, M. Badiey, P. Hursky, and A. Abdi, "Time reversal receivers for underwater acoustic communication using vector sensors," in IEEE,
Quebec, Canada, September 2008, pp. 1-10.
[8] P. Santos, P. Felisberto, and S. M. Jesus, "Estimating bottom properties with a vector sensor array during MakaiEx 2005," in Proceedings of 2nd International workshop on Marine Techonology, Martech07, Vilanova i la Geltni,Spain, November 15-16 2007, p. 77.
[9] P. Santos, O. C. Rodriguez, P. Felisberto, and S. M. Jesus, "Geoacoustic matched-field inversion using a vertical vector sensor array," in Pro ceedings of 3rd International Conference and Exhibition on Underwater Acoustic Measurements: Technologies and Results, Nafplion,Greece, June 21-26 2009, pp. 29-34.
[10] --, "Seabed geoacoustic characterization with a vector sensor array,"
1. Acoust. Soc. Am., vol. 128, no. 5, pp. 2652-2663, November,201O. [11] M. Porter, B. Abraham, M. Badiey, M. Buckingham, T. Folegot,
P. Hursky, S. Jesus, K. Kim, B. Kraft, V. McDonald, C. deMoustier, J. P reisig, S. Roy, M. Siderius, H. Song, and W. Yang, "The Makai Experiment: High-frequency acoustics," in Proceedings of 8th ECUA,Carvoeiro,Portugal, S. M. Jesus and O. C. Rodriguez, Eds., vol. 1, 2006, pp. 9-18.
[12] O. C. Rodriguez, T he TRACE and TRACEO ray tracing programs,
http://www.siplab.fct.ualg.ptlmodels.shtml. date last viewed 6n1l0. [13] H. Krim and M. Viberg, "Two decades of array signal processing
research," IEEE Signal processing magazine, pp. 67-94, July 1996. [14] J. Joao and P. Felisberto, "Localiza((ao do ruido de navio com uma antena
de sensores vectoriais," in Proceedings of 7" Ediriio das 10rnadas do Mar. Lisboa, Portugal: Escola Naval, November 2010.