GEOPHYSICS APPLIED TO THE MAPPING OF NATURAL CAVES HOSTED
IN IRON ORE IN CARAJÁS (PA), BRAZIL
Maria Filipa Perez da Gama
1, Marco Antonio Braga
1, Marcelo Roberto Barbosa
2, Rafael Guimarães de Paula
2,
Daniele Freitas Gonçalves
2and Iuri Viana Brandi
2ABSTRACT.The Brazilian environmental licensing for mining activities requires technical-scientific studies to demonstrate that natural caves will be protected from the impact of the mining operations. This study presents the results of near-surface geophysical methods applied to geostructural mapping of the rock mass in which the caves are hosted. The ferruginous karstic terrains are challenging to the geophysical interpretation due to the caves’ modest dimensions and the large variations in the host rock physical properties. Electrical Resistivity and GPR (Ground Penetrating Radar) geophysical surveys, were performed overlaying a natural cave located in the surroundings of the N4EN iron mine, in the Carajás Province, northern Brazil. The resistivity data were useful to discriminate different lithotypes and the presence of humidity, while the GPR data revealed details of the fracturing of the rock mass. The results indicated that the presence of humidity and fractures in the rock mass may constitute zones of greater fragility of the cave walls and ceiling.
Keywords: speleology, GPR, electrical resistivity, near-surface geophysics.
RESUMO.O licenciamento ambiental brasileiro para atividades de mineração requer que estudos técnico-científicos demonstrem que as cavernas serão protegidas do impacto das operações de mineração. Este artigo apresenta os resultados de métodos geofísicos rasos aplicados ao mapeamento geoestrutural do maciço rochoso em que as cavernas estão hospedadas. Os terrenos cársticos ferruginosos são desafiadores para a interpretação geofísica, devido às modestas dimensões das cavernas e às grandes variações nas propriedades físicas da rocha hospedeira. Levantamentos geofísicos de Resistividade Elétrica e GPR (Radar de Penetração no Solo) foram realizados sobre uma caverna localizada no entorno da mina de ferro N4EN, na Província de Carajás, região Norte do Brasil. Os dados de resistividade foram úteis para discriminar diferentes litotipos e a presença de umidade, enquanto os dados de GPR revelaram detalhes do fraturamento do maciço rochoso. Os resultados indicaram que a presença de umidade e fraturas no maciço rochoso podem constituir zonas de maior fragilidade nas paredes e teto da caverna.
Palavras-chave: espeleologia, GPR, resistividade elétrica, geofísica rasa.
1Universidade Federal do Rio de Janeiro – UFRJ, IGeo - CPGA, Rio de Janeiro, RJ, Brazil – E-mails: [email protected]; [email protected] 2VALE, Nova Lima, MG, Brazil – E-mails: [email protected]; [email protected]; [email protected]; [email protected]
INTRODUCTION
Mining operations face the challenge of extracting the ore without causing negative impacts to the environment, which includes, in many cases, underground natural caves. The Brazilian Constitution of 1988 considered underground natural caves as public property. Current Brazilian legislation requires scientific studies to demonstrate that mining operations will not cause any physical impact to caves that have historical, scenic, artistic, archaeological, paleontological, ecological and/or scientific value. Until these studies are completed and approved, a protection distance of 250 meters should be maintained, causing blockage of reserves and losses to the mineral industry. Some caves can be suppressed provided all legal requirements are met. Often a combination of more than one geophysical method is used in geophysical surveys to investigate underground caves (natural or man-made). Chalikakis et al. (2011) analyzed the literature on geophysics applied to karst regions and compiled an indicative table of the most appropriate methods for each type of problem, emphasizing that often the combination of more than one method is necessary. Day-Lewis et al. (2017) discussed the applicability of various geophysical methods to environmental problems in fractured rocks, highlighting the electrical resistivity as the most appropriate method for identification and monitoring of fractured zones, and GPR (Ground Penetrating Radar) as appropriate for mapping fractured zones, since the electrical properties of the rock masses are mostly controlled by the presence of fractures and the connectivity between them. Many authors have published studies on near-surface geophysical methods applied to the investigation of underground caves (e.g. Driad-Lebeau et al., 2008, in old salt and marl mines in France; Cardarelli et al., 2010, in old underground pozzolana mines in Italy; Putiška et al., 2014, in carbonatic karst in Slovakia; Ferreira et al., 2017, in quartzite caves in Brazil). The combined geophysical methods allowed the authors to create geological models of the subsurface, with different success rates in cave detection or collapse prediction for each geological context and geophysical method.
In Brazil, mainly after 2008, with the increasing of the cave protection laws, there was a great expansion of the scientific literature about caves in ferriferous terrains (e.g. Ruchkys et al., 2015; Carmo & Kamino, 2015; Jacobi et al., 2015). In spite of the growing interest on this speleological subject, there are still few studies on the application of near-surface geophysics (e.g. Barbosa et al., 2016) although these techniques can be used to
map and characterize the rock mass in which the caves are hosted without causing them any damage.
The major challenges of applying near-surface geophysical methods to iron ore caves are the great heterogeneity of the environment in which they occur, their small size and, especially in the Carajás region, the extremely humid climate. The variable response that these caves present in the sections of electrical resistivity is expected, because depending on the degree of humidity in the walls of the cavities the geophysical signature can be inverted, with the cavity presenting a conductive response instead of the high resistivity corresponding to the air (Putiška et al., 2012). The main challenges to the GPR method application using high frequencies, which allow better resolution to map the small variations of properties in subsurface, is the very small penetration of the signal, due to the presence of a humid clayey layer just below the lateritic crust. For the lower GPR frequencies, which can penetrate deeper than the higher frequencies, the great complexity and heterogeneity of the subsurface is a challenge, as well as the rugged relief of the edges of the plateaus where the caves are inserted. This study aims mainly to evaluate the effectiveness of the application of the electrical resistivity and GPR (Ground Penetrating Radar) geophysical methods in the subsurface investigation and monitoring of the physical integrity of the natural cavities in iron formations. It is also intended to determine how the geophysical data obtained by these methods can contribute to the improvement of the geological and structural knowledge of the cave environment.
GEOLOGICAL CONTEXT
The Carajás Mineral Province is located in the southeastern portion of the Amazonian Craton, in the state of Pará, Brazil. It is located in the Central Amazon Province, and it is limited to the north by the Amazonas Basin and to the east by the Araguaia Belt. Tolbert et al. (1971) published the first results of the geological mapping of the region of Carajás after the discovery of the iron ore deposits in 1967, classifying the rocks in: gneisses granites and amphibolites of Precambrian age; quartzites, phyllites and schists, interleaved with the iron formation; banded iron formation (jaspilite) consisting of quartz and iron oxides with lamination of variable thicknesses; sandstones and conglomerates, and mafic rocks. These authors were also the first to describe the existence of large caves below the lateritic crust, known as “canga”, in this region. DOCEGEO (1988) grouped the greenstone belts of Archean age in the Andorinhas Supergroup, older than 2.85 Gy, composed of the
region’s oldest rocks, overlapped by the Itacaiúnas Supergroup, constituted by lithologically distinct volcano sedimentary rocks, including the Carajás iron formations. The iron ore deposits are hosted in the rocks of the Carajás Formation composed of banded iron formations, represented by jaspilites, and are classified in three districts (North, South and East Ranges), where several discontinuous bodies of high-grade ore occur (Pereira, 2017). The rocks of the Carajás Formation are superimposed by mafic rocks of the Parauapebas Formation. The N4 mine is hosted in rocks of the Grão-Pará Group, aged 2.76 Gy (Machado et al., 1991). For many authors (e.g. Lobato et al., 2005; Rosière et al., 2006), the province presents a stratigraphic problem, as it was affected by the effects of regional folds, transcurrent faults, contact metamorphism and metasomatism around granitic intrusions, as well as hydrothermal alteration related to the various mineralization events. All these factors heterogeneously affected the volcano-sedimentary sequences, resulting in abrupt contacts between similar lithologies, but with different degrees of hydrothermal alteration, thermal metamorphism and deformation intensity. In the Serra Norte domain, the iron formations are predominantly jaspilite, with compositions varying between 17 and 43% Fe and 35-61% SiO2, and present sedimentary and
hydrothermal structures.
The bodies of iron formations are lenticular, discontinuous and include large and rich deposits of iron (65% Fe) which are closely associated with deformed iron formations, although significant amounts of iron oxides are associated with other rocks, including the mafic rocks that are intercalated with the iron formations. The deposits of Serra Norte developed in the zones of greater permeability along the Carajás fold axis (Rosière et al., 2006). Zuchetti (2007), through geochemical studies of metabasalts and detailed studies of fluid inclusions, achieved a better understanding of the hydrothermal alteration in relation to the geotectonic environment of the Grão Pará Group, and inferences about the mineralizing hydrothermal fluid and the processes associated with ore deposition. The author observed that the metabasalts have calcium-alkaline magmatic affinity, continental arc geochemical characteristics and subduction zone signature. Evidence of crustal contamination was observed and suggests that the Grão Pará Group volcanic rocks may have spilled over attenuated continental crust in a back-arc environment. The magmatic hydrothermal fluid had high salinity and alkaline composition, and was rich in U, LREE and Th. In the early hydrothermal stage, the fluid had f O2 in equilibrium
with magnetite, suggesting relatively oxidizing conditions. In the late-hydrothermal stage, the fluid was relatively acidic, causing
the alkali to leach from mafic rocks. There may also have been extraction of Fe2+ from the host rock. The presence of
sulfides in the hydrothermal veins shows that the fluid has evolved to relatively reducing conditions. Despite evidence of relatively fluid-reducing conditions, hematite is the dominant oxide in the late hydrothermal stage. Hematite precipitation in this case can be explained by the relatively acidic conditions of the hydrothermal fluid and/or the mixture of magmatic and meteoric fluids. Figueiredo e Silva et al. (2008) suggested that the Carajás high-grade iron ore deposits could have been formed by hydrothermal alteration associated with fluids derived from magmatic intrusions mixed with meteoric waters, with later supergene enrichment, based upon the following observations: (i) iron orebodies vary in composition according to geometry that does not follow the weathering profiles; (ii) contacts between ores and wall rocks as well as jaspilite and mafic rocks are not always concordant; (iii) the high porosity of the soft ores may be the result of hydrothermal alteration; (iv) the characteristics of the ore of different deposits vary as function of structural variations, indicating that post-sedimentary structures directly influenced the mineralogical and chemical ore composition; and (v) discordant stratigraphic contact between the jaspilitic sequence and iron mineralization.
SPELEOGENESIS
The genesis of the caves in iron ore seems to be the result of the interaction of several processes, not yet fully clarified, since there is no consensus among the researchers. Combination of chemical dissolution processes, iron reduction by bacteria, formation of lateritic crusts and differential erosion are involved, and have interacted over time giving rise to the various types of ferruginous caves. According to Piló et al. (2015), a large number of caves were recorded in the mineralized jaspilite where there are broad coverings of crusts of iron breccias, known as canga, which function as a support element for the tops of the dissected plateau, regionally represented by the Serra dos Carajás. A large number of caves were also recorded in the contact zone between the lateritic crusts and the iron formation, as well as exclusively within the crusts. Shuster et al. (2012) estimated the erosion rate in the Carajás canga plateaus at about 1 m/My, and that these surfaces were exposed to cosmic radiation for a long period (>20 My). The low erosion rate of the lateritic crusts suggests that once formed, the crusts serve as a shield for the more friable rocks below it, corroborating the geomorphological observations in the region, while Monteiro et al. (2018) calculated even lower erosion
rates (0.08 and 0.09 m/My) in canga samples from plateaus N1 and S11D. These authors analyzed weathering profiles of Carajás, having identified goethite precipitation throughout the Cenozoic. The paleosurface that was carved by receding cliffs and formed the present plateaus of Carajás may have been much more extensive in the geological past. Exposure ages of at least 7 My, according to the authors, suggest that plateaus were eroded very slowly during the Cenozoic. Many caves are located at the interface between the lateritic crusts and other lithologies, possibly because the hard crusts support or form the roof of the cave. According to Piló & Auler (2009), the positioning of the caves can be divided into three groups: caves positioned on the edges of lagoons on top of plateaus, caves located at the edges of drainage and headwaters and caves embedded in the sloping edges of the plateaus, including occurrences in the low, medium and high strands. According to the authors, the caves developed inside the canga crust, within the iron formation, or in the contact between them as well as in the ferricrete. The genesis of caves in iron ore seems to have begun with the same processes of silica dissolution that enriched the Carajás iron formations. The dissolution of dolomite, quartz and hematite, leads to the formation of a zone of altered iron ore of high porosity that may reach 50% of the rock volume.
According to Auler et al. (2014), the dissolution initially creates voids at great depths, hundreds of meters from the surface. Maurity & Kotschoubey (1995), in a detailed study on caves in the Serra Norte, described the genesis of the laterite caves as a three-stage process: 1) percolation of aqueous solutions along fissures and fractures, and development of a void reticulate system - Fe and Al mobilization; 2) Fe and Al oxyhydroxides filling fissures and fractures at the crust-saprolite interface by Fe and Al oxyhydroxides generating box-work structures; and 3) development of a low-density zone through dissolution and lateral eluviation of the clayey matrix. The partial collapse of this zone leads to cavity formation. More specifically over the iron formations, according to the same authors, the cavernous level is due to the degradation of most of the crust’s hematitic fragments, previously transformed into friable goethitic products. This low-density zone evolves due to its resistance to the physical and chemical action of groundwater. Where the crusts remain stable, the gradual destruction of the low-density skeletal structures by water lead to the development of underground halls and galleries. In the caves, the collapse of ceiling blocks was certainly an important auxiliary phenomenon, which led to the development of cavities close to the surface and
the notable increase in the height of both halls and galleries. These authors have identified three main types of lateritic coverings: iron-aluminous laterite, hematite breccia and lateritic conglomerate. The iron-aluminous laterite originates from mafic rocks, and consists of a large saprolite horizon composed mainly of kaolinite and goethite, where centimetric cavities were observed capped by a crust up to 5 m thick. The hematite breccia is limited to the zones of occurrence of the desilicified iron formations, and corresponds to thick deposits composed of densely packed hematite fragments, in a clay-ferruginous matrix composed predominantly of goethite. The matrix has also a large porosity and is locally cavernous. The lateritic conglomerate, described by the same authors, may cover both the saprolite of the metavolcanics and the desilicified iron formations, and is characterized by accumulations of rounded pebbles of laterite and angular fragments and plaques of iron ore. The matrix has a clayey consistency and locally presents pseudo-oolitic texture. Gonçalves et al. (2016) studied lateritic profiles in the N4 mine, including the mine bench next to the cave N4E-0026, object of this study, and were able to distinguish three main horizons: lateritic crust, transition horizon and saprolite:
a) Lateritic crust: hardened horizon consisting of
detrital material of reddish-brown color, composed of sub-angular to angular clasts of centimetric to metric dimensions, cemented by aluminum and iron oxyhydroxides. Locally presents massive texture, and also porous and pisolitic portions. The ratio of clasts/cement varies greatly, as does the thickness of the horizon. The clasts are composed of ore fragments, mainly hematite with relicts of banded texture and/or weathered volcanic mafic rocks, as well as fragments of lateritic crust. It presents brecciated, locally conglomerate appearance; b) Transition horizon: horizon of irregular thickness
sometimes presenting features related to the upper lateritic crust or features related to the saprolite below, with fragile textural characteristics. Detrital material from the lateritic crust and saprolite rock fragments coexist in this horizon which often exhibits porous or cavernous textures; c) Saprolite: It comprises reddish clays with whitish or
yellowish spots, sometimes kaolinic, originating from alteration of volcanic rocks or jaspilites. This horizon has irregular thickness and commonly contains internally preserved rock boulders.
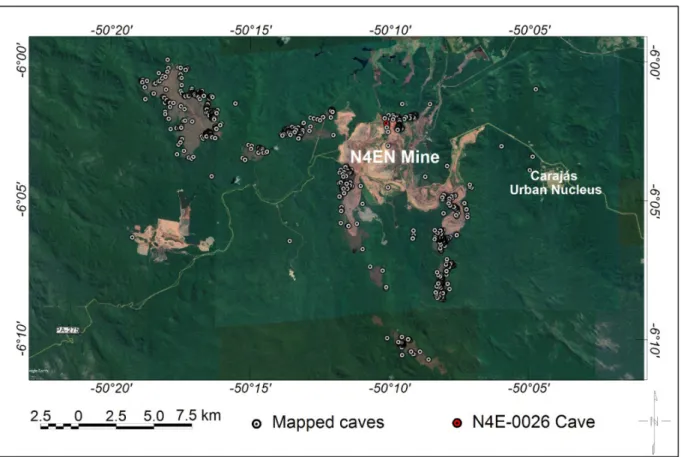
Figure 1 – Location of the Serra Norte caves showing the vast majority of them bordering the plateaus. The N4E-0026 cave is located in the area highlighted in red
(Image: Google Earth (Dec/2016), Caves location: MMA, 2018).
LOCATION AREA
This research presents the results of a combined electrical resistivity/GPR survey over a cavity located within the grounds of the N4EN iron mine, in Carajás, northern Brazil. This cave, N4E-0026, was located under the edge of one of the canga plateaus that cover the iron ore in this mine, as illustrated in Figure 1.
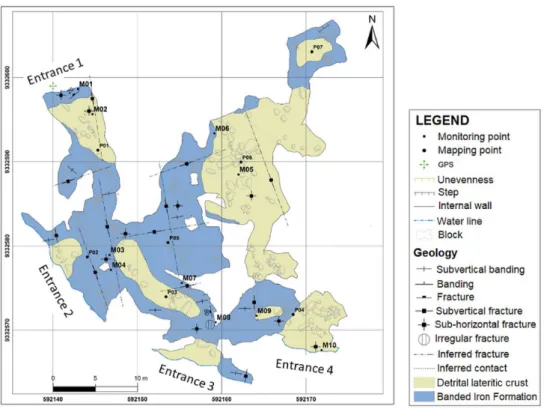
According to Coelho et al. (2013), the N4E-0026 cavity developed in the interface between altered jaspilite and detrital canga. The detrital canga covered the iron ore, with thicknesses that varied from a few meters up to 20 meters. This type of canga is formed by blocks of hematite cemented by hydrated iron oxides and usually has a higher Fe content of and lower alumina content than other types of canga. The detrital canga could be observed inside the cave abruptly set over the altered banded iron formation, and contributed with sediments to the cave floor (Fig. 2). The iron formation presented several subvertical fractures and relief joints.
The roof of the cave accompanied the slope of the plateau, at varying depths between 8 and 12 meters. The maximum level difference within the cave was 15 meters.
A geostructural map of the cave was elaborated by direct mapping inside the accessible parts of the cave (Fig. 3).
METHODS
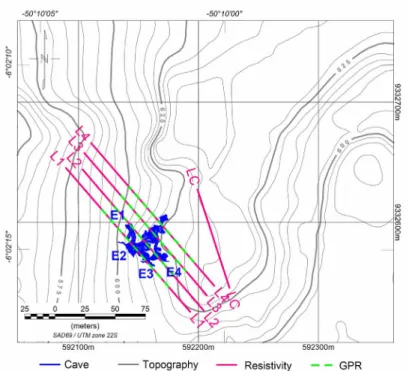
Electromagnetic and electrical geophysical surveys were applied on the plateau exactly in the area over the N4E-0026 cave, in four lines oriented N45ºW and spaced 10 m. The line orientation was chosen so that the sections crossed the cave perpendicular to its longest dimension from the largest entrance (entrance 2). GPR (Ground Penetrating Radar) was used with frequencies of 80 MHz and 250 MHz, and Electrical Resistivity, arranged in dipole-dipole array.
The geophysical survey consisted of approximately 710 m of electrical resistivity sections, distributed along four 155 m long lines and one 90 m control line, and 680 m of GPR lines, consisting of four 85 m lines using each equipment and antennas,
Figure 2 – Cave N4E-0026 entrance 4, where several naturally fallen blocks can be observed (photo taken in Jan/2018).
Figure 4 – Location of the geophysical sections near the N4EN mine pit (E1, E2, E3, and E4: cave
entrances).
Table 1 – Electrical resistivity equipment and acquisition parameters.
Equipment ABEM SAS4000
Number of channels for simultaneous measurements 4 Maximum number of electrodes 64
Electrode Spacing 1.4 m (control line) / 2.8 m (other lines)
Array Dipole-Dipole Levels of investigation 28 Maximum current 1000 mA Minimum current 20 mA Stacks 4 Error limit 2%
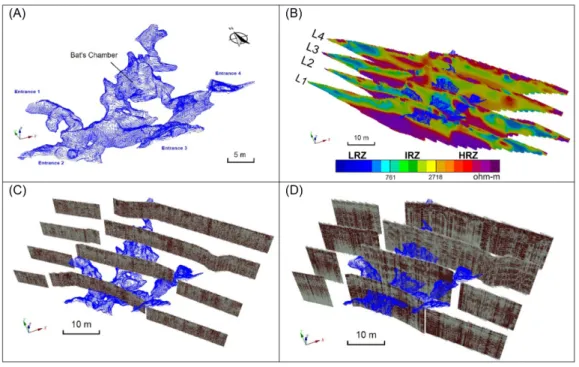
as shown in Figure 4. The control line was acquired close to the nearest mine bench, which was later mapped in detail to constrain the interpretation of the geophysical data. Due to the location of the lines over the plateau edge, it was not possible to obtain continuous measurements along the GPR lines. A 3D model of the cave created using a Leica Laser Scanner model C10, provided by Vale, was transformed into a voxel of 0.1 × 0.1 m which was sliced at the geophysical lines so that the location of the
intersection of the geophysical sections with the cave could be displayed on the images. The location of the geophysical sections with respect of the 3D model of the cave are shown in Figure 5.
The electrode array used in the electrical survey was dipole-dipole, chosen after tests performed prior to the commencement of the survey, over section L1. The parameters used in the data acquisition are summarized in Table 1. The processing and inversion software used was RES2DINV from
Figure 5 – 3D images of (A) the N4E-0026 cave; (B) electrical resistivity; (C) 250 MHz GPR; and (D) 80 MHz GPR sections, illustrating the
depth penetration of each method; cave contour in blue.
Geotomo Software Inc. The field campaign was executed from July to September 2016, during the dry season in Carajás.
Table 2 lists the equipment and parameters selected for the GPR acquisition. The electromagnetic wave propagation velocity obtained in the initial tests performed over a reflector of previously known depth was 0.07 m/ns. The GPR acquisition lines were repeated over the same location using each equipment and parameters. The computer program used for the processing and time to depth inversion was REFLEXW, developed by Sandmeier Inc.
Table 2 – GPR equipment and acquisition parameters. Equipment Pulse Ekko Pro GSSI
Frequency 250 MHz 80 MHz Antenna Shielded Not shielded Trace interval 5 cm 10 cm Number of samples 500 512 Time window 200 ns 500 ns Vertical sampling 0.4 ns 1 ns Stacks 16 16 Antennas separation 0.4 m 1 m RESULTS Electrical Resistivity
Three main resistivity domains were observed in the four electrical resistivity sections, as well as in the control section: LRZ (Low Resistivity Zone), with values below 761 ohm-m; IRZ (Intermediate Resistivity Zone), with values between 761 and 2,718 ohm-m and HRZ (High Resistivity Zone), corresponding to values above 2,718 ohm-m.
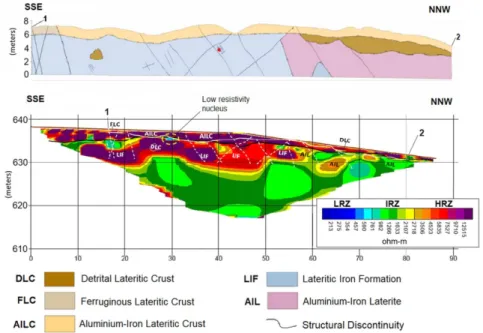
The control resistivity section, located over a nearby mine bench, was compared to the conventional lithogeomechanical mapping of the bench, in order to serve as guidance to the interpretation of the four other profiles over the cave. Figure 6 displays the mine bench mapping and the geophysical section highlighting how the different resistivity domains correlate to the mapped lithotypes. The lithotypes on the top surface, denominated “crusts”, correspond to the higher resistivity values (HRZ). The Lateritic Iron Formation (LIF) lithotype, although in the high resistivity range, presents more homogeneous and lower values. The Aluminium-Iron Lateritic (AIL) lithotype corresponds to intermediate resistivity values (IRZ), likely due to its higher clay contents, calling attention one nucleus of low resistivity values (LRZ) observed immediately below the Aluminium-Iron Lateritic Crust (AILC) probably due to the presence of water/humidity
below the contact. Table 3 displays the correspondence between the lithotypes mapped on the mine bench and the horizons described by Gonçalves et al. (2016).
In Figure 7 (resistivity Line 1), it is possible to observe three different levels easily identified by their electrical signatures. From top to bottom, occur the crusts lithotypes, up to about five meters thick showing domain of high resistivity values (HRZ), all occurring in a discontinuous and irregular way. Immediately below, the second level, is a thick layer of intermediate resistivity (IRZ), up to 20 m thick, and corresponds to the most clayey zone of the lateritic profile, and is shown to be discontinuous near the cave section where high resistivity (HRZ) and low resistivity (LRZ) anomalies can be observed.
Table 3 – Weathering horizons and mine bench lithotypes. Weathering horizon Lithotype Initials
Lateritic crust
Detrital Lateritic Crust DLC Ferruginous Lateritic Crust FLC Aluminium-Iron Lateritic Crust AILC
Transition horizon Lateritic Iron Formation LIF Aluminium-Iron Laterite AIL Saprolite Not present on the bench N/A
The resistive anomalies around the cave sections can be explained by the fact that the air is dry near entrance 2, the largest entrance (about 12 m wide by 3 m high) and entrance 3 (11 x 3 m), or by the presence of more resistive lithotypes near these entrances. The conductive zone (LRZ) observed between the two entrances is interpreted as a more humid zone, where there is percolation of rainwater, therefore requiring close monitoring.
The high resistivity zone (>12,515 ohm-meter = HRZ) in the lower part of the section corresponds to the iron ore (saprolite), which in the N4EN mine is composed of friable hematite, known for its high resistivity that can be explained by its air-filled pores. Resistivity section 2 (Fig. 8) presents similar overall characteristics as section 1, showing also the three well defined horizons: the upper crusts, with high resistivity and small thickness (4 to 5 m), the intermediate zone (IRZ) and the high resistivity base (saprolite), which is believed to correspond to the iron ore. Resistive anomalies can be observed close to the cave entrance, though in the central portion of the section, where the section intersects a cave hall, there are no resistive anomalies, possibly because of the small size of the hall and also because it lies in the deeper and more humid part of the cave.
Section 3 (Fig. 9) intersects the cave well inside the massif, crossing the largest chamber, more than 20 meters away from the nearest entrance. In this place the cave section is about 14 meters wide, and up to 4 meters high, thinning towards the sides. The
Figure 6 – Lithogeomechanical mapping of the nearby mine bench correlated to the control section resistivity image
crust cap over the cave is 5 meters thick, with resistivity values above 3,506 ohm-meter (HRZ). This part of the cave is located in a very homogeneous intermediate resistivity zone (IRZ) that accompanies the declivity of the plateau above it.
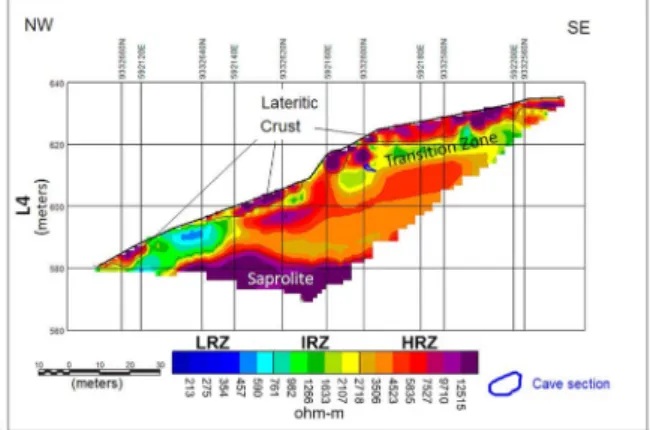
Section 4 (Figure 10) crosses the cave at more than 30 meters distance from the nearest entrance. In this section it is possible to observe a greater thickness of the canga crust, up to 8 meters, and the thinning of the intermediate resistivity zone where the cave is hosted, with higher resistivity values, still within the range of intermediate values (IRZ), between 2,107 and 2,718 ohm-meter.
Ground Penetrating Radar (GPR) – 250 MHz
The GPR sections using the higher frequency antenna (250 MHz) presented high resolution through the first 6 meters from the ground surface and, as expected, presented a shallow depth of penetration, due to the higher frequency and the more conductive material (Jol, 2009). Figure 11 shows detailed images of the GPR sections above and near the cave ceilings sections. Well-defined reflectors can be seen at the top of the GPR images, below which, possibly due to the more conductive clayey material where the caves have developed, the GPR signal is attenuated. Above the cave, the intense fracturing of the rock can be observed, as well as the alternation of contrasted and attenuated reflectors, which can be interpreted as variations in the interface between the crusts and the intermediate zone, also observed in the electrical resistivity sections. The fractures mapped directly by the geologists from inside the cave have been extended in the cave sections, and it is noteworthy that some of them have direct correspondence with the verticalized features that can be observed in the GPR images. High frequency GPR section 1 (Fig. 11A) has reached the roof of the cave, but as the GPR signal was attenuated below around 6 meters deep, the cave location can’t be visualized in the geophysical image. Section 2, again, barely attained the tops of some of the cavity chambers, always in the attenuated zone. Intense fracturing can be observed. Sections 3 and 4 were run above the deeper part of the cave and didn’t reach the cave ceiling (Figs. 11C and 11D), though they present the same intense fracturing close to the surface and attenuation beginning at a depth of approximately 6 m.
Ground Penetrating Radar (GPR) – 80 MHz
The GPR sections acquired with the low frequency antenna (80 MHz) showed quite heterogeneous responses, as the penetration was sufficient to cross the cave in depth. GPR section 1 presented
fairly contrasting and sinuous reflectors around the cave entrance 2 (Fig. 12A), the largest free span. In the other sections the feature is not so clear. GPR section 2 (Fig. 12B) still presented observable contrasted reflectors above the cave span.
GPR section 3 is less contrasted than the others, and the cave section cannot be distinguished from the host rock (Fig. 12C). In this section the crusts at the surface are more attenuated than in the others. GPR section 4 also presents very contrasted reflectors though the cave position cannot be discerned from the host rock, possibly because of the cave’s smaller dimensions where this section crossed the cave.
As regards the structural features, the vertical sequences of reflectors, apparent on all low frequency GPR images, extending from the surface to the base of the images can be attributed to contrasts in the electrical properties of the materials, such as the ferruginous crusts and the cavernous texture observed on the nearby mine bench.
The subvertical fractures observed in the interior of the cave, seem to have expression in the sections, observed as interruptions in the reflectors, although there are many more features of this type in the sections than fractures mapped from inside the cave. A difference in thickness and contrast of the reflectors near the surface can be observed in the four sections corresponding to the limit of the hardened crust and the more weathered material of the intermediate zone between the hardened crusts and the iron ore, were the cave was hosted.
DISCUSSION AND CONCLUSIONS
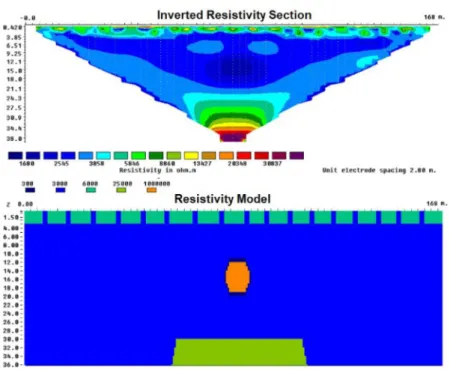
As preconized by Putiška et al. (2012), the resistivity sections were inconclusive to locate the position of the cavity. It is possible that the humidity on the cave walls has created a thin layer of conductive material that masks the effect of the high resistivity of the air inside the cave. Figure 13 shows a model of the electrical response of a cavity filled with air surrounded by a thin layer of conductive material. The fractured hardened crust cap on the surface and resistive rock underneath the cave are also represented in the model. The high resistivity zones near the cave entrances observed on two of the four resistivity sections that crossed the cave can be explained by the fact that the air is dryer near the entrances, but a difference in lithology cannot be discarded.
The resistivity sections were effective to map possible geotechnical fragility zones, where there is contrast between intermediate and low resistivity, as well as changes in the orientation of the boundaries between the conductive/resistive
Figure 7 – Resistivity section 1: the three resistivity zones can be clearly
distinguished. The largest entrance of the cave was intersected by this section.
Figure 8 – Resistivity section 2: this section intersects the cave deeper inside
the rock massif. Resistive anomalies can still be observed near the cave entrance.
Figure 9 – Resistivity section 3: this section intersects the cave at 20 m from the
nearest entrance. The three resistivity zones can still be clearly distinguished.
Figure 10 – Resistivity section 4: this section intersects the cave deeper inside
the cavity, where its diameter is only 2 m. The three resistivity zones are still discernible, though the IRZ is thinner than in the other sections.
Figure 11 – Details of the high frequency (250 MHz) GPR sections. A) GPR
section 1: the cave ceiling is located in the attenuated part of the profile; B) GPR section 2: it crossed a very fractured zone, clearly seen in the fractures extrapolated from the mapping inside the cave and on the image; C) and D) GPR sections 3 and 4: where the cave wasn’t intersected by the sections, the heterogenicity and intense fracturing of the crust lithotypes is visible.
Figure 12 – Details of the low frequency (80 MHz) GPR sections. A) GPR section
1; B) GPR section 2; C) GPR section 3; and D) GPR section 4; high and low contrast regions, as well as discontinuities in the reflectors can be observed.
Figure 13 – Synthetic model of an air-filled cavity surrounded by a very conductive thin layer, hosted in moderately
conductive material. The resistive material underneath the cave and the fractured canga cap are also represented. The calculated anomaly corresponding to the cavity in the inverted section is negative, and can hardly be distinguished from the host rock.
zones, that can be interpreted as zones of water percolation, and therefore, greater geotechnical fragility.
The higher frequency (250 MHz) GPR data were effective in mapping the fracturing or individual blocks in the duricrust cap, but were easily attenuated by the more conductive layer immediately below it, at about 6 m depth, and weren’t able to reach the cavity roofs. The lithology observed on the nearby mine bench mapping (AIL) is rich in clays, that are known to attenuate the GPR signal. It can be observed in the GPR sections that the most resistive layer observed in the surface part of electric sections and interpreted as hardened crusts lithologies has a good correspondence with the most contrasting GPR reflectors near the ground. The lower frequency (80 MHz) GPR data had a good depth of penetration and mapped well the larger fractures mapped from inside the cave, and revealed others that weren’t accessible to direct observation. On the other hand, as expected, the low frequency GPR sections presented a lower resolution and many artifacts due to the rugged terrain and reflections from the escarpments, as well as the very heterogeneous and fractured canga cap.
ACKNOWLEDGMENTS
The authors would like to thank VALE for the data and permission to publish this research, and the reviewers for their careful reading of the manuscript and their constructive remarks.
REFERENCES
AULER, A, PILÓ, L, PARKER, C, SENKO, J, SASOWSKY, I & BARTON, H. 2014. Hypogene cave patterns in iron ore caves: Convergence of forms or processes? In: KLIMCHOUK A, SASOWSKY ID, MYLROIE J, ENGEL SA & ENGEL AS (Eds.). 2014. Hypogene Cave Morphologies. San Salvador Island, Bahamas. Karst Waters Institute Special Publication, 18: 15-19. BARBOSA, MR, PAULA, RF, BRANDI, I, SEBASTIÃO, CS, MATOS, J, BRAGA, MA & CLAUVER, C. 2016. Aplicação do Método Ground Penetrating Radar (GPR) no Mapeamento Geoestrutural de Cavidades Naturais Subterrâneas em Terrenos Ferríferos–Estudo de Caso da Mina N4E, Carajás. In: Simpósio Brasileiro de Mecânica das Rochas – SBMR 2016, Belo Horizonte, MG, Brazil. 9 pp.
CARDARELLI, E, CERCATO, M, CERRETO, A & DI FILIPPO, G. 2010. Electrical resistivity and seismic refraction tomography to detect buried cavities. Geophysical Prospecting, 58(4): 685-695.
CARMO, F & KAMINO, L. 2015. Geossistemas Ferruginosos do Brasil: áreas prioritárias para conservação da diversidade geológica e biológica, patrimônio cultural e serviços ambientais. Belo Horizonte, MG, Brazil, 3i Editora. 553 pp.
CHALIKAKIS, K, PLAGNES, V, GUERIN, R, VALOIS R & BOSCH, FP. 2011. Contribution of geophysical methods to karst-system exploration: an overview. Hydrogeology Journal, 19(6): 1169-1180.
COELHO, A, AULER, A, PILÓ, LB & FRANCO, FP. 2013. Estudo de Impacto Ambiental de Serra Norte – Espeleologia - EIA GLOBAL - Serra Norte (N4/N5). Belo Horizonte, MG, Brazil. 300 pp. Available on: <http://licenciamento.ibama.gov.br/Mineracao/VALE_ Ferro~Carajás~Norte/Espeleologia/>. Access on: Feb. 2, 2018. DAY-LEWIS, FD, SLATER, LD, ROBINSON, J, JOHNSON, CD, TERRY, N & WERKEMA, D. 2017. An overview of geophysical technologies appropriate for characterization and monitoring at fractured-rock sites. Journal of Environmental Management, 204: 709-720.
DOCEGEO. Equipe-Distrito Amazônia. 1988. Revisão litoestratigráfica da Província Mineral de Carajás. Província Mineral de Carajás – Litoestratigrafia e Principais depósitos minerais. In: 35º Congresso Brasileiro de Geologia. Annex to Belém, PA, Brazil. p. 11-56.
DRIAD-LEBEAU, L, PIWAKOWSKI, B, STYLES, P, BOURGEOIS, B & CONTRUCCI, I. 2008. Geophysical detection of underground cavities. In: Symposium Post-Mining. Vandoeuvre-lès-Nancy, 2008. 17 pp. FERREIRA, AA, LOPES, P, SALOMÃO, MS, MANE, MA, GERALDES, MC & CINTRA, H. 2017. Caracterização de cavidades naturais no Parque Estadual do Ibitipoca (Minas Gerais) por meio da pesquisa geológico-geofísica. Espeleo-Tema, 28(1): 49-59.
FIGUEIREDO E SILVA, RC, LOBATO, LM, ROSIÈRE, CA, HAGEMANN, S, ZUCCHETTI, M, BAARS FJ, MORAIS R & ANDRADE, I. 2008. A hydrothermal origin for the Jaspilite-hosted, giant Serra Norte iron ore deposits in the Carajás mineral province, Pará State, Brazil. In: HAGEMANN S, ROSIÈRE C, GUTZMER J, & BEUKES N (Eds.). Banded Iron Formation-Related High-Grade Iron Ore. Littleton, Colorado, USA. Society of Economic Geologists, 15: 255-290.
GONÇALVES, DF, DE PAULA, RG, BARBOSA, MR, TELES, C, MAURITY, CW & MACAMBIRA, JB. 2016. Lateritic terrains and the evolution of pseudokarstic features - case study in the iron ore mine N4E, Carajás region – Pará, Brazil. In: 24th World Mining Congress. Rio de Janeiro, Brazil. p. 227-236.
JACOBI, CM, CARMO, FF, & CAMPOS, IC. 2015. Iron geosystems: priority areas for conservation in Brazil. In: TIBBETT M (Ed.). Mining in Ecologically Sensitive Landscapes. Leiden. CRC Press, p. 55-77. JOL, HM (Ed.). 2009. Ground penetrating radar theory and applications. Elsevier Science, Amsterdam. 544 pp.
LOBATO, LM, ROSIÈRE, CA, SILVA, RCF, ZUCCHETTI, M, BAARS, FJ, SEOANE, JCS, RIOS, FJ, PIMENTEL, M, MENDES, GE & MONTEIRO, AM. 2005. A mineralização hidrotermal de ferro da Província Mineral de Carajás - Controle estrutural e contexto na evolução metalogenética da província. In: ADIMB/DNPM. Caracterização de depósitos minerais em distritos mineiros da Amazônia. DNPM-CT/MINERAL-ADIMB, Brasília, Brazil. 21-92.
MACHADO, N, LINDENMAYER, Z, KROGH, T.E. & LINDENMAYER, D. 1991. U-Pb geochronology of Archean magmatism and basement reactivation in the Carajás area, Amazon shield, Brazil. Precambrian Research, 49: 329-354.
MAURITY, CW, & KOTSCHOUBEY, B. 1995. Evolução recente da cobertura de alteração no Platô N1-Serra dos Carajás-PA. Degradação, pseudocarstificação, espeleotemas. Boletim do Museu Paraense Emílio Goeldi, Série Ciências da Terra, 7: 331-362.
MONTEIRO, HS, VASCONCELOS, PMP, FARLEY, KA, & LOPES, CAM. 2018. Age and evolution of diachronous erosion surfaces in the Amazon: Combining (U-Th)/He and cosmogenic 3He records. Geochimica et
Cosmochimica Acta, 229: 162-183.
MMA. Ministério do Meio Ambiente. 2018. Cadastro Nacional de Informações Espeleológicas. ICMBIO. Brasília, Brazil: Centro Nacional de Pesquisa e Conservação de Cavernas – CECAV. Database downloaded on: Jan. 24, 2018.
PEREIRA, HS. 2017. Integração de dados geológicos, geoquímicos, espectrorradiométricos e de propriedades físicas de rocha: o estudo de caso do Corpo N5S, Província Mineral de Carajás. Master Dissertation in Geology. Instituto de Geociências, Universidade de Brasília, DF, Brazil. 150 pp.
PILÓ, LB & AULER, A. 2009. Geoespeleologia das cavernas em rochas ferríferas da região de Carajás, PA. In: Congresso Brasileiro de Espeleologia. 30, Montes Claros, MG, Brazil, Sociedade Brasileira de Espeleologia. p. 181-186.
PILÓ, LB, COELHO, A & REINO, JCR. 2015. Geoespeleologia em rochas ferríferas. In: CARMO, F & KAMINO, L (Eds.). Geossistemas Ferruginosos do Brasil: áreas prioritárias para conservação da diversidade geológica e biológica, patrimônio cultural e serviços ambientais. Belo Horizonte, MG, Brazil, 3i Editora. p. 125-148. PUTIŠKA, R, NIKOLAJ, M, DOSTÁL, I & KUŠNIRÁK, D. 2012. Determination of cavities using electrical resistivity tomography. Contributions to Geophysics and Geodesy, 42(2): 201-211.
PUTIŠKA, R, KUSNIRAK, D, DOSTAL, I, LACNY, A, MOJZES, A, HOK, J, PASTEKA, R, KRAJNAK, M & BOSANSKY, M. 2014. Integrated geophysical and geological investigations of karst structures in Komberek, Slovakia. Journal of Cave & Karst Studies, 76(3): 155-163.
ROSIÈRE, CA, BAARS, FJ, SEOANE, JCS, LOBATO, LM, SILVA, LL, DE SOUZA, SRC, & MENDES, GE. 2006. Structure and iron mineralization of the Carajás Province. Applied Earth Science, 115(4): 126-133. RUCHKYS, UA, TRAVASSOS, LEP, RASTEIRO, MA, & FARIA, LE. 2015. Patrimônio espeleológico em rochas ferruginosas: propostas para sua conservação no Quadrilátero Ferrífero, Minas Gerais. Campinas, SP, Brazil. Sociedade Brasileira de Espeleologia. 352 pp.
SHUSTER, DL, FARLEY, KA, VASCONCELOS, PM, BALCO, G, MONTEIRO, HS, WALTENBERG, K, & STONE, JO. 2012. Cosmogenic
3He in hematite and goethite from Brazilian “canga” duricrust
demonstrates the extreme stability of these surfaces. Earth and Planetary Science Letters, 329: 41-50.
TOLBERT, GE, TREMAINE, JW, MELCHER, GC & GOMES, CB. 1971. The recently discovered Serra dos Carajás iron deposits, northern Brazil. Economic Geology, 66(7): 985-994.
ZUCCHETTI, M. 2007. Rochas máficas do grupo Grão Pará e sua relação com a mineralização de ferro dos depósitos N4 e N5, Carajás, PA. Doctoral Dissertation in Economic and Applied Geology, Universidade Federal de Minas Gerais, Belo Horizonte, Brazil. 165 pp.
Recebido em 4 de Maio de 2019 / Aceito em 30 de Agosto de 2019 Received on May 4, 2019 / Accepted on August 30, 2019