(Annals of the Brazilian Academy of Sciences)
Printed version ISSN 0001-3765 / Online version ISSN 1678-2690 www.scielo.br/aabc
http://dx.doi.org/10.1590/0001-3765201420130395
Copepod distribution and production in a Mid-Atlantic Ridge archipelago
PEDRO A.M.C. MELO1, MAURO DE MELO JÚNIOR2, SILVIO J. DE MACÊDO1, MOACYR ARAUJO1 and SIGRID NEUMANN-LEITÃO1
1Universidade Federal de Pernambuco, Departamento de Oceanografia, Av. Arquitetura, s/n, Cidade Universitária, 50670-901 Recife, PE, Brasil 2
Universidade Federal Rural de Pernambuco, Unidade Acadêmica de Serra Talhada, Fazenda Saco, s/n, Zona Rural, 56903-970 Serra Talhada, PE, Brasil
Manuscript received on October 3, 2013; accepted for publication on March 11, 2014
ABSTRACT
The Saint Peter and Saint Paul Archipelago (SPSPA) are located close to the Equator in the Atlantic Ocean. The aim of this study was to assess the spatial variations in the copepod community abundance, and the biomass and production patterns of the three most abundant calanoid species in the SPSPA. Plankton samples were collected with a 300 µm mesh size net along four transects (north, east, south and west of the SPSPA), with four stations plotted in each transect. All transects exhibited a tendency toward a decrease in copepod density with increasing distance from the SPSPA, statistically proved in the North. Density varied from 3.33 to 182.18 ind.m-3, and differences were also found between the first perimeter (first circular
distance band) and the others. The total biomass varied from 15.25 to 524.50 10-3
mg C m-3
and production from 1.19 to 22.04 10-3
mg C m-3
d-1
. The biomass and production of Undinula vulgaris (Dana, 1849), Acrocalanus longicornis Giesbrecht, 1888 and Calocalanus pavo (Dana, 1849) showed differences between some transects. A trend of declining biodiversity and production with increasing distance from archipelago was observed, suggesting that even small features like the SPSPA can affect the copepod community in tropical oligotrophic oceanic areas.
Key words: oligotrophic, plankton, St. Peter and St. Paul archipelago, tropical, upwelling.
Correspondence to: Pedro Augusto Mendes de Castro Melo E-mail: [email protected]
INTRODUCTION
The tropical ocean region is made up of oligotrophic waters characterized by low primary productivity and consequently a low secondary productivity (Boltovskoy 1981). Despite low densities, tropical zooplanktonic communities have as their primary characteristic a high species richness, which in turn results in a large network of trophic interactions in
which this community participates (Piontkovski and Landry 2003).
Within this complex network of interactions,
copepods play a significant role in the transfer of
importance of this group in terms of community structure, biological processes and their behavioral mechanisms (Wiggert et al. 2005, Berasategui et al. 2005, Hirst and Kiørboe 2002, Strickler 1984), including discussion on the importance of copepod
in the diet of fish species of commercial interest
(Champalbert and Pagano 2002, Möllmann et al. 2004, Catalán et al. 2007) and the reasons underlying its success in the marine environment (Kiørboe 2011). The copepods are considered the most abundant and diverse components of mesozooplankton in marine environments and the most important secondary producers in marine food webs (Shimode et al. 2006, Gallienne and Robins 2001).
Variations in the abundance, distribution and interactions within the community of planktonic copepods are strongly related to the hydrographic characteristics of the marine environment (Kang and Hong 1995), determining its structure and function (Haury et al. 1990). The presence of islands and
seamounts is responsible for modifications in the
hydrodynamics of the environments where these features occur, generating a diversity of physical
and ecological processes, influencing the structure
of several local communities (Boehlert and Genin 1987, Genin 2004, Rogers 1994) and promoting the creation of unique habitats for many species (De Forest and Drazen 2009).
Typical oceanic species are less common above seamounts than in open ocean (Wilson and Boehlert 1993, Genin et al. 1994). Therefore, the interactions between the physical forcing and animal behaviors such as vertical migrations are key factors in the formation and maintenance of aggregations in regions of abrupt topography, still affecting the spatial distribution of such plankton aggregations in these areas (Genin 2004, Leis 1982).
Within this context, the present study tested the hypothesis that the abundance of copepod and the biomass and production of dominant calanoids vary around the Saint Peter and Saint Paul Archipelago according to the distance from the feature.
MATERIALS AND METHODS
STUDY AREA
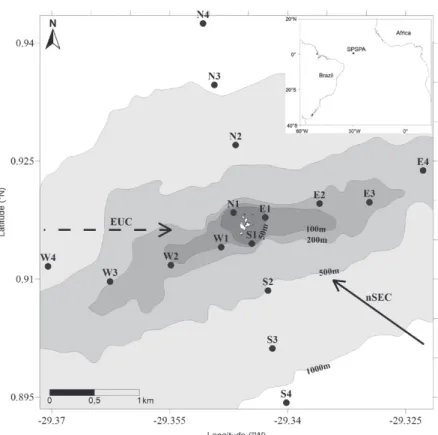
The archipelago is formed by a group of rocky islands and is located north of Equator (0°55’06”N and 29°20’48”W), lying approximately 960 km off the northeast coast of Brazil (Edwards and Lubbock 1983) (Fig. 1). The SPSPA rises from the Mid-Atlantic Ridge, 4000 meters deep, to a maximum altitude of 18 m (Vaske Jr. et al. 2005). The three larger islands (Belmonte, St. Peter and St. Paul) form a horseshoe cove with average depth of 8 m. These islands are separated by narrow channels that promote strong water currents (Pinheiro 2004).
According to Araujo and Cintra (2009), the ocean dynamics that act on the SPSPA are subject to the influence of the north branch of the South Equatorial Current (nSEC) and the Equatorial Undercurrent (EUC) (Fig. 1). Near the surface, the nSEC is shifted northwestward under the action of the Southwestern tradewinds shear, whereas the EUC flows eastward over the equator just beneath the surface (Stramma 1991, Stramma et al. 2003, Giarolla et al. 2005, Lumpkin and Garzoli 2005, Brandt et al. 2006). The interaction between the abrupt topography of the SPSPA and these currents results in the production of vortices, disturbances of the thermohaline structure and possibly local mechanisms of resurgence (Araujo and Cintra 2009).
Because of its long distance from the coast and its strategic position in the middle of the Equatorial Atlantic Ocean, the SPSPA is of great importance, being a migratory stop and feeding location for a
large number of species of fish, and constitutes an important fishing area in the Exclusive Economic
Zone (EEZ) of northeastern Brazil with an
emphasis on fishing for tuna, mackerel, sharks and flying fish (Vaske Jr. et al. 2005). The SPSPA also
displays a high degree of endemism among reef
SAMPLING STRATEGY AND LABORATORY PROCEDURES
Diurnal collections of plankton samples were perfor med and water surface temperatures were measured between 07:00 and 10:00 h at 16 stations around the SPSPA (Fig. 1). These stations were arranged along perpendicular transects to represent four circular distance bands (perimeters) from the SPSPA, lying approximately 325 (perimeter 1 - P1), 1250 (perimeter 2 - P2), 2175 (perimeter 3 - P3) and 3100 m (perimeter 4 - P4) from the archipelago. The transects were oriented to the north (N), south (S), east (E) and west (W). The
stations were codified based on transect orientation and distance bands (e.g. N1 – Transect north, first
band). The samples were collected during the rainy season (May 2008).
Mesozooplankton samples were collected with a plankton net with a mesh size of 300 µm and a 0.30 m mouth diameter, coupled with a
flowmeter. Due to logistical problems associated to
the extreme envi ronmental conditions, it was not possible to replicate the samples. Subsurface hauls were conducted for 10 minutes at a speed of 2 to 3 knots. The samples were placed in 250 mL plastic
bottles and fixed with 4% neutralized formaldehyde
with borax (5 g L-1) according to the procedure described by Newell and Newell (1963).
In the laboratory, each sample was placed in a beaker, diluted to 250 mL with distilled water and homogenized. Three subsamples of 5 mL were taken with a Hensen Stempel pipette and then analyzed under a binocular compound microscope. Five additional subsamples were inspected to search
rare species. Copepods were identified to the lowest
taxonomic level possible. The sestonic biomass was determined on the basis of the wet weight by weighing the sample on a precision balance, as described in Omori and Ikeda (1984).
DRY WEIGHT, BIOMASS AND PRODUCTION OF COPEPODS
Copepod production was estimated for the three most abundant and frequent calanoid species (Undinula vulgaris, Acrocalanus longicornis and Calocalanus pavo). As a criterion for the selection of the focal species, the frequency (>85%) and dominance/abundance (> 30% in more than one sample) of the species were considered.
For each species, the length of the prosome of 30 individuals, chosen at random, independently of its developmental stage, were measured per sample. These measurements were used for the calculation of dry weight (DW) through linear regressions between prosome length and body weight, according to Webber and Roff (1995). Dry weight (DW) was then converted into carbon (C), assuming that C = 0.40*DW (Postel et al. 2000).
To obtain the biomass of each species (B; mg C m-3), the equation B = DW * 10-3D was used, where DW (µg) was the average dry weight in C and D was the density (ind m-3) of each species.
Unfortunately it was not possible to carry out any incubation technique to estimate copepod growth/ egg production, due to the complete isolation and
prohibitive conditions of the scientific station of the
archipelago. For this reason, we choose the Hirst-Lampitt model (Hirst and Hirst-Lampitt 1998), to estimate the instantaneous growth rate (g). This model was developed based on a data set that includes studies conducted at temperatures ranging from -2.3 to 29.0°C, polar to tropical regions, highly eutrophic to oligotrophic waters, and estuarine to offshore waters. The used H-L model considers the water temperature (T) and the dry weight in carbon to calculate the growth rate, where Log10 g = 0.0208[T] – 0.3221[log10C] – 1.1408. Production (mg C m-3 d-1) was calculated as the product of g and B.
DATA AND STATISTICAL ANALYSIS
The Shannon index (H') was applied to estimate the diversity of the community (Shannon 1948), and the evenness (J') was calculated according to Pielou (1977).
Statistical analyses were based on data density, biomass and production, where samples were compared using a Kruskal-Wallis. The Student-Newman-Keuls test was used as an a posteriori
comparison when significant differences were found.
Before the analyses, all data were transformed using
log(x+1). Spearman’s correlation coefficient was
applied to verify the degree of association between the values of sestonic biomass and the biomasses of the 3 focal species. The statistical tests were conducted using the statistical package BioEstat 5.0 (Ayres et al. 2007), and values of p < 0.05 were
considered to represent significant differences.
RESULTS
COPEPOD STRUCTURE AND RICHNESS
The copepod community in the SPSPA was com-posed of 38 taxa, of which 22 were Calanoida, 12 Cyclopoida and four were Harpacticoida. Of
these, 35 were identified to the level of species;
one, to genus; one, to family; and one, to the order level (Table I). The calanoids were represented by 11 families, dominated by Paracalanidae with
five species, followed by Calanidae (4 species),
Pontellidae (3 species) and Euchaetidae (2 species). Among the cyclopoids, the most well-represented taxa were Sapphirinidae and Corycaeidae (four species each) and Oncaeidae (two species). In harpacticoids, Miraciidae was represented by two species, and the other families were represented by only one species.
Calanoids were the most abundant group, followed by cyclopoids and harpacticoids. Calanoids represented more than 50% of the total density in all samples.
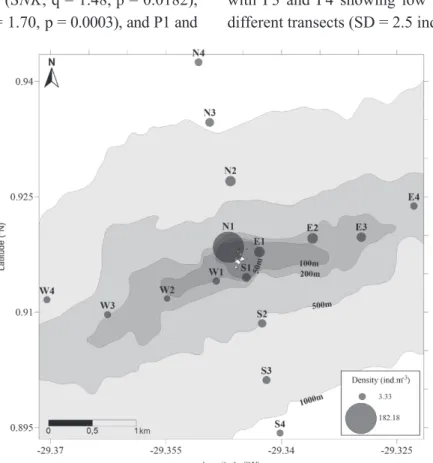
The density of copepods showed a gradient between the archipelago and the open ocean, with higher values on the perimeter closer to the archipelago that decreased with increasing distance
from the islands (Fig. 2). All transects showed a decrease in density of copepods towards open ocean,
but only the north transect was signi ficantly different
from the others (K-W, H = 28.77, p<0.0001; SNK,
TAXA Relative Abundance FO (%)
S W N E
Nannocalanus minor
(Claus, 1863)
0.00 0.00 6.87* 0.00 13%Neocalanus gracilis (Dana, 1849) 0.95 0.00 5.11* 0.00 19%
Neocalanus robustior (Giesbrecht, 1888) 0.00 0.00 0.55 0.00 6%
Undinula vulgaris (Dana, 1849) 6.30* 16.11* 3.92 43.75*** 100%
Calocalanus pavo (Dana, 1852) 21.75** 28.03** 3.26 5.41* 100%
Calocalanus plumulosus (Claus, 1863) 0.00 0.00 0.05 0.00 6%
Paracalanus aculeatus Giesbrecht, 1888 0.00 0.00 0.05 10.07* 13%
Paracalanidae (others) 0.00 0.00 1.09 0.00 6%
Acrocalanus longicornis Giesbrecht, 1888 37.37*** 15.55* 9.30* 11.62* 88%
Clausocalanus furcatus (Brady, 1883) 1.72 0.86 1.19 0.00 31%
Euchaeta marina (Prestandrea, 1833) 0.00 0.00 6.57* 0.00 13%
Paraeuchaeta pubera (Sars, 1907) 0.00 0.00 3.58 0.00 13%
Scolecithrix danae (Lubbock, 1856) 0.00 0.41 28.24** 0.18 31%
Lucicutia flavicornis (Claus, 1863) 0.00 0.00 0.55 0.00 6%
Haloptilus angusticeps Sars, 1907 0.00 0.00 0.27 0.00 6%
Pleuromamma piseki Farran, 1929 0.00 0.00 0.55 0.00 6%
Centropages violaceus (Claus, 1863) 0.00 0.41 1.12 0.10 31%
Candacia pachydactyla (Dana, 1849) 0.00 1.73 4.76 0.80 50%
Pontella atlantica (Milne Edwards, 1840) 0.00 0.45 0.64 1.22 38%
Pontellina plumata (Dana, 1849) 3.88 0.45 1.27 6.54* 69%
Labidocera nerii (Krøyer, 1849) 0.00 3.04 1.04 0.73 69%
Calanoida (others) 0.00 1.31 0.09 0.00 19%
Corycaeus (Corycaeus) speciosus Dana, 1849 3.25 1.66 6.97* 1.17 75%
Corycaeus (Corycaeus) clause Dahl, 1894 0.00 0.41 0.49 0.25 31%
Corycaeus (Onychocorycaeus) latus Dana, 1849 2.38 2.07 1.38 1.17 88%
Farranula gracilis (Dana, 1849) 6.18* 2.89 1.57 2.41 94%
Farranula sp. 1.95 0.86 0.00 0.00 31%
Oithona plumifera Baird, 1843 2.11 2.48 0.52 0.00 50%
Oncaea venusta Philippi, 1843 4.05 5.96* 0.49 1.49 75%
Oncaea media Giesbrecht, 1891 4.48 6.39* 5.71* 7.36* 100%
Copilia mirabilis Dana, 1849 1.15 2.48 1.02 0.43 38%
Copilia lata Giesbrecht, 1891 0.00 0.00 0.00 0.18 6%
Sapphirina nigromaculata Claus, 1863 0.96 2.10 0.56 1.79 75%
Sapphirina opalina-darwinni Dana, 1849 0.00 0.00 0.32 0.00 13%
Macrosetella gracilis (Dana, 1847) 0.47 1.69 0.15 0.75 44%
Microsetella rosea (Dana, 1849) 0.00 0.00 0.09 0.19 13%
Miracia efferata Dana, 1849 1.06 1.28 0.50 2.37 56%
Harpacticoida (others) 0.00 1.35 0.14 0.00 19%
TABLE I
List of copepod taxa, relative abundance (by transect) and frequency of occurrence (FO) (for sample) at the Archipelago of Saint Peter and
Saint Paul, Brazil. S: South; W: West; N: North; E: East.
NxS: q = 1.87, p < 0.01; NxW: q = 2.17, p < 0.01; NxE: q = 1.50, p < 0.01). When comparing the four
distances from the archipelago, significant differ
ences were found (K-W, H = 20.25, p = 0.0002) between P1 and P2 (SNK, q = 1.48, p = 0.0182), P1 and P3 (SNK, q = 1.70, p = 0.0003), and P1 and
P4 (SNK, q = 2.08, p < 0.0001), which indicates an immediate effect of distance from SPSPA on the community. The largest density variations occurred between the two closest distance bands (P1 and P2), with P3 and P4 showing low variability between different transects (SD = 2.5 ind m-3).
Figure 2 - Copepod density spatial variation in the Archipelago of Saint Peter and Saint Paul, Brazil.
The north transect exhibited the highest
varia-tion in density, with significant differences between
the stations (K-W, H = 19.12, p = 0.0003). These differences were found between N1 and N3 (SNK, q = 2.32, p = 0.0008), N1 and N4 (SNK, q = 2.53, p < 0.0001) and between stations N2 and N4 (SNK, q = 0.67, p = 0.0242). The other transects did not
show significant differences in density between
their stations, being relatively homogeneous. The relative abundance of species by transect (Table I) highlighted the large number of rare species. No species shows more than 50% of relative abundance. The species Undinula vulgaris, Acrocalanus longicornis and Scolecithrix danae
were abundant in transects E, S and N, and Calocalanus pavo dominated in S and W. U. vulgaris was the dominant species at E4 station.
BIOMASS AND PRODUCTION OF DOMINANT COPEPODS
Undinula vulgaris showed the highest average biomass (80.2±108.8 10-3 mg C m-3), followed by A. longicornis (42.2±35.6 10-3 mg C m-3) and C. pavo (11.9±5.8 10-3 mg C m-3) (Table II). Significant differences were found between the species (K-W, H = 10.94, p = 0.0042). Although A. longicornis exhibited higher biomass values than U. vulgaris
in the south transect (Fig. 3), no significant
differences were observed between them. C. pavo
was significantly lower in biomass than the two
mentioned species (SNK, q = 2.36, p = 0.0019; q = 1.42, p = 0.0111, respectively).
U. vulgaris biomass was not significantly different in the various distance bands; however, differences were observed among the transects (K-W, H = 11.71, p = 0.0084). These differences were found between north and west (SNK, q = 4.57, p = 0.0175), east and west (SNK, q = 2.45, p = 0.0023), and east and south (SNK, q = 2.09, p = 0.0259). For this species, high biomass was recorded at
three stations, which reflects different conditions
for the community. At N1, high abundances of copepodites were observed, which were present in low abundances or absent in the other stations. The biomass of A. longicornis and C. pavo was
not significantly different amongst transects and
distance bands.
The total biomass for the three species
(Table II) exhibited significant differences only
between transects (K-W, H = 9.90, p = 0.0194).
These differences were between the north and west transects (SNK, q = 4.89, p = 0.0175) and the east and west transects (SNK, q = 5.46, p = 0.0038), with higher biomasses north and east of the SPSPA. A positive correlation was observed between the values of total and ses tonic biomass (Spearman; rs = 0.794 and p < 0.001).
The production showed the same pattern that was observed for biomass, and although U. vulgaris exhibited a higher mean value (4.3±5.1 10-3 mg C m-3 d-1), followed by A. longicornis (2.9±2.4 10-3 mg C m-3 d-1) and C. pavo (1.0±0.5 10-3 mg C m-3 d-1), no differences in production were observed between species.
The production of U. vulgaris showed signifi cant spatial differences (K-W, H = 9.90, p = 0.0194) between the east and south transects (SNK, q = 6.82, p = 0.0175) and east and west transects (SNK, q = 7.23, p = 0.0038). Among the distance bands, no differences were found. A. longicornis and C. pavo did not exhibit any type of difference between transects or distance bands.
The total production of the three species also
showed significant differences (KW, H = 8.44, p =
0.0376) between the north and west transects (SNK, q = 4.42, p = 0.0213) and the east and west transects (SNK, q = 5.49, p = 0.0075) (Fig. 4, Table II).
DISCUSSION
Typical epipelagic copepod assemblages charac-terized the waters around the SPSPA, dominated
Transect Distance band
N E S W P1 P2 P3 P4
Density 244.82 100.80 57.06 27.92 245.89 82.53 66.10 36.06 Biomass 825.79 805.05 331.10 144.00a 941.42 553.29 364.72 246.52 Production 41.90 52.79 26.21 10.60b 51.77 37.98 24.95 16.79
a Significantly different from N (KW, H = 9.90, p = 0.0175) and E (KW, H = 9.90, p = 0.0038) b Significantly different from N (KW, H = 8.44, p = 0.0213) and E (KW, H = 8.44, p = 0.0075)
TABLE II
Total density (ind m-3), Biomass (10-3 mg C m-3) and Production (10-3mg C
m-3 d-1) of the total three main Copepod species by transect and distance
Figure 3 - Biomass values (10-3 mg C m-3) of the three main copepod species by station in the Archipelago of Saint Peter and Saint Paul, Brazil.
mainly by calanoids species. Several authors report that in tropical and subtropical waters, calanoids often contribute over 50% of the community of copepods in meshes over 200 µm, as was observed in this study (Webber and Roff 1995, Champalbert et al. 2005). The ratio of the different orders of copepods indicated the dominance of calanoids, which is typical of subtropical and tropical waters (Miyashita et al. 2009, Schnack-Schiel et al. 2010), but in deeper layers, several studies have shown that the calanoid concentrations tend to decrease, resulting in a reversal of that dominance with increasing depth (Roman et al. 1995) and they can occasionally be replaced by cyclopoids, such as Oncaeidae (McKinnon et al. 2012).
All species considered by Björnberg (1981)
as indicators of the tropical water (a superficial
water mass with salinities and temperatures >36 and >20 °C, respectively), were found in our study, where the most common in the archipelago were the calanoids Undinula vulgaris, Calocalanus pavo, Paracalanus aculeatus, Acrocalanus longicornis, and the cyclopoids Farranula gracilis, Oncaea venusta, Corycaeus (Corycaeus) speciosus, Corycaeus (Onychocorycaeus) latus, Oncaea media and Sapphirina nigromaculata. The others species were considered rare, which is a typical feature of tropical and subtropical oceanic waters (Piontkovski et al. 2003, Lo et al. 2004). The most abundant and frequent species were U. vulgaris, A. longicornis and C. pavo. Neumann-Leitão et al. (2008) also observed C. pavo and U. vulgaris to be the two most abundant species in the oceanic area of Northeastern Brazil and to have wide distributions in this area. Several authors highlight U. vulgaris as common species in tropical oceanic areas, and it can be regarded as the dominant species of the shelf and oceanic waters of Northeastern Brazil (Champalbert et al. 2005, Cavalcanti and Larrazábal 2004). Acrocalanus longicornis is also a common species in tropical surface waters (Stephen 1984, Cornils et al. 2010).
The species richness observed in this study is related to some important factors: (i) the size of the mesh used (300 µm), (ii) the small diameter of the net’s mouth (0.30 m) than that used in oceanic areas, and (iii) the depth sampled. In tropical/ subtropical communities, there is a dominance of small species of copepods (Webber and Roff 1995, McKinnon et al. 2008), which may not be
efficiently sampled by a plankton net with a large
mesh size. For instance, the Oithonidae, a typical and common family of small copepods in tropical Atlantic ocean (Neumann-Leitão et al. 2008), was represented by just one species (O. plumifera), probably indicating this mesh selectivity. On the other hand, the diameter of the plankton net mouth may have contributed to an underestimation of the large and sparse copepod species, since in oligotrophic waters the size of the net´s mouth may have to be increased to collect a reasonable sample size of animals (Sameoto et al. 2000). Besides, large species tend to occur mostly in deeper waters that are rich in phytoplankton and smaller species more numerous near the surface (Deevey and Brooks 1977, Webber and Roff 1995). This pattern of vertical distribution of species explains the lower species richness reported in studies of mesozooplankton compared to studies carried out with smaller mesh size or with studies with vertical hauls.
Other studies in tropical oceans have observed similar biodiversity trends. Brugnano et al. (2010), for instance, recorded a greater number of species at depths of 20-40 m (87 species) and 40-60 m (78
species) compared to the superficial layer (020 m),
et al. 2003). Lo et al. (2004) observed less species richness on the surface (11), with a gradual increase with depth, reaching almost 40 species at 200 m. Thus, the richness recorded for the SPSPA in our study (38 species and 27 genera) can be considered high, similar to other studies in similar conditions (Lo et al. 2004, Schnack-Schiel et al. 2010). Our data, obtained from sub-surface hauls, suggest a potential for high biodiversity in deeper layers in the SPSPA. This could be corroborated by P.A.M.C. Melo, Unpublished data, who observed 3 times more species from 0-20 to 80-100 m.
Another possible explanation for the biodiver-sity values found, can be related with the vortices, disturbances of the thermohaline structure and possibly local mechanisms of resurgence (Araujo and Cintra 2009). The instability generated by these physical forces is consistent with the intermediate disturbance hypothesis (Connell 1978), which suggests that the maximum diversity of a community may not be found in a more stable system, but at intermediate disturbance levels (Sommer et al. 1993, Flöder and Sommer 1999). At the SPSPA, possible upwelling mechanisms resulting from the interaction of the current with the topography
can cause a superficial increase in diversity in the
vicinity of the archipelago. The diversity in the east and south transects exhibited lower values, probably because of the arrival of nSEC at the forefront of the SPSPA (Araujo and Cintra 2009), which could cause a homogenization of the community in this sector. Studies linking biodiversity assessments with physical oceanography in the area are necessary to elucidate this process.
COPEPOD ABUNDANCE
Copepod abundance in the archipelago was similar to other tropical environments (Hwang et al. 2007, López and Anadón 2008), with a great variation between stations, as shown by other authors for tropical Atlantic environments (Schnack-Schiel et al. 2010, Champalbert et al. 2005).
The archipelago appears to have a major impact on the zooplankton community in the area. A marked decrease in density should be noted with
increasing distance from the SPSPA, with the first distance band already significantly different from
the second, and further bands. Such trends of density reduction can be observed in all transects; however,
the pattern is statistically significant only for the
north transect. It is interesting to observe that after the third distance band, a reduction in variability among the different transects, characterizing the environment around the SPSPA as homogeneous from a 2 km distance, a smaller scale effect than has been suggested by the authors cited earlier. This disagree with Dower and Mackas (1996), who suggest that the community changes only at distances greater than 30 km from a seamount. According to these authors, this may be caused by changes in the depth of the mixed layer and the shoaling of the seamount topography.
Studies show that changes in the zooplankton community occur along the axis of the current (Mackas et al. 1991). Since the cSEC is the main stream acting in the surface layer of the SPSPA waters (Araujo and Cintra 2009), probably the primary change in the community structure should occur along an E-W axis. However, what is actually observed is
a greater variation in the north direction, confirming
that the nSEC's interaction with the SE tradewinds causes a surface transport to the northwest, justifying the high values of density in this direction and the absence of patterns in the S and W.
presented values of nearly 100 ind m-3 in the surface layer (Lo et al. 2004). Thus, the observed values may also be related to a mechanism of concentration resulting from the relationship between topography and hydrodynamics, as suggested by Araujo and Cintra (2009) for the archipelago and observed elsewhere (Hunt and Pakhomov 2003).
In this study, higher densities were observed for C. pavo and U. vulgaris with a greater participation of the last one, like observed by Neumann-Leitão et al. (2008) in the oceanic region of northeastern Brazil. This dominance of U. vulgaris was also observed in another important area of the tropical Atlantic, where a high concentration of tuna was found (Champalbert and Pagano 2002), as well as in the archipelago. Hassett and Boehlert (1999), in a study on the distribution of U. vulgaris in the Hawaiian archipelago, noticed a declining trend with distance from the islands, as was noted for our east transect. Woodd-Walker (2001), studying the equatorial Atlantic at a generic level, found the same pattern, with a greater importance of Calocalanus in relation to Undinula, recording densities of 1.3 and 0.4 ind m-3, respectively.
BIOMASS AND PRODUCTION
The biomass and production values obtained for the three most abundant species of copepod (> 300 µm) around the SPSPA showed a similar pattern to that seen in studies of biomass of zooplankton communities in the vicinity of seamounts (Saltzman and Wishner 1997, Martin and Nellen 2004, Martin and Christiansen 2009). The biomass enrichment and increased production around seamounts are of great importance for higher trophic levels, such as the small and
medium-sized pelagic fish that feed on this high primary
productivity, which are subsequently captured by larger species such as tuna (Sund et al. 1981). This effect along the trophic web makes the areas around islands, banks and seamounts important
fishing sites for pelagic fish of commercial
importance, as is the case for the SPSPA in the Atlantic (Vaske Jr. et al. 2006). It is noteworthy
that the fishing in the SPSPA occurs in the west
(Vaske Jr. et al. 2006), the lowest production transect, but productive enough to sustain this activity in the area. Often, low values of biomass can be observed as a result of intense grazing by predators (Martin and Christiansen 2009).
Several problems concerning the use of global models to estimate copepod growth have been discussed in recent studies (Liu and Hopcroft 2006a, b, Leandro et al. 2007). Although most of the data compiled to build Hirst-Lampitt model was originated from temperate areas, this model was developed based on data from polar to tropical regions, with temperatures ranging from -2.3 to 29.0 °C (Hirst and Lampitt 1998). However, because this model is based on log transformed data for warmer areas (mainly tropical regions), it usually gives overestimated growth rates. Another problem is related to the fact that most of the growth rate data used to create this model came from moult rate experiments, which may generate biased growth rates (Hirst et al. 2005). On the other hand, as no “ideal” model covering all variables exist, and no standard method has been widely accepted (Muxagata et al. 2012), these global models are still widely used to estimate copepod production (e.g., Dvoretsky and Dvoretsky 2012, Hernández-León et al. 2010, Miyashita et al. 2009, Muxagata et al. 2012).
Compared to other species, U. vulgaris exhibited high numbers of juveniles, directly affecting their values of biomass and production. Neumann-Leitão et al. (2008) observed a high abundance of young stages of U. vulgaris in
superficial oceanic samples, a pattern also observed
(1999). Therefore, the large amount of adults in N1
is possibly related to the intrusion of subsuperficial
water into the surface layer.
Acrocalanus longicornis and C. pavo fluctuated in biomass consistently with the variation in abundances, and dry weight values exhibited little variation, primarily because both species were observed almost exclusively as adults. Gusmão and McKinnon (2009) observed biomass and production values of Acrocalanus gracilis that were higher than those observed for A. longicornis in the present
study. The values reflect the high abundance
observed for A. gracilis in the Timor Sea, Australia (108.14 ind m-3). However, the growth rate of A. longicornis was higher than that found for adults of A. gracilis (0.17 and 0.15 d-1, respectively).
Melo Júnior (2009) noted that the copepod production in a subtropical area from Brazil (Ubatuba) was dominated by very frequent taxa, which accounted for 72.3% of the total production and were thus important indicators of the total productivity of the environment. In the present study, the selected species of copepod appear to
reflect the patterns of production of the SPSPA.
Despite the lack of replication in our study and the scarcity of studies in this area, a trend of declining biodiversity and production with increasing distance from archipelago was observed, suggesting that even small features like the SPSPA can affect the copepod community in tropical oligotrophic oceanic areas.
ACKNOWLEDGMENTS
This work was funded by the Conselho Nacional de
Desenvolvimento Científico e Tecnológico (CNPq).
We thank CNPq, for the scholarship granted to PAMCM (#140219/2009-9) during the course of this study. The authors also wish to thank the Brazilian Navy for their important support during the stay in the Archipelago of Saint Paul and Saint Peter and the anonymous reviewers and the associate editor for their thoughtful comments and suggestions.
RESUMO
O arquipélago de São Pedro e São Paulo (ASPSP) está localizado próximo ao Equador, no oceano Atlântico. O objetivo deste estudo foi avaliar variações espaciais nos padrões de abundância da comunidade de Copepoda, e da biomassa e produção das três espécies de Calanoida mais abundantes no ASPSP. Amostras de plâncton foram coletadas com rede com 300 µm de abertura de malha, ao longo de quatro transectos (norte, leste, sul e oeste do ASPSP), com quatro estações cada. Todos os transectos exibiram uma tendência de redução da densidade dos Copepoda com o aumento da distância do ASPSP, pro-vado estatisticamente para o Norte. A densidade variou de 3,33 a 182,18 ind.m-3, e diferenças também foram
observadas entre o primeiro perímetro (primeira faixa de distância circular) e os demais. A biomassa total variou de 15,25 a 524,50 10-3
mg C m-3
e a produção de 1,19 a 22,04 mg C m-3d-1. A biomassa e produção de Undinula vulgaris
(Dana, 1849), Acrocalanus longicornis Giesbrecht, 1888 e Calocalanus pavo (Dana, 1849) apresentaram diferenças entre alguns transectos. Uma tendência de declínio da biodiversidade e produção com o aumento da distância do arquipélago foi observada, sugerindo que pequenas feições como o ASPSP podem afetar a comunidade em áreas oceânicas oligotróficas tropicais.
Palavras-chave: oligotrófico, plâncton, Arquipélago de São Pedro e São Paulo, tropical, ressurgência.
REFERENCES
ARAUJO M AND CINTRA M.2009. Modelagem matemática da circulação oceânica na região equatorial do Arquipélago de São Pedro e São Paulo. In: HAZIN FHV (Ed), O Arquipélago de São Pedro e São Paulo: 10 anos de Estação Científica, Brasília: SECIRM, p. 107114.
AYRES M, AYRES JR. M, AYRES DL AND SANTOS AAS.2007.
BioEstat: Aplicações estatísticas nas áreas das ciências bio-médicas. Belém: CNPq/Wild Life Conservation Society, 364 p.
BERASATEGUI AD, RAMÍREZ FC AND SCHIARITI A. 2005.
Patterns in diversity and community structure of epipelagic copepods from the BrazilMalvinas Confluence area, South-western Atlantic. J Marine Syst 56: 309-316.
BJÖRNBERG TKS. 1981. Copepoda. In: BOLTOVSKOY D
BOEHLERT GW AND GENIN A.1987. A review of the effects of seamounts on biological processes. In: KEATING BH, FRYER P, BATIZA R AND BOEHLERT GW (Eds), Seamounts Islands and Atolls: American Geophysical Union Washington, p. 319-334.
BOLTOVSKOY D.1981. Atlas del zooplancton del Atlántico Sudoccidental y métodos de trabajo con el zooplancton marino. Mar del Plata: INIDEP, 936 p.
BRANDT P, SCHOTT FA, PROVOST C, KARTAVTSEFF A,
HORMANN V, BOURLÈS B AND FISCHER J. 2006. Circulation in the central equatorial Atlantic: Mean and intraseasonal to seasonal variability. Geophysi Res Lett 33: L07609. BRUGNANO C, BERGAMASCO A, GRANATA A, GUGLIELMO L
AND ZAGAMI G. 2010. Spatial distribution and community structure of copepods in a central Mediterranean key region (Egadi Islands-Sicily Channel). J Marine Syst 81: 312-322.
CAMPOS TFC.2004. Proposta de sítio geológico do Brasil para registro no Patrimônio mundial. World Heritage Commitee - UNESCO.
CATALÁN IA, ALEMANY F, MORILLAS A AND MORALES-NIN B.
2007. Diet of larval albacore Thunnus alalunga (Bonnaterre, 1788) off Mallorca Island (NW Mediterranean). Sci Mar 71: 347-354.
CAVALCANTI EAH AND LARRAZÁBAL MEL. 2004. Macrozoo-plâncton da Zona Econômica Exclusiva do Nordeste do Brasil (segunda expedição oceanográfica REVIZEE/NE II) com ênfase em Copepoda (Crustacea). Rev Bras Zool 21: 467-475.
CHAMPALBERT G AND PAGANO M. 2002. Copepod feeding in a tuna fishery area of the tropical Atlantic Ocean. C R Biologies 325: 171-177.
CHAMPALBERT G, PAGANO M, KOUAMÉ B AND RIANDEY V.
2005. Zooplankton spatial and temporal distribution in a tropical oceanic area off West Africa. Hydrobiologia 548: 251-265.
CONNELL JH. 1978. Diversity in tropical rain forest and coral reefs. Science 199: 1302-1310.
CORNILS A, SCHULZ J, SCHMITT P, LANURU M, RICHTER C AND
SCHNACK-SCHIEL SB. 2010. Mesozooplankton distribution in the Spermonde Archipelago (Indonesia, Sulawesi) with special reference to the Calanoida (Copepoda). Deep Sea Research Part II: Topical Studies in Oceanography 57: 2076-2088.
DEEVEY GB AND BROOKS AL. 1977. Copepods of the Sargasso Sea off Bermuda: species composition, and vertical and seasonal distribution between the surface and 2000 m. B Mar Sci 27: 256-291.
DE FOREST L AND DRAZEN J. 2009. The influence of a
Hawaiian seamount on mesopelagic micronekton. Deep Sea Research Part I: Oceanographic Research Papers 56: 232-250.
DOWER JF AND MACKAS DL. 1996. ‘‘Seamount effects’’ in the zooplankton community near Cobb Seamount. Deep Sea Research Part I: Oceanographic Research Papers 43: 837-858.
DVORETSKY V AND DVORETSKY A. 2012. Estimated copepod production rate and structure of mesozooplankton communities in the coastal Barents Sea during summer– autumn 2007. Polar Biol 35: 1321-1342.
EDWARDS A AND LUBBOCK R. 1983. The ecology of Saint Paul’s Rocks (Equatorial Atlantic). J Zool 200: 51-69. FLÖDER S AND SOMMER U. 1999. Diversity in planktonic
communities: an experimental test of the intermediate disturbance hypothesis. Limnol Oceanogr 44: 1114-1119. GALLIENNE CP AND ROBINS DB. 2001. Is Oithona the most
important copepod in the world's oceans? J Plankton Res 23: 1421-1432.
GENIN A. 2004. Bio-physical coupling in the formation of zoo-plankton and fish aggregations over abrupt topographies. J Marine Syst 50: 3-20.
GENIN A, GREENE C, HAURY L, WIEBE P, GAL G, KAARTVEDT
S, MEIR E, FEY C AND DAWSON J. 1994. Zooplankton patch dynamics: daily gap formation over abrupt topography. Deep Sea Research Part I: Oceanographic Research Papers 41: 941-951.
GIAROLLA E, NOBRE P, MALAGUTTI M AND PEZZI LP. 2005. The Atlantic Equatorial Undercurrent: PIRATA observations and simulations with GFDL Modular Ocean Model at CPTEC. Geophys Res Lett 32: L10617.
GUSMÃO LFM AND MCKINNON AD. 2009.Acrocalanus gracilis
(Copepoda: Calanoida) development and production in the Timor Sea. J Plankton Res 31: 1089-1100.
HASSETT RP AND BOEHLERT GW. 1999. Spatial and temporal distributions of copepods to leeward and windward of Oahu, Hawaiian Archipelago. Mar Biol 134: 571-584. HAURY LR, YAMAZAKI H AND ITSWEIRE EC. 1990. Effects of
turbulent shear flow on zooplankton distribution. Deep Sea Research Part I: Oceanographic Research Papers 37: 447-461.
HERNÁNDEZ-LEÓN S, FRANCHY G, MOYANO M, MENÉNDEZ I,
SCHMOKER C AND PUTZEYS S. 2010. Carbon sequestration and zooplankton lunar cycles: Could we be missing a major component of the biological pump? Limnol Oceanogr 55: 2503-2512.
HIRST AG AND KIØRBOE T. 2002. Mortality of marine planktonic copepods: Global rates and patterns. Mar Ecol-Prog Series 230: 195-209.
HIRST AG AND LAMPITT RS. 1998. Towards a global model of in situ weightspecific growth in marine planktonic copepods. Mar Biol 132: 247-257.
HIRST AG, PETERSON WT AND ROTHERY P. 2005. Errors in juvenile copepod growth rate estimates are widespread: problems with the Moult Rate method. Mar Ecol-Prog Series 296: 263-279.
HUNT BPV AND PAKHOMOV EA. 2003. Mesozooplankton
interactions with the shelf around the sub-Antarctic Prince Edward Islands archipelago. J Plankton Res 25: 885-904. HWANG JS, DAHMS HU, TSENG LC AND CHEN QC. 2007.
KANG YS AND HONG SY. 1995. Occurrences of oceanic warm-water calanoid copepods and their relationship to hydrographic conditions in Korean waters. Bull Plankton Soc Japan 42: 29-41.
KIØRBOE T. 1998. Population regulation and role of
mesozooplâncton in shaping marine pelagic food webs. Hydrobiologia 363: 13-27.
KIØRBOE T. 2011. What makes pelagic copepods so successful? J Plankton Res 33: 677-685.
LEANDRO SM, MORGADO F, PEREIRA F AND QUEIROGA H.
2007. Temporal changes of abundance, biomass and production of copepod community in a shallow temperate estuary (Ria de Aveiro, Portugal). Estuar Coast Shelf Sci 74: 215-222.
LEIS JM. 1982. Nearshore distributional gradients of larval fish
(15 taxa) and planktonic crustaceans (6 taxa) in Hawaii. Marine Biol 72: 89-97.
LIU H AND HOPCROFT RR. 2006a. Growth and development of Metridia pacifica (Copepoda: Calanoida) in the northern Gulf of Alaska. J Plankton Res 28: 769-781.
LIU H AND HOPCROFT RR. 2006b. Growth and development of Neocalanus flemingeri/plumchrus in the northern Gulf of Alaska: validation of the artificialcohort method in cold waters. J Plankton Res 28: 87-101.
LÓPEZ E AND ANADÓN R. 2008. Copepod communities
along an Atlantic Meridional transect: Abundance, sizes tructure, and grazing rates. Deep Sea Research Part I: Oceanographic Research Papers 55: 1375-1391.
LO WT, SHIH CT AND HWANG JS. 2004. Diel vertical migration of the planktonic copepods at an upwelling station north of Taiwan, western North Pacific. J Plankton Res 26: 8997. LUMPKIN R AND GARZOLI SL. 2005. Near-surface circulation
in the Tropical Atlantic Ocean. Deep-Sea Res I 52: 495-518.
MACKAS DL, WASHBURN L AND SMITH SL. 1991. Zooplankton community pattern associated with a California Current cold filament. J Geophys Res 96: 1478114797.
MARTIN B AND CHRISTIANSEN B. 2009. Distribution of zooplankton biomass at three seamounts in the NE Atlantic. Deep Sea Research Part II: Topical Studies in Oceanography 56: 2671-2682.
MARTIN B AND NELLEN W. 2004. Composition and distribution of zooplankton at the Great Meteor Seamount (subtropical North-east Atlantic). Arch Fish Mar Res 51: 89-100. MCKINNON AD, DUGGAN S, BÖTTGER-SCHNACK R, GUSMÃO
LFM AND O'LEARY RA. 2012. Depth structuring of pelagic copepod biodiversity in waters adjacent to an Eastern Indian Ocean coral reef. J Nat Hist: 1-27.
MCKINNON AD, DUGGAN S, CARLETON JH AND B
ÖTTGER-SCHNACK R. 2008. Summer planktonic copepod
communities of Australia’s North West Cape (Indian Ocean) during the 1997-99 El Niño/La Niña. J Plankton Res 30: 839-855.
MELO JÚNIOR M. 2009. Produção secundária e aspectos repro-dutivos de copépodes pelágicos ao largo de Ubatuba (SP, Brasil). Tese de Doutorado, Universidade de São Paulo.
MELO PAMC, DIAZ XFG, MACEDO SJD AND N
EUMANN-LEITÃO S. 2012. Diurnal and spatial variation of the mesozooplankton community in the Saint Peter and Saint Paul Archipelago, Equatorial Atlantic. Marine Biodiversity Records 5: 1-14.
MIYASHITA LK, MELO JÚNIOR M AND LOPES RM. 2009.
Estuarine and oceanic influences on copepod abundance and production of a subtropical coastal area. J Plankton Res 31: 815-826.
MÖLLMANN C, KORNILOVS G, FETTER M AND KÖSTER FW.
2004. Feeding ecology of central Baltic Sea herring and sprat. J Fish Biol 65: 1563-1581.
MOORE HB AND O'BERRY DL. 1957. Plankton of the Florida Current IV. Factors influencing the vertical distribution of some common copepods. Bull Mar Sci 7: 297-315. MUXAGATA E, AMARAL WJA AND BARBOSA CN. 2012. Acartia
tonsa production in the Patos Lagoon estuary, Brazil. ICES J Mar Sci: Journal du Conseil 69: 475-482.
NEUMANN-LEITÃO S, ESKINAZI-SANT’ANNA EM, GUSMÃO
LMO, NASCIMENTO-VIEIRA DA, PARANAGUÁ MN AND
SCHWAMBORN R. 2008. Diversity and distribution of the mesozooplankton in the tropical Southwestern Atlantic. J Plankton Res 30: 795-805.
NEWELL GE AND NEWELL RC. 1963. Marine plankton: a pratical guide. London: Hutchlson Educational, 221 p. OMORI M AND IKEDA T. 1984. Methods in marine zooplankton
ecology. New York: Wiley-Interscience Publications, 331 p. PIELOU EC1977. Mathematical ecology. New York: Wiley, 385 p. PINHEIRO PB. 2004. Biologia do peixe-rei, Elagatis bipinnulatus
(Quoy e Gaimard, 1824) capturado na zona econômica exclusiva (ZEE) do nordeste do Brasil. Dissertação de Mestrado, Universidade Federal de Pernambuco. (Unpublished).
PIONTKOVSKI SA AND LANDRY MR. 2003. Copepod species diversity and climate variability in the tropical Atlantic Ocean. Fish Oceanogr 12: 352-359.
PIONTKOVSKI SA, LANDRY MR, FINENKO ZZ, KOVALEV AV,
WILLIAMS R, GALLIENNE CP, MISHONOV AV, SKRYABIN
VA, TOKAREV YN AND NIKOLSKY VN. 2003. Plankton communities of the South Atlantic anticyclonic gyre. Oceanol Acta 26: 255-268.
POSTEL L, FOCK H AND HAGEN W. 2000. Biomass and Abundance. In: HARRIS RP, WIEBE PH, LENS J, SKJOLDAL HR AND HUNTLEY M (Eds), ICES Zooplankton Methodology Manual, London: Academic Press, p. 83-192.
ROGERS AD. 1994. The biology of seamounts. Adv Mar Biol 30: 305-350.
ROMAN MR, DAM HG, GAUZENS AL, URBAN-RICH J, FOLEY
DG AND DICKEY TD. 1995. Zooplankton variability on the equator at 140°W during the JGOFS EqPac study. Deep Sea Research Part II: Topical Studies in Oceanography 42: 673-693.
SAMEOTO D, WIEBE P, RUNGE J, POSTEL L, DUNN J, MILLER
C AND COOMBS S. 2000. Collecting zooplankton. In:
ROGER H, PETER W, JÜRGEN L, HEIN RUNE S AND MARK H (Eds), ICES Zooplankton Methodology Manual, London: Academic Press, p. 55-81.
SATAPOOMIN S, NIELSEN TG AND HANSEN PJ. 2004. Andaman Sea copepods: spatio-temporal variations in biomass and production, and role in the pelagic food web. Mar Ecol Prog Series 274: 99-122.
SCHNACK-SCHIEL SB, MIZDALSKI E AND CORNILS A. 2010.
Copepod abundance and species composition in the Eastern subtropical/tropical Atlantic. Deep Sea Research Part II: Topical Studies in Oceanography 57: 2064-2075. SHANNON CE. 1948. A mathematical theory of communication.
Bell Syst Tech J 27: 379-423.
SHIMODE S, TODA T AND KIKUCHI T. 2006. Spatio-temporal changes in diversity and community structure of planktonic copepods in Sagami Bay, Japan. Mar Biol 148: 581-597.
SOMMER U, PADISÁK J, REYNOLDS CS AND JUHÁSZ-NAGY P.
1993. Hutchinson’s heritage: the diversity-disturbance relationship in phytoplankton. Hydrobiologia 249: 1-7. STEPHEN R. 1984. Distribution of Calanoid copepods in the
Arabian Sea and Bay of Bengal. Mahasagar: Bulletin of the National Institute of Oceanography 17: 161-171.
STRAMMA L. 1991. Geostrophic transport of the South
Equatorial Current in the Atlantic. J Mar Res 49: 281-294. STRAMMA L, FISCHER J, BRANDT P AND SCHOTT F. 2003.
Circulation, variability and near-equatorial meridional flow in the central tropical Atlantic. In: GONI GJ AND MALANOTTE-RIZZOLI P (Eds), Elsevier Oceanography Series: Elsevier, p. 1-22.
STRICKLER JR1984. Sticky water: a selective force in copepod evolution. In: MEYERS DG AND STRICKLER JR (Eds), Trophic Interactions within Aquatic Ecosystems: Boulder, CO: Westview Press, p. 187-239.
SUND PN, BLACKBURN M AND WILLIAMS F. 1981. Tunas and their environment in the Pacific Ocean: a review. Oceanogr Mar Biol Ann Rev 19: 443-512.
VASKE JR. T, HAZIN FHV AND LESSA RP. 2006. Pesca e hábitos alimentares do peixe-rei, Elagatis bipinnulata (Quoy & Gaimard, 1825) (Pisces: Carangidae) no Arquipélago de São Pedro e São Paulo, Brasil. Arquivo de Ciências do Mar 39: 61-65.
VASKE JR. T, LESSA RP, NÓBREGA M, MONTEALEGRE-QUIJANO
S, MARCANTE SANTANA F AND BEZERRA JR JL. 2005.
A checklist of fishes from Saint Peter and Saint Paul Archipelago, Brazil. J Appl Ichthyol 21: 75-79.
VERITY PG AND SMETACEK V. 1996. Organism life cycles, predation and the structure of marine pelagic ecosystems. Mar Ecol-Prog Series 130: 277-293.
WEBBER MK AND ROFF JC. 1995. Annual structure of the copepod community and its associated pelagic environment off Discovery Bay, Jamaica. Mar Biol 123: 467-479.
WIGGERT JD, HASKELL AGE, PAFFENHÖFER GA, HOFMANN
EE AND KLINCK JM. 2005. The role of feeding behavior in sustaining copepod populations in the tropical ocean. J Plankton Res 27: 1013-1031.
WILSON CD AND BOEHLERT GW. 1993. Population biology of
Gnathophausia longispina (Mysidacea: Lophogastrida) from a central North Pacific seamount. Mar Biol 115: 537-543.