The optimal number of partial least squares components in
genomic selection for pork pH
Número ótimo de componentes nos quadrados mínimos parciais aplicados à seleção genômica para pH da carne suína
Fernanda Gomes da Silveira1, 2, 3 Darlene Ana Souza Duarte2 Lucas Monteiro Chaves3
Fabyano Fonseca e Silva2* Ivan Carvalho Filho2 Marcio de Souza Duarte2 Paulo Sávio Lopes2
Simone Eliza Facioni Guimarães2
ISSNe 1678-4596
INTRODUCTION
The choice of an optimal number of components is still a relevant issue for partial least squares (PLS) and principal component regression (PCR) statistical methods when applied to genomic selection (GS). Methods such as degrees-of-freedom
(DoF) technique, which is based on statistical information theory (KRÄMER & SUGIYAMA, 2011), or cross-validation (CV) approach, which is based on empirical independent data set samples, have been proposed; however, no comparisons between the two methods, with a focus on genomic prediction, have yet been reported in the literature. 1Departamento de Ciências Exatas, Instituto Federal de Minas Gerais (IFMG), Bambuí, MG, Brasil.
2Departamento de Zootecnia, Universidade Federal de Viçosa (UFV), 36570-000, Viçosa, MG, Brasil. E-mail: [email protected]. *Corresponding author.
3Departamento de Ciências Exatas, Universidade Federal de Lavras (UFLA), Lavras, MG, Brasil.
ABSTRACT: The main application of genomic selection (GS) is the early identification of genetically superior animals for traits difficult-to-measure or lately evaluated, such as meat pH (measured after slaughter). Because the number of markers in GS is generally larger than the number of genotyped animals and these markers are highly correlated owing to linkage disequilibrium, statistical methods based on dimensionality reduction have been proposed. Among them, the partial least squares (PLS) technique stands out, because of its simplicity and high predictive accuracy. However, choosing the optimal number of components remains a relevant issue for PLS applications. Thus, we applied PLS (and principal component and traditional multiple regression) techniques to GS for pork pH traits (with pH measured at 45min and 24h after slaughter) and also identified the optimal number of PLS components based on the degree-of-freedom (DoF) and cross-validation (CV) methods. The PLS method out performs the principal component and traditional multiple regression techniques, enabling satisfactory predictions for pork pH traits using only genotypic data (low-density SNP panel). Furthermore, the SNP marker estimates from PLS revealed a relevant region on chromosome 4, which may affect these traits. The DoF and CV methods showed similar results for determining the optimal number of components in PLS analysis; thus, from the statistical viewpoint, the DoF method should be preferred because of its theoretical background (based on the “statistical information theory”), whereas CV is an empirical method based on computational effort.
Key words: SNP, genomic prediction, meat quality.
RESUMO: A principal contribuição da seleção genômica (SG) é a identificação de animais geneticamente superiores para características
de difícil mensuração e/ou avaliadas tardiamente nos animais, tal como o pH da carne suína. Na SG, uma vez que o número de marcadores é geralmente maior que o número de animais genotipados, e tais marcadores são altamente correlacionados (devido ao desequilíbrio de ligação), métodos estatísticos baseados na redução de dimensionalidade têm sido propostos. Dentre estes, destaca-se o Quadrados Mínimos Parciais (PLS) pela simplicidade e alta acurácia de predição. Porém, a determinação do número ótimo de componentes a ser utilizado no PLS ainda se caracteriza como um desafio para a aplicação do método. Assim, objetivou-se aplicar o PLS (e também regressões em componentes principais e a múltipla tradicional) na SG para pH da carne suína (medido aos 45min e às 24 horas após o abate), bem como identificar o número ótimo de componentes por meio dos métodos do grau de liberdade (GL) e validação cruzada (VC). O primeiro é baseado na Teoria de Informação Estatística e VC é empírica e fundamentada em amostras independentes do arquivo original. O PLS superou os demais métodos de regressão, fornecendo predições satisfatórias quando utilizadas apenas informações genotípicas (painel de SNP de baixa densidade). Além disso, os efeitos dos SNPs estimados via PLS possibilitaram identificar uma região relevante no cromossomo 4 que pode influenciar as características estudadas. Os métodos GL e VC foram similares quanto à determinação do número ótimo de componentes na análise PLS, porém o método GL pode ser recomendado devido a sua maior fundamentação estatística.
Palavras-chave: SNP, predição genômica, qualidade de carne.
Pork pH traits are directly related to water retention, tenderness, juiciness, and meat appearance. Furthermore, these traits are evaluated
after slaughter; thus, the identification of genetically
superior individuals for selection can be accomplished through GS methods, such as PLS or PCR. Therefore, we aimed to apply PLS (and also PCR and traditional multiple regression) to GS for pork pH traits (in this case, pH measured at 45min and 24h after slaughter), as well as to identify the optimal number of PLS components based on the DoF and CV methods.
METHODOLOGY
The data was obtained from an F2 population containing 345 animals whose pork pH was measured at 45min (pH45) and 24h (pHu) after slaughter. These measurements were performed by inserting a glass electrode (DIGIMED, DME-CV1) connected to a previously calibrated pH meter (DIGIMED DM-20) into a Longissimus dorsi muscle taken from the region immediately posterior to a pig’s last rib.
DNA was extracted from these animals and subjected to genotyping using a low-density customized SNP (single nucleotide polymorphism) chip with 384 markers based on the Illumina Porcine SNP60 BeadChip. These SNPs were selected
according to QTL positions previously identified for this population using meta-analyses and fine
mapping (HIDALGO et al., 2013; VERARDO et al., 2015). Thus, although a small number of markers were used, this customized SNPchip ensured an appropriate coverage of the relevant genomic regions in this population. After SNP quality-control analysis, a total of 237 SNPs were considered and distributed as follows on Sus scrofa chromosomes: SSC1 (56), SSC4 (54), SSC7 (59), SSC8 (30), SSC17 (25), and SSCX (13), with the average distance within each chromosome equal to 5.17, 2.37, 2.25, 3.93, 2.68, and 11.0 Mb, respectively.
The form components ti (i = 1,...,m) of the PLS method are designed to capture the largest possible amount of information arranged in explanatory variables X1,...,Xp (SNP genotypes, assuming 0, 1, and 2 correspond, respectively, to aa, aA, and AA) in order to predict the dependent variable, Y (pH45 and pHu). According to this approach, the regression equation is expressed as
(1)
where ti are the column vectors that make up the
matrix, T and are estimates of the regression
coefficients between Y and T, ∀i = 1,, m. The
correlation between any pair of components is equal to 0, that is, cor( , )t ti i' =0, ∀ ≠i i '. Thus, the PLS
method reduces the number of terms in the regression equation (1), since this number is usually less than the number of variables, X. The main difference between
the PCR and PLS methods is that the first takes account
of only the explanatory variables in the component construction; whereas the second also takes dependent variables into account (GARTHWAITE, 1994).
DoF are used to quantify the intrinsic complexity of a regression method. According to KRAMER & SUGIYAMA (2011), the complexity of PLS analysis depends upon the collinearity of the predictor variables. The higher the collinearity value, the lower is the complexity; therefore, the lower is the number of DoFs (i.e., the number of components is smaller). KRÄMER et al. (2011) presented an unbiased estimate of DoFs of PLS with m latent components, T=
(
t t1, 2,,tm)
, which is given byP ˆ
DoF (m) 1= + ∂
∂
Ty y
tr
. To calculate the trace of the derivative in (2), it is necessary to use an algorithm based on the orthogonal decomposition of X, which is
unique for fixed y and m (KRAMER & SUGIYAMA,
2011). A more practical way of determining the number of components is CV, by which the original data set is divided into N subsets (folds) and N analyses are performed, such that in each one, one of the subsets is used for validation. Thus, the values predicted by the equations estimated in each analysis can be directly compared with the removed (observed) values. All analyses were performed using R software (R DEVELOPMENT CORE TEAM, 2015) by means of the pcr, pls.model, and pls.cv functions of the plsdof package.
The original population of 345 individuals was fractionated into two different populations: training and validation. In order to separate the groups while taking lower parentage into account, the PEDIGREE VIEWER software was used to provide the two groups with more within-group relationships and fewer relationships between groups. The predicted values from the validation population (Yˆp) were obtained by
, with Xp being the genotypes of the SNP markers of individuals in the validation population and
population is called predictive ability and provides the
efficiency of a GS method. After the best method (PLS,
PCR, and traditional multiple regression) in terms of predictive ability was decided, the absolute values of the estimated marker effects were used to identify possible chromosomal regions (QTLs) directly associated with the studied traits.
RESULTS
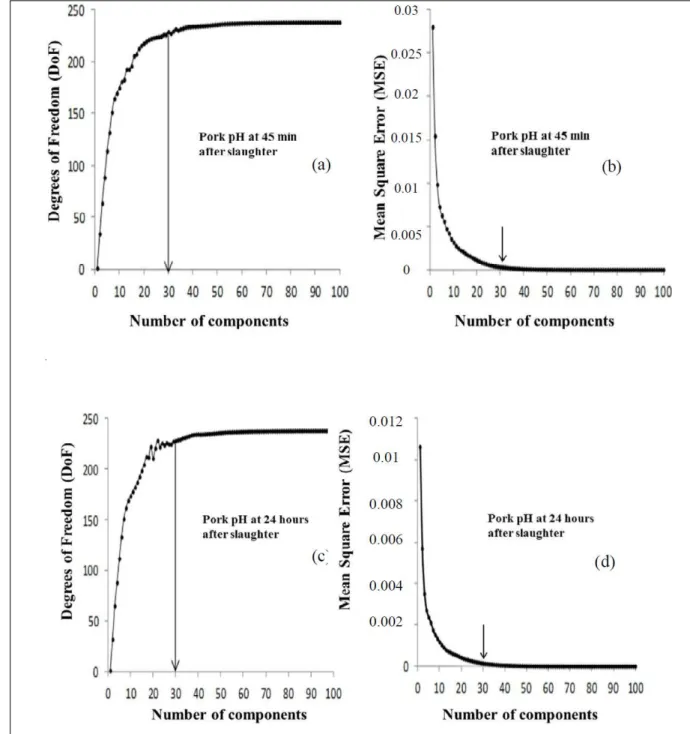
The curves in figure 1 (with DoF and MSE standing, respectively, for “degrees of freedom” and “cross-validation”) indicated that stabilization occurred with 30 components under both methods. Above this value, there was an increase in the
Figure 1 - Optimal number of components in partial least squares (PLS) analysis using the degrees-of-freedom (DoF) method for pH45 (a) and pHu (c), whereas (b) and (d) respectively represent these optimal values based on the cross-validation
complexity of the model, but its performance remained unchanged. Although both methods pointed to the same optimal number of components, the CV method was more expensive in terms of computational demand and; therefore, in practical terms, the DoF method is recommended. However, from a statistical viewpoint, DoF may be preferred because of its theoretical statistical background because CV can be characterized as an empirical method based on computational effort.
Because the optimal number of PLS components was consistently reported to be 30, this number was also used in predictive ability analysis to provide a situation in which the DoF and CV methods were directly comparable. Predictive abilities of the PLS method were 0.84 and 0.81, respectively, for the pH45 and pHu traits; whereas, those for PCR method were, 0.78 and 0.76, respectively. Finally, the traditional ordinary least squares (OLS) multiple regression method provided lower values, 0.39 and 0.33, respectively, for pH45 and pHu.
DISCUSSION
According to AZEVEDO et al. (2014), the advantage of PLS over PCR is due to the fact that the former method takes account of variable response (phenotypic observations) when processing components’ composition, whereas the PCR method considers only the covariates themselves. Poor performance of the OLS method may be due to the lack statistical features to control the problems
of multicollinearity, thereby leading to overfitting
problems (SILVEIRA et al., 2014) when compared to the PLS and PCR methods.
Besides the predictive analysis inherent to genomic selection, it is also interesting to identify the SNP markers with higher estimated effects (CAMPOS et al., 2015) because the PLS method can directly estimate these for each marker. These markers may reveal relevant chromosomal regions affecting each trait. For both phenotypes (pH45 and pHu), the SNP markers ALGA0026103, ALGA0026237, ALGA0026100, ALGA0026241, and ALGA0026109 located on chromosome 4 (between 80 and 90Mbp) presented stronger effects as compared with other markers. Other studies have reported the relevance of this same chromosomal region. Among these, STRATZ et al. (2012) and MA et al. (2013) stands out, who also used F2 populations involving commercial
lines and identified QTL for pH45 at positions of 79.5 and 88.26Mbp, respectively, and PONSUKSILI et al. (2010), which reported QTL for pHu at 82Mbps using different populations derived from the Duroc breed.
CONCLUSION
Both methods (DoF and CV) pointed to the same optimal number of components. From a statistical viewpoint, DoF may be preferable because of its theoretical statistical background because CV is an empirical method based on computational effort.
The PLS method is efficient for genomic selection
(predictive ability is around 80%) for pork pH traits using only genotypic information based on SNP markers. This method revealed a relevant region (around 80 and 90Mbp) on chromosome 4 that may affect the pork pH values measured at 45min and 24h after slaughter.
ACKNOWLEDGEMENTS
To the Coordenação de Aperfeiçoamento de Pessoal de Nível Superior (CAPES), to Fundação de Amparo a Pesquisa do Estado de Minas Gerais (FAPEMIG) and to Conselho Nacional de
Desenvolvimento Científico e Tecnológico (CNPq).
REFERENCES
AZEVEDO, C.F. et al. Supervised independent component analysis as an alternative method for genomic selection in pigs.
Journal of Animal Breeding and Genetics, Malden, v.131, p.452-461, 2014. Available from: <http://onlinelibrary.wiley. com/wol1/doi/10.1111/jbg.12104/full>. Accessed: Jul. 10, 2015. doi: 10.1111/jbg.12104.
CAMPOS, C.F. et al. Genomic selection for boar taint compounds and carcass traits in a commercial pig population. Livestock Science, Amsterdam, v.174, p.10-17, 2015. Available from: <http://www. livestockscience.com/article/S1871-1413(15)00057-8/fulltext>. Accessed: Sept. 03, 2015. doi: 10.1016/j.livsci.2015.01.018. GARTHWAITE, P.H. An interpretation of partial least squares.
Journal of the American Statistical Association, Chapel Hill, v.89, p.122-127, 1994. Available from: <http://amstat.tandfonline. com/doi/abs/10.1080/01621459.1994.10476452>. Accessed: Jan. 10, 2014. doi: 10.1080/01621459.1994.10476452.
HIDALGO, A.M. et al. Fine mapping and single nucleotide polymorphism effects estimation on pig chromosomes 1, 4, 7, 8, 17 and X. Genetics and Molecular Biology, Ribeirão Preto, v.36, p.511-519, 2013. Available from: <http://www.ncbi.nlm.nih. gov/pmc/articles/PMC3873182/>. Accessed: Mar. 27, 2014. doi: 10.1590/S1415-47572013000400009.
KRÄMER, N. et al. The degrees of freedom of partial least squares regression. Journal of the American Statistical Association, Chapel Hill, v.106, p.697-705, 2011. Available from: <http://www. tandfonline.com/doi/abs/10.1198/jasa.2011.tm10107>. Accessed: Jan. 13, 2014. doi: 10.1198/jasa.2011.tm10107.
MA, J. et al. Genome-wide association study of meat quality traits in a white Duroc x Erhualian F2 intercross and Chinese Sutai pigs.
PONSUKSILI, S. et al. Identification of expression QTL (eQTL)
of genes expressed in porcine M. Longissimus dorsi and associated with meat quality traits. BMC Genomics, London,v.11, p.1-14, 2010. Available from: <http://bmcgenomics.biomedcentral.com/ articles/10.1186/1471-2164-11-572>. Accessed: Mar. 08, 2014. doi: 10.1186/1471-2164-11-572.
SILVEIRA, F.G. et al. Tutorial of the partial least square theory with a geometric approach. Revista Brasileira de Biometria, Jaboticabal, v.32, p.59-104, 2014. Available from: <http://jaguar. fcav.unesp.br/RME/fasciculos/v32/v32_n1/indice_v32_n1.php>. Accessed: Jul. 07, 2015.
STRATZ, P. et al. A two-step approach to map quantitative trait loci for meat quality in connected porcine F2 crosses considering main
and epistatic effects. Animal Genetics, Malden, v.44, p.14-23, 2013. Available from: <http://onlinelibrary.wiley.com/doi/10.1111/ j.1365-2052.2012.02360.x/full>. Accessed: Jun. 17, 2015. doi: 10.1111/j.1365-2052.2012.02360.x.