Accessing Financial Data through Virtual Reality
Vítor J. SáUniversity of Minho, Guimarães, Portugal [email protected]
Patrick Dähne
Computer Graphics Center, Darmstadt, Germany [email protected]
Abstract
The current state of information and communication technologies, pointing out the massive use of computer graphics, is instigating new possibilities for data visualization and analysis. Large amounts of data can be represented in an effective way of understanding by the adoption of an appropriate visualization technique. In the present work, we are investigating the use of novel interaction technologies for the visualization of financial data, concretely stock market information. We are using a 3D immersive environment, in which the user is able to interact in a non-obtrusive form, being able to perceive information in several dimensions, as well as to perform interactions in a multi-modal way. Keywords: data visualization, virtual reality and multi-modal interaction
1. Introduction
This paper is based on a project realized at the Computer Graphic Center in Darmstadt in which one of the main goals was to test the use of Virtual Reality (VR) technology in the financial field, more specifically the Stock Market. The motivation was to discover new ways for data visualization and analysis in such a field where people have to deal with very large amounts of data, and for which state-of-the-art systems are still two-dimensional (2D) in most cases.
Therefore, we start at once by presenting the realized prototype and its main functional characteristics as an evolution from the well-known 2D existing systems, then we make the description of the underlying technology concerning the software that was developed and also the hardware we have been coming to use, and finally we present future directions based on the feedback we have already got.
2. Prototype
Following an empirical methodology, we have examined the existing stock market visualization systems, and analyzed how they could be enhanced by the usage of VR technology. Traditionally, the visualization techniques are 2D-oriented, in some cases even using expert systems, but few of them using the human three-dimensional capacity of world perception. 2.1. Related work
The Stock Market is characterized by its dynamics in terms of information flow. The analysis of such changes has a good support by means of 2D graphics, which can be performed locally in the stock exchange or even remotely via Internet, as for instance [Yahoo] and [Wall Street City]. Figures 1 and 2 depict the first step on “using vision to think” [Card 1999] by means of
graphical representations of the raw data. This represents a great step forward in information comprehension that, in same cases, acts together with chart analysis software able to recognize patterns, such as channels, support and resistance lines, triangles, etc. [Chart-Expert]. Some other examples use advanced reasoning systems to improve the information understanding, by applying genetic algorithms, multi-agent technology, autowaves and other bio-computing algorithms, etc. [Autowave Analysis]. Even with the goal of enhancing the user’s understanding of the data, we are not considering these topics since we are only concentrated, by now, on the visual representation of the information. By the same reason, we do not consider real-time access to stock market information, nor even those mobile facilities, such as alerts, Palm or WinCE access, web phone access, etc. [Stock Smart], found already in some systems.
Fig. 1 – Stock market raw data Fig. 2 – 2D data visualization
Considering three-dimensional interactive representations, there are some desktop-based efforts but few transposed to immersive environments. A big effort in this direction is been realized by the New York Sock Exchange with the so-called “3-D Trading Floor”, which aims to consolidate “the data streams of NYSE operational activity into one highly advanced, three-dimensional graphic visualization system” [NYSE].
Adopting a realistic approach, feasible for the time we had available, the system we developed runs efficiently on an inexpensive computing system, allowing an effective test of the involved technology applied to this particular financial area.
2.2. Functionality
The VR application we have developed is based in the BARON virtual table. The device has a display surface of about 1.36 m * 1.2 m, which means a volume of interaction of about 3 m * 3 m * 1.5 m above and in front of the table (width * depth * height). This means that the user can interact with the virtual world within this volume, where his positions and movements have to be precise and efficiently tracked.
We are using video-based tracking with infrared beacons and retrorefective markers, which allows good real-time results even without special light conditions [Dorfmüller 1999]. By this way, the VR system keeps track of the user’s head position, to render the images in the correct perspective, and also of the user’s interaction device, the way the user has to perform direct manipulations.
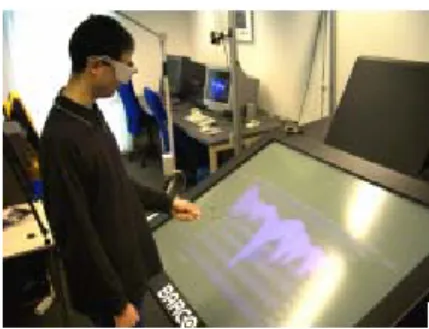
Considering this last aspect, there’s also research in the Computer Graphics Center to allow this kind of hand interaction without the use any device [Malerczyk 2001]. This possible gesture detection together with speech commands are the basis of a non-obtrusive form of interaction that constitutes one of the most relevant characteristics of the VR application we are discussing – the only thing the user needs to use is a pair of slight shutter glasses Further on we will discuss aspects of VR technology and the adopted interaction mechanisms in some more detail. Concerning the functionality of the application itself, we have defined a concrete scenario to represent shares according to the typical dimensions of time, price and volume (figure 3).
Fig. 3 – 3D data visualization
In terms of output, the user perceives all the three values at once, which are evidenced by different projection lines drawn onto the coordinate planes. It is also possible to observe the maximum and minimum price. The system also gives visual and audio feedback according to the user‘s movements of the hand across the 3D representation, in the form of different brightness and sound with different pitch. On user‘s request, the system can switch between shares as well as between viewpoints. These instructions are performed by using speech commands.
Figure 4 – Dynamic 3D representation
On figure 4 we present another visualization metaphor, in which we can analyze several companies at once for a given period of time. In this last example the data is dynamically presented.
For the prototype development we have used state-of-the-art VR technology, which main concepts we will present in the next section.
3. Virtual reality technology 3.1. Basic concepts
Within the VR field, we define taxonomies in accordance to the involved hardware/software, and a broad range of concepts should be depicted. Basically, one can consider five different levels of VR systems. The simplest ones are the desktop systems, based on personal computers with 2D interaction devices; the next are the stereographic systems, normally based on shutter glasses and 3D or 6D input devices; a little further on are the advanced systems in terms of rendering acceleration and input handling, normally going through the use of parallel processors; and, finally, the immersion VR systems, in which we have some type of immersive display system, such as head mounted displays or large projection type displays [Marcos 2002]. Our developments fit the last class of systems, what doesn't impede of being also used in a non-stereographic desktop environment.
An important aspect we should make clear at this point is the distinction between 3D and stereographic images. Most of the 3D images are monoscopic images. They simulate depth using shadows and rendering techniques. The result is a kind of simulated 3D, while
stereoscopic 3D have to be performed by the same way humans perceive the environment around them; each eye seeing two different perspective images, giving rise of the perception of true depth.
A VR program can be broken down into four main constituents: (1) the World Database - the storage of information on objects, their actions, lighting, program controls and hardware device support, in which concepts of hierarchical modeling and edition are needed; (2) the Simulation Processor - the core of a VR program that handles with the interactions, the tasks programmed into the world (collision detection, scripted object actions, etc.), simulation of physical laws, and determines the world status; (3) the Rendering Process – the way the internal mathematical model of a scene is made visible, usually referring the algorithmic realization of the effects of lighting, surface, color, texture and reflection (which concepts have some maturity inherited from the long history field of Computer Graphics); and (4) the Input Processor – the manipulation of the devices used to input information to the computer, from 2D to 6D position trackers, performed by mechanical, magnetic, optical, inertial or even hybrid methods.
The two major categories of the available VR software are: toolkits – programming libraries, generally for C or C++; and authoring systems – complete programs with graphical user interfaces. In any case, in spite of the current existence of good and modular software, there is still a lack of tools in order to make the interaction process more expressive, natural, flexible and portable.
3.2. The “Avalon” VR system
For the rendering of all visual data we use the VR system “Avalon” developed at ZGDV [Avalon]. Avalon uses the Virtual Reality Modeling Language [VRML] with some extensions as scene description language. The use of VRML has several advantages: (1) the interface is well defined by a non-proprietary, platform and company independent ISO standard; (2) VRML is well adopted. The application developer can use a wide range of VRML modeling tools; (3) VRML and JavaScript are much easier to learn than the C/C++ interfaces often provided by traditional VR toolkits and; (4) VRML is the standard for providing 3D worlds over the Internet.
VRML is designed for applications running on simple desktop PCs. The user looks at a 2D projection of the 3D world that is independent of his actual head position and orientation. He interacts with the 3D world by using a 2D cursor that he can control with his mouse. VRML provides a special “TouchSensor” node that detects the virtual object the user is pointing at by shooting a ray into the scene.
When the Avalon system was developed, the main intention was to use the interaction techniques provided by VRML for 3D projections without doing any modifications to the VRML language elements that describe the 3D scene. It should be possible to display the same VRML file on a 2D browser on a desktop PC using 2D input devices and on our Avalon system on 3D displays using 6D input devices. So, the extensions to the VRML standard provided by Avalon are:
- Support for 3D output devices. Available VRML Browsers are designed for Internet applications running on a desktop PC. Avalon is designed for output on 3D devices like projection walls and HMDs and;
- Support for special input devices like 6D tracking systems, used to determine position and orientation of the observer in the virtual environment.
To achieve this, the concept of the VRML “Viewpoint” and “TouchSensor” nodes had to be extended. The Viewpoint node sets the position and orientation of the camera in the virtual scene. In our Avalon system, this node still sets the global viewing direction into the scene, but we modify the view frustum according to the current head position and orientation of the user
provided by our 6D video tracking system. The TouchSensor node now reacts on the collision of a 3D cursor with objects in the 3D scene. The user controls the 3D cursor with his hand that gets tracked by the tracking system. This way it is possible to interact with the virtual scene in a very simple and natural way by pointing at objects.
The data basis of our application is raw stock market data as shown in figure 1. This data is stored locally in a database or can be downloaded on the fly from a server on the Internet to get up-to-date information. One data record contains share identifier, date, minimum price, average price, maximum price, the price when closing the stock market, and the trade volume. To visualize this kind of data we implemented a set of software filters that create VRML worlds that present different graphical representations of the data. These VRML worlds can be displayed on conventional 2D displays, as we already mentioned, by using a standard VRML browser or on more sophisticated 3D displays like HMDs, projection walls or CAVEs by using Avalon.
With the intention to make the interaction process within virtual worlds more natural and intuitive we are applying multi-modal interaction technology, which is the topic of the next section.
4. Multi-modal interface
In general, multi-modality is the capacity of communicate using different channels and to extract/express meaning automatically. We characterize a multi-modal system by its ability to automatically model the information content in a high level of abstraction. The implied layers to consider when building such a system are basically related with sensor fusion, modality interpretation and cognitive models.
In terms of modality integration, we should be aware of three layers: lexical, syntactic and semantic. The lexical layer corresponds to the binding of hardware primitives to software events, in which temporal issues are of main importance; the syntactic layer is where the sequencing of events is performed, that is the combination of data to obtain a complete command, and; the semantic layer is related to the functional combination of commands in order to generate new, more complex ones. So, in a multi-modal point of view, each individual modality can be in a stage considered semantic by itself, but without having any meaning in the overall context – this means a correct multi-modal syntax, without any meaning or semantic. Still with the intention of clarifying some basic concepts, which are then the differences among multi-modal, multi-media and virtual-reality systems? Well, “multi” means more than one, while modal has two meanings with subtle distinction: modality, which is the same as media (a type of communication channel), and mode, which relates to the state that determines the way information is interpreted. So, multi-modal strives for meaning.
In the status of development we are reporting in this paper, we were still dealing with the different modalities in a separate form, in what concerns the meaning extraction we are proclaiming. Anyway, we have already the first layers for modality integration, which constitutes the basis for a major goal.
4.1. User interaction
Regarding the interaction mechanisms, for the direct manipulation (gesture modality) of the virtual world we are using the tracking system “EOS“, also developed at the Computer Graphics Center. The system uses a stereoscopic approach allowing natural interaction (with 6DOF) within the virtual world via a pointing gesture. This is combined with a speech recognition component to enhance the independent uni-modal inputs by an integrated multi-modal approach [Sá 2001].
Figure 5 – Stereoscopic interaction
Regarding the speech modality, the closer we get to fully unrestricted natural language, the more difficulties we encounter. The use of an artificial language of special commands fulfills our user requirements. For the verbal commands we use software interfaces to state-of-the-art speech technology, provided by industrial recognition/synthesis engines.
In terms of integration of the different modalities we are using a semantic fusion approach, considering the modalities in a so-called late fusion state. This is appropriate when the modes differ substantially in the time scale characteristics of their features, and permits the inclusion of as many modalities as needed. For this purpose we are using “MUMO3D“, a multi-modal interaction framework currently in development. The functional combination of commands in order to generate new, more complex ones, rather trivial at the moment, is being performed by methods such as state machines or parsers (note in our context that state machines are parsers for regular grammars).
4.2. Software framework
It is easy to foresee that the realization of systems capable of interacting with the user in a multi-modal (and intelligent) manner results in complex information processing, due to the number and diversity of the involved components. One way to realize this information processing flow as an architecture is to pipeline the components via procedure calls, or remote procedure calls in the case of a distributed but homogeneous system (in programming language). For distributed and heterogeneous software, this may prove difficult, and the solution lies in agent-based software engineering [Sá 2001b].
The term “agent” is used increasingly to describe a broad range of computational entities and sometimes tends to obscure the differences between different approaches. The two headings under which we can subsume most uses of agents are: the simplification of distributed computing (agents as intelligent resource managers) and, also, the overcoming of user interfaces problems (agents as personal assistants which adapt to the user).
In essence, the several system components are “wrapped” by a layer of software that enables them to communicate via a standard language over TCP/IP. The communication is then processed directly based on some concepts of distributed systems, like asynchronous delivery, triggered responses and multi-casting, or, alternatively, by using a facilitated form. Actually, we are using a facilitated (“hub-spoken”) multi-agent architecture. Due to the bottleneck derived from high-volume data transfer between some components, the facilitator should be “by-passed” putting, for instance, the gesture recognition and gesture understanding component as one single agent, and the user tracker communicating directly with the Rendering process fo the VR system.
5. Conclusion and future work
This document presents developments in the fields of data visualization, virtual reality and multi-modal interaction, with application to a specific area. We have set up a system to be tested by specialists in order to get feedback about usability improvements. It‘s our conviction that this kind of VR systems, with the natural methods of interaction we are developing, leads to a very suitable environment for rapid information perception about the stock market.
Anyway, we have already detected some improvements to be made, which are related with: accessibility and the running environment (alternative devices); the inclusion of valuable information as the currency influence, different trading centers and time zone perspectives; and the use of richer visual metaphors.
The very fast growing in computer processing and telecommunications, and the very intuitive interaction methods that are currently under development, let us optimistic about the generalized use of VR technology, in our ubiquitous and mobile computing world, leading us to the use of alternative, more accessible, devices.
Trying to fill the gap existing between the amount of information that is communicated from the system-to-user and the one communicated from user-to-system, speech and computer vision technologies will play an important role for an effective human-computer interaction, with application in the most diverse areas of business.
6. Acknowledgements
“Fundação para a Ciência e a Tecnologia”, through a scholarship in the context of the Information Society Operational Program (reference PRAXIS XXI/BD/20095/99).
Johannes Behr. 7. References
Autowave Analysis http://www.autowave-analysis.com
Card, S. K., Mackinlay, J. D.; Shneiderman, B., “Readings in Information Visualization”, Morgan Kaufmann Publishers, San Francisco, 1999.
Chart-Expert, http://www.chart-expert.com
Dorfmüller, K., Wirth, H., “Robust tracking for augmented reality using retrorefective markers”, Computers & Graphics, 23 (6), pp. 795-800, 1999.
Avalon VR system, http://www.zgdv.de/~avalon/
Malerczyk, C., “Video based tracking in EMBASSI”, International Status Conference - Lead Projects Human-Computer-Interaction, University of Saarland, Saarbrücken, 2001. Marcos, A., Bernardes, P., Sá, V. J., “Multimedia Technology and 3D Environments used in the
preservation and dissemination of Portuguese Cultural Heritage”, International Conference on Information and Communication Technologies in Education, Badajoz, 2002.
NYSE, http://www.nyse.com/floor/ramp.html
Sá, Vítor J., “User Interfaces for Anyone Anywhere”, Proceedings of the 2nd Conference of the
Sá, V.J., Malerczyk, C., Schnaider, M., “Vision Based Interaction within a Multimodal Framework”, Proceedings of the 10th Conference of the Eurographics Portuguese
Chapter, Lisbon, 2001b.
Stock Smart, http://www.stocksmartpro.com/ows-bin/owa/vpv VRML Specification on-line, http://www.vrml.org/
Yahoo! Finance, http://finance.yahoo.com Wall Street City, http://www.wallstreetcity.com