AR
TICLE
1 Universidade Federal do Rio de Janeiro. R. Professor Aloisio Teixeira Gomes da Silva 50, Granja dos Cavaleiros. 27930-560 Macaé RJ Brasil. naiarasperandio@ yahoo.com.br 2 Departamento de Economia, Universidade Federal de Viçosa (UFV). Viçosa MG Brasil. 3 Departamento de Nutrição, UFV. Viçosa MG Brasil.
The impact of the Bolsa Família Program on food consumption:
a comparative study of the southeast and northeast regions
of Brazil
Abstract The aim of this study was to evaluate the impact of the Bolsa Família Program (PBF) on food consumption in the northeast and south-east regions of Brazil. The database was obtained from the individual food consumption module of the Household Budget Survey conducted in 2008-09. Consumption was assessed through two food records. The food was categorized into four groups: fresh or minimally processed food; culi-nary ingredients; processed food; and ultra-pro-cessed food. To analyze the impact, the propensity score matching method was used, which compares the individual recipients and non-recipients of the PBF in relation to a group of socioeconomic char-acteristics. After the propensity score was calculat-ed, the impact of the PBF was estimated through the nearest-neighbor matching algorithm. In both regions, more than 60% of the daily total calories consumed by PBF recipients came from foods that had not undergone industrial processing. The re-cipients of PBF had a low level of consumption of processed and ultra-processed food in both re-gions, and an increased level of consumption of fresh or minimally processed food in the north-east. The results indicate the importance of adopt-ing intersectoral policies in parallel to the PBF in order to strengthen healthy eating practices.
Key words Food consumption, Social policy,
Pro-cessed food
Naiara Sperandio 1
Cristiana Tristão Rodrigues 2
Sylvia do Carmo Castro Franceschini 3
Sp
er
andio N
Introduction
In the last half of the twentieth century, political, social and cultural changes modified the forms of food production, supply, distribution and con-sumption, as well as the morbidity and mortality
profile of the Brazilian population1.
The implementation of social policies in the areas of education, health, employment and so-cial assistance have contributed to the reduction
of poverty and hunger in Brazil2. On the other
hand, changes in dietary habits, such as the in-creased consumption of processed foods and reduced consumption of foods typical of the na-tional diet, have contributed to an increase in the prevalence of chronic non-communicable
dis-eases3. These changes have been observed at all
socioeconomic levels, including those with lower
incomes3,4.
The consumption of processed and ul-tra-processed foods among the poorest sections of the population may be related to real increas-es in household income levels, increas-especially those
benefiting from income transfer programs4,5.
Increased purchasing power may favor access to industrialized products, which are still relative-ly more expensive than fresh or minimalrelative-ly
pro-cessed foods in Brazil4,6.
The Bolsa Família Program (PBF), which is one of the largest income transfer programs in the world, was created by Provisional Measure No. 132 in October 2003; it was transformed into a Law in 2004 and regulated by Decree No. 5,209/2004. The target population is families liv-ing in poverty (with a monthly per capita income of R$ 77.01 to R$ 154) and extreme poverty (with
a monthly per capita income less than R$ 77)7.
Literature reports highlight the fact that in-come from the program is primarily spent by
recipients on food6,8,9. However, the program’s
effect on changes in the dietary pattern may be influenced by the dependence of families on the income derived from it and the place of residence of the recipients, i.e. families residing in regions with unfavorable socioeconomic contexts, such as the northeast, tend to buy more basic and low-er cost foods, while those residing in economical-ly more developed regions have greater access to industrialized foods and are more likely to buy
them6.
The regional distribution of the PBF in Bra-zil shows that approximately 75% of recipient families live in two important macro-regions, the northeast and southeast, which comprise two-thirds of the Brazilian population and
rep-resent the extremities of uneven development in
Brazil10.
The social and economic contexts in which families receiving PBF reside can produce situ-ations of multiple vulnerabilities that are related to the feeding and nutrition of their members. This makes it important to evaluate the impact of the program on the consumption of food and/or food groups by recipients living in regions with different socioeconomic contexts, which can in-fluence food choices and consequently the quali-ty of food that is consumed.
Therefore, the aim of this study was to evalu-ate the impact of the PBF on food consumption in the northeast and southeast regions of Brazil.
Methods
Sampling and database
The database used in this study came from the Household Budget Survey (POF), which was conducted by the Brazilian Institute of Geog-raphy and Statistics (IBGE) between May 19th 2008 and May 18th 2009. The sample size of this survey was 4,696 census sectors, which corre-sponded to 55,970 households. This constituted a survey with a representative sample of the Bra-zilian population that covered urban and rural areas of all the regions and units of the Brazilian
Federation11. The data referring to the northeast
and southeast regions were used for the present study.
The POF sampling was performed in two stages. The first stage consisted of the geographic and economic stratification of the census sectors (primary sampling units) of the IBGE’s ‘Master Sample of Household Surveys’. The Master Sam-ple sectors were selected by probabilistic sam-pling that was proportional to the number of
households in the sector11.
The second stage consisted of the selection of permanent, private households, which were selected by simple random sampling without re-placement within each sector. The sectors were distributed over 12 months to ensure
represen-tativeness during the four quarters of the year11.
Assessment of food consumption
aúd
e C
ole
tiv
a,
22(6):1771-1780,
2017
was the first study to use a subsample (13,569 households and 34,003 residents) to analyze in-formation regarding the individual food intake of all residents aged 10 years or over in surveyed
households11.
Individuals were instructed to record de-tailed information regarding food intake on two non-consecutive days. Information such as the quantity of food, time of consumption, type of preparation, and place of consumption (inside or outside the home) was included in the food
questionnaire11.
The IBGE researchers reviewed all the food records in order to identify possible errors. After this review, the food consumption information was entered into a portable computer using a specific data entry program. This program con-tained a database of approximately 1,500 food items that were selected from 5,686 records from the 2002-03 POF food and beverage database. In this program, 15 options were available regarding the preparation of food and 106 options regard-ing home-based measures. Foods that were not included in the program database were included
by the researchers11.
Due to the complexity of the POF, situations such as incomplete data and suspicious con-sumption values were observed. Thus, to control the quality of information, a data consistency check procedure (critique and imputation) was carried out, which resulted in the exclusion of 29 individuals whose records were considered to be
incomplete11.
The 1,120 food items – referred to by individ-uals in the records – were analyzed and classified according to the type of industrial processing to which they were submitted before their acquisi-tion, preparation and consumption. The official ‘Food Guide for the Brazilian Population’ was
used as a reference to perform this classification12.
According to this guide, four food categories can be defined depending on the type of process-ing. The first includes fresh or minimally pro-cessed foods, which are those purchased for con-sumption without having undergone any alter-ation after leaving the natural state, or which are subject to minimum changes (cleaning, removal of inedible parts, refrigeration, etc.). Foods like fruits, vegetables, legumes, roots and tubers are some examples of this group. The second cate-gory includes products extracted from foods, or directly from nature, which are used in cooking
preparations, such as oils, fats, sugar and salt12. In
the present study it was decided to denominate this group as culinary ingredients.
The third group covers products essential-ly manufactured with the addition of salt and/ or sugar to a fresh or minimally processed food. The processing techniques include baking, dry-ing, fermentation, packaging in cans or glass, and the use of preservation methods such as salting, brining, curing and smoking; canned vegetables, candied fruits and cheeses are some examples. The last category includes ultra-processed foods whose manufacture involves several stages and processing techniques, as well as the use of var-ious industrial additives (soft drinks, filled cook-ies, fast foods and sweets in general are some
ex-amples)12.
The quantities of food were converted to grams and kilocalories of energy (kcal) based on the ‘Food Conversion Table’ of the personal consumption block. This table was prepared by the IBGE based on data from the ‘Brazilian Food Composition Table’ and from the US ‘Depart-ment of Agriculture Table’, as well as from food
labels11.
Propensity Score matching and the impact of the PBF
Because the individuals in the sample were not randomly distributed in groups of recipients (intervention group) and non-recipients (con-trol group), a technique was used for the two groups in relation to some socioeconomic char-acteristics. The procedure used was propensity score matching (PSM). PSM is one of the most important pairing methods used for the evalua-tion of public policies; it was developed to solve the problem of multidimensionality of pairing since it can be implemented from a single control
variable, the propensity score13.
In this context, the propensity score can be defined as the probability of an individual being a beneficiary of the PBF given their socioeco-nomic characteristics. This makes it possible to adjust the biases between the intervention and control groups. To use this method it is neces-sary to guarantee two hypotheses: 1) the balance of socioeconomic characteristics (this means that sample selection requires that participation in the program is independent of the results); 2) the existence of a common support region (for each intervention group there should be a
corre-sponding control group)13.
socioeco-Sp
er
andio N
nomic characteristics. In this regression analysis the dependent variable was a dummy which as-sumed a value equal to one if they were recipients of the program and zero for non-recipients. The explanatory variables were as follows: average per capita income; number of individuals living in the household; total number of children in the family; total number of children and adolescents; total bathrooms; the existence of an electrical supply; sanitary disposal; garbage collection; type of wall coating; location of the dwelling (ur-ban or rural); gender; skin color of individuals; and level of education of the head of household.
After the propensity score was estimated, the subgroups within the control group with probabilities similar to those of the intervention group were identified. Then, for each block of the propensity score, a test was performed to deter-mine whether the average of each variable used in the model did not differ between recipients and non-recipients (balance of variables). After this stage, a final number of blocks were defined and the calculation of the average treatment effect on the treated (ATT) was performed by the nearest-neighbor matching algorithm, with
replacement13. Using this method, each unit of
the intervention group (beneficiary individual) was paired with a unit from the control group (non-beneficiary) with the closest value for the propensity score.
The ATT was determined to evaluate the im-pact of the PBF on the average total caloric con-sumption (expressed in kcal, per capita, per day) for each of the following food groups: fresh or minimally processed; culinary ingredients; pro-cessed; and ultra-processed.
Data analysis
All the analyses were performed using Stata software, version 12.0, considering the complex design of the sample. The Stata ‘pscore.ado’ ap-plication was used to calculate the propensity score and the ATT. A significance level of 5% was adopted in all the statistical tests.
To characterize the beneficiary and non-ben-eficiary individuals in the two macro-regions, the mean and percentage values of the demograph-ic and socioeconomdemograph-ic variables were estimated. Fisher’s exact test was used to compare differenc-es in proportions, and Student’s t-tdifferenc-est was used for differences in the means.
This study forms part of a larger project en-titled ‘The evaluation of the effectiveness of the Bolsa Família Program in terms of the nutritional
status and food consumption of recipients living in the northeast and southeast of Brazil’, which was approved by the Ethics Committee on Hu-man Research of the Federal University of Viçosa.
Results
The sample for estimating the impact of the PBF on the consumption of food groups in the north-east region totaled 4,260 individuals, of which 17.30% were recipients of the program; in the southeast the sample was 1,715 individuals, of which 7.55% were recipients.
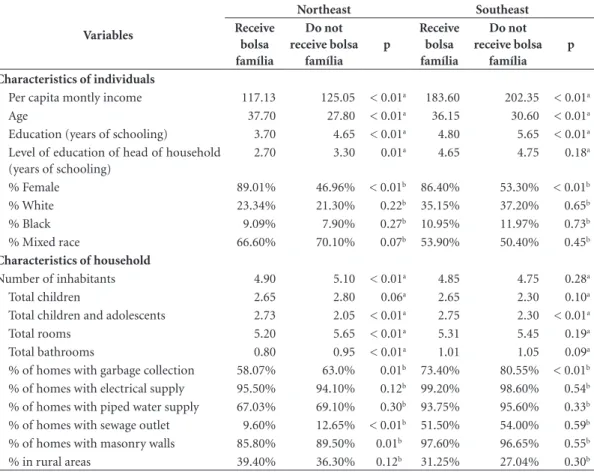
Regarding the socioeconomic disparities in both regions, it was observed that the individuals who were recipients of the program had a lower per capita monthly income, lower education, and were older than non-recipients. Furthermore, the majority were female (Table 1).
The total number of children and adolescents, who are the target of the program, was higher in recipient households in the two regions. Recipi-ents living in the northeast had less access to basic services, such as garbage collection, sewerage and the presence of masonry walls in households, com-pared to non-recipients in this region (Table 1).
The average daily energy consumption of re-cipients in the northeast was 1,410 kcal and that of non-recipients was 1,557 kcal. Approximate-ly 68% of the total energy intake of recipients came from fresh or minimally processed foods. The consumption of ultra-processed foods by non-recipients in this region was 1.8 times high-er than the consumption of recipients (Table 2). In relation to the southeast region, the aver-age daily energy consumption of recipients was 1,467 kcal, and that of non-recipients was 1,636 kcal. Similarly to the northeast, more than 60% of the total energy intake consumed by recipients came from fresh or minimally processed foods. The level of consumption of ultra-processed foods was 1.3 times higher for non-recipients compared to recipients (Table 2).
The calorific intake of processed foods (11.60%) and ultra-processed foods (16.60%) in the total caloric consumption of recipients in the southeast was higher than the results observed for recipients in the northeast (10.40% for pro-cessed foods and 15% for ultra-propro-cessed foods) (Table 2).
aúd
e C
ole
tiv
a,
22(6):1771-1780,
2017
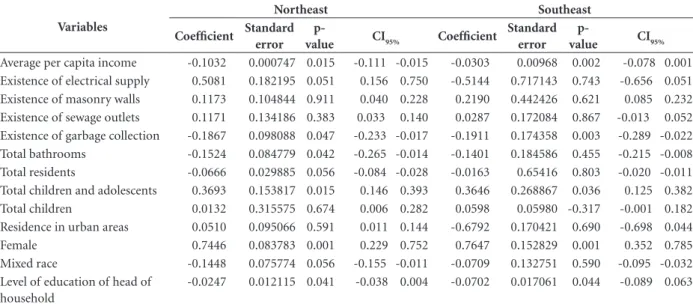
results of the probit estimation models of the propensity score are summarized in Table 3.
For most of the variables, the estimated co-efficient values showed the signs that were ex-pected. In the northeast region, the variables that reduced the probability of participation in the PBF were as follows: higher per capita month-ly income; level of education of the head of the household; the existence of garbage collection; and greater number of bathrooms. In contrast, a higher number of children and adolescents, and being female, increased the chances of participa-tion in the program (Table 3).
In the southeast region, factors such as a higher per capita monthly income, level of ed-ucation of the head of the household, and the presence of a garbage collection service reduced the probability of participation in the program, while, similarly to the situation in the northeast,
a higher number of children and adolescents, and being female, increased the chances of participa-tion in the program (Table 3).
After estimating the probability of participat-ing in the program, the individuals were paired (intervention versus control) according to this probability. This divided the variation of the pro-pensity score into seven different strata or blocks (seven subgroups within the intervention and control groups) that presented similar score val-ues (common support region).
Some observations from the control group were automatically excluded from the sample at the time of pairing because they presented pro-pensity score values outside the common support region. This resulted in a final sample of 4,259 individuals (17.30% of which were program par-ticipants) in the northeast, and 1,515 individuals (8.50% program participants) in the southeast.
Table 1. Socioeconomic and demographic characteristics of a sample of recipients and non-recipients of the Bolsa
Família Program in the northeast and southeast of Brazil. POF 2008-09.
Variables
Northeast Southeast
Receive bolsa família
Do not receive bolsa
família p
Receive bolsa família
Do not receive bolsa
família p
Characteristics of individuals
Per capita montly income 117.13 125.05 < 0.01a 183.60 202.35 < 0.01a
Age 37.70 27.80 < 0.01a 36.15 30.60 < 0.01a
Education (years of schooling) 3.70 4.65 < 0.01a 4.80 5.65 < 0.01a
Level of education of head of household (years of schooling)
2.70 3.30 0.01a 4.65 4.75 0.18a
% Female 89.01% 46.96% < 0.01b 86.40% 53.30% < 0.01b
% White 23.34% 21.30% 0.22b 35.15% 37.20% 0.65b
% Black 9.09% 7.90% 0.27b 10.95% 11.97% 0.73b
% Mixed race 66.60% 70.10% 0.07b 53.90% 50.40% 0.45b
Characteristics of household
Number of inhabitants 4.90 5.10 < 0.01a 4.85 4.75 0.28a
Total children 2.65 2.80 0.06a 2.65 2.30 0.10a
Total children and adolescents 2.73 2.05 < 0.01a 2.75 2.30 < 0.01a
Total rooms 5.20 5.65 < 0.01a 5.31 5.45 0.19a
Total bathrooms 0.80 0.95 < 0.01a 1.01 1.05 0.09a
% of homes with garbage collection 58.07% 63.0% 0.01b 73.40% 80.55% < 0.01b
% of homes with electrical supply 95.50% 94.10% 0.12b 99.20% 98.60% 0.54b
% of homes with piped water supply 67.03% 69.10% 0.30b 93.75% 95.60% 0.33b
% of homes with sewage outlet 9.60% 12.65% < 0.01b 51.50% 54.00% 0.59b
% of homes with masonry walls 85.80% 89.50% 0.01b 97.60% 96.65% 0.55b
% in rural areas 39.40% 36.30% 0.12b 31.25% 27.04% 0.30b Source: prepared by the authors from POF 2008-09 microdata.
Sp
er
andio N
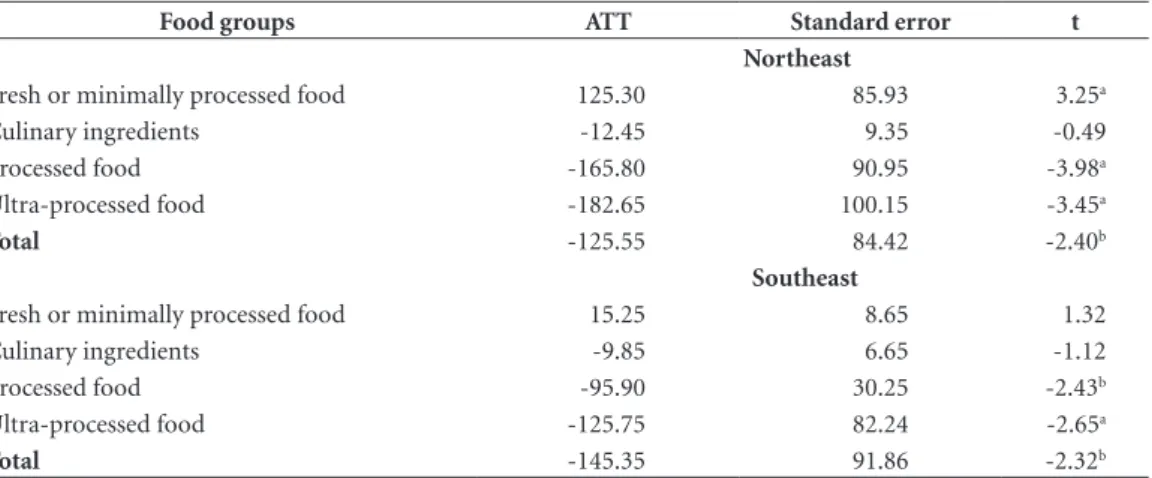
The impact of the PBF (ATT) on the con-sumption of food groups was calculated by using the nearest-neighbor pairing algorithm. In the northeast, recipients of the program had an av-erage consumption of 125 kilocalories more per capita of fresh or minimally processed food than non-recipients. In terms of the consumption of
processed and ultra-processed foods, it was ob-served that recipients of the program consumed, on average, 166 and 183 kilocalories less than non-recipients for these two groups of foods, re-spectively (Table 4).
In the southeast, recipients of the program had a lower consumption of processed food (96
Table 2. Absolute and relative consumption of fresh or minimally processed foods, culinary ingredients,
processed, and ultra-processed foods, of recipients and non-recipients of Bolsa Família Program in the northeast and southeast of Brazil. POF 2008-09.
Food groups
Recipients Non-recipients
Kcal/day % of total
energy intake Kcal/day
% of total
energy intake p
a
Northeast
Fresh or minimally processed foodb 957.50 67.92 886.60 56.93 0.031
Culinary ingredients 95.20 6.75 104.30 6.70 0.062
Processed food 146.25 10.37 214.95 13.80 0.012
Ultra-processed foodc 210.90 14.96 351.55 22.57 0.001
Total 1409.85 1557.40 0.001
Southeast
Fresh or minimally processed foodb 956.78 65.20 945.71 57.81 0.071
Culinary ingredients 97.18 6.62 105.96 6.48 0.068
Processed food 169.65 11.56 206.71 12.64 0.027
Ultra-processed foodc 243.84 16.62 377.35 23.07 0.001
Total 1467.45 1635.73 0.031
a T-test to compare averages. b Includes culinary preparations based on these foods. c Includes alcoholic beverages.
Table 3. Probit model of participation in the Bolsa Família Program in the northeast and southeast of Brazil. POF 2008-2009.
Variables
Northeast Southeast
Coefficient Standard
error p-
value CI95% Coefficient
Standard error
p-
value CI95%
Average per capita income -0.1032 0.000747 0.015 -0.111 -0.015 -0.0303 0.00968 0.002 -0.078 0.001 Existence of electrical supply 0.5081 0.182195 0.051 0.156 0.750 -0.5144 0.717143 0.743 -0.656 0.051 Existence of masonry walls 0.1173 0.104844 0.911 0.040 0.228 0.2190 0.442426 0.621 0.085 0.232 Existence of sewage outlets 0.1171 0.134186 0.383 0.033 0.140 0.0287 0.172084 0.867 -0.013 0.052 Existence of garbage collection -0.1867 0.098088 0.047 -0.233 -0.017 -0.1911 0.174358 0.003 -0.289 -0.022 Total bathrooms -0.1524 0.084779 0.042 -0.265 -0.014 -0.1401 0.184586 0.455 -0.215 -0.008 Total residents -0.0666 0.029885 0.056 -0.084 -0.028 -0.0163 0.65416 0.803 -0.020 -0.011 Total children and adolescents 0.3693 0.153817 0.015 0.146 0.393 0.3646 0.268867 0.036 0.125 0.382 Total children 0.0132 0.315575 0.674 0.006 0.282 0.0598 0.05980 -0.317 -0.001 0.182 Residence in urban areas 0.0510 0.095066 0.591 0.011 0.144 -0.6792 0.170421 0.690 -0.698 0.044 Female 0.7446 0.083783 0.001 0.229 0.752 0.7647 0.152829 0.001 0.352 0.785 Mixed race -0.1448 0.075774 0.056 -0.155 -0.011 -0.0709 0.132751 0.590 -0.095 -0.032 Level of education of head of
household
-0.0247 0.012115 0.041 -0.038 0.004 -0.0702 0.017061 0.044 -0.089 0.063
aúd
e C
ole
tiv
a,
22(6):1771-1780,
2017
kilocalories less than non-participants) and ul-tra-processed food (126 kilocalories less than non-participants). Differently from what was ob-served in the northeast, there was no impact of the program on the consumption of fresh or min-imally processed foods in this region (Table 4).
Discussion
In this study, which used data from two Brazil-ian regions and utilized the propensity score to form similar intervention and control groups, it was found that PBF recipients had a lower con-sumption of processed and ultra-processed foods in both regions, and a higher consumption of fresh or minimally processed foods in the north-east. Even taking into account the socioeconomic discrepancies that exist between these two mac-ro-regions, more than 60% of the daily caloric intake consumed by recipients of the PBF came from foods that did not undergo industrial pro-cessing.
These results, especially those referring to re-cipients of the program residing in the northeast, comply with the central recommendation of the ‘Food Guide for the Brazilian Population’, which states: “Always choose fresh or minimally pro-cessed foods and culinary preparations instead
of ultra-processed foods”12.
Studies reported in the literature regarding the evaluation of the impact of the PBF on food consumption have traditionally analyzed isolated
components, i.e., food and/or nutrients6,9.
How-ever, some researchers have criticized this type of approach and suggested the analysis of the
indus-trial processing of foods14-16, as recommended by
the ‘Food Guide for the Brazilian Population’. The type of industrial processing may influ-ence the forms of production, distribution and commercialization of foods, as well as the nu-tritional composition; however, this approach is still scarcely explored in studies that evaluate and monitor food consumption, even in studies that analyze significant increases in the consumption of processed and ultra-processed foods, and the association of this consumption with the
occur-rence of chronic non-communicable diseases17-19.
The present study is pioneering in using the proposals of the ‘Food Guide for the Brazilian Population’ to evaluate the impact of the PBF on food consumption, comparing two regions that stand out as being at the opposite ends of social and economic development in Brazil. So-cioeconomic disparities between the northeast and southeast regions can influence the impact of the program on food consumption, and this was portrayed in the results, since recipients of the PBF in the northeast presented a higher level of consumption of fresh or minimally processed foods and a lower level of consumption of pro-cessed and ultra-propro-cessed foods compared to recipients living in the southeast.
Other research carried out regarding the Brazilian population has confirmed that the consumption of processed and ultra-processed foods is higher in more economically developed
regions such as the south and southeast20,21.
Table 4. Impact of the Bolsa Família Program on the consumption of food groups in the northeast and southeast
of Brazil. POF 2008-2009.
Food groups ATT Standard error t
Northeast
Fresh or minimally processed food 125.30 85.93 3.25a
Culinary ingredients -12.45 9.35 -0.49
Processed food -165.80 90.95 -3.98a
Ultra-processed food -182.65 100.15 -3.45a
Total -125.55 84.42 -2.40b
Southeast
Fresh or minimally processed food 15.25 8.65 1.32
Culinary ingredients -9.85 6.65 -1.12
Processed food -95.90 30.25 -2.43b
Ultra-processed food -125.75 82.24 -2.65a
Total -145.35 91.86 -2.32b
Source: prepared by the authors from POF 2008-09 microdata.
Sp
er
andio N
In relation to the population that benefits
from the PBF, regional studies9,22 and a national
study6 differ from the present study in that they
report higher levels of consumption of processed foods by recipients of the program; however, those studies did not use pairing through the pro-pensity score to evaluate the impact of the PBF. As previously mentioned, the use of this method to form similar intervention and control groups is recommended to assess the impact of public policies since it minimizes sample selection bias.
Although recipients of the PBF had lower lev-els of consumption of processed and ultra-pro-cessed foods in both regions, it is noteworthy that recipients living in the southeast had a percent-age of energy intake from ultra-processed foods of approximately 17%.
In Brazil, regardless of income level, over the last three decades there has been a reduction in the consumption of basic and traditional foods, such as rice and beans, and conversely the con-sumption of ultra-processed foods, such as cookies and soft drinks, has increased by about 400%20,23. These results demand attention
be-cause processed and ultra-processed foods have an unfavorable nutritional profile, such as higher energy density, higher content of sugar, saturated
fat and trans fats, as well as containing less fiber23.
Some characteristics of these foods favor their excessive consumption, for example, the com-mercialization of large portions, hyper-palatabil-ity, durabilhyper-palatabil-ity, ease of transportation, as well as persuasive and large-scale marketing and
public-ity strategies24,25.
The PBF forms part of a wider agenda of ac-tions to provide social protection and to combat hunger in Brazil; the program is intended for families facing multiple situations of vulnerabili-ty. Despite some controversy about how families spend the money they are allocated, buying food is the main way in which the money is spent. However, food choice is a multi-determinate pro-cess that evolves social, political, economic and
cultural factors26
. It is critical to adopt
intersec-toral measures that reinforce the consumption of fresh or minimally processed foods, especially in regions such as the southeast, where the results of this study showed a higher level of consumption of processed and ultra-processed foods.
It is essential to provide actions linked to the PBF that promote education regarding food and nutrition. However, it is worth noting that adopt-ing adequate and healthy food habits is not a pure-ly individual issue. Education regarding food and nutrition is fundamental to promote healthy
eat-ing because it comprises structural strategies that
range from food production to consumption27.
Adequate and healthy food is a basic human right, which is constitutionally guaranteed, so this guarantee must be a commitment on the part of the state. Consequently, it is crucial to adopt in-trasectorial and intersectoral policies, in conjunc-tion with the PBF, in order to ensure this right.
The use of propensity score matching to es-timate the impact of the PBF, and the use of the new food classification system proposed by the ‘Food Guide for the Brazilian Population’, are highlighted as strengths of this study.
The limitations of this study include the er-rors inherent in the method used to evaluate in-dividual food consumption (the food records). However, other methods of assessing food con-sumption are also subject to errors, and the choice of food records was mainly due to the fact that it was the method that best fitted the PBF’s system of data collection (which is based on re-cording information in a notebook). The POF only includes those aged over 10 years old, which makes it impossible to make inferences about the food consumption of children.
In addition, the POF is a cross-sectional sur-vey that does not allow the temporal analysis of food consumption. Starting in 2011, with the im-plementation of the ‘Brazil without Misery Plan’, important changes occurred within the scope of the PBF such as increased coverage and
increas-es in the monetary value transferred7. Therefore,
continuing the present study (in line with the next publication of the POF) would be interest-ing in order to evaluate trends in the food con-sumption of recipients of the PBF.
Propensity score matching is a technique that was developed to solve the problem of the sizing of pairing. Using this method makes it possible to minimize the errors associated with selection bias and, consequently, recipients and non-recipients of the PBF can be effectively compared. However, it cannot be affirmed that all the variables select-ed for the calculation of the scores were, in fact, the most relevant, because when choosing them the availability of variables investigated by the POF was taken into account.
Conclusions
aúd
e C
ole
tiv
a,
22(6):1771-1780,
2017
The recipients of the Bolsa Família Program
presented lower levels of the consumption of processed and ultra-processed foods in both regions (northeast and southeast) and a higher level of consumption of fresh or minimally pro-cessed foods in the northeast. These results in-dicate that recipients of the program, especially those residing in the northeast, comply with the recommendations of the ‘Food Guide for the Brazilian Population’, which emphasizes the im-portance of the consumption of fresh or mini-mally processed food.
However, studies of the temporal analysis of food consumption in the Brazilian popula-tion have shown an increase in the consump-tion of ultra-processed foods, especially among the lower socioeconomic strata, which illustrates the need to monitor food consumption trends according to the degree of industrial processing
of foods in relation to recipients of the Bolsa
Família Program, so that measures can be adopt-ed to promote adequate and healthy food.
Collaborations
Sp
er
andio N
References
1. Popkin BM. Global nutrition dynamics: the world is shifting rapidly toward a diet linked with noncommu-nicable diseases. Am J Clin Nutr 2006; 84(2):289-298. 2. Santos SMC, Santos LMP. Avaliação de políticas
públi-cas de segurança alimentar e combate à fome no perío-do de 1995-2002 – Abordagem metoperío-dológica. Cad Saude Publica 2007; 23(5):1029-1040.
3. Monteiro CA, Levy-Costa RB, Claro RM, Castro IRR, Cannon G. Increasing consumption of ultra-processed foods and likely impact on human health: evidence from Brazil. Public Health Nutr 2011; 14(1):5-13. 4. Hoffmann R. Desigualdade de renda e das despesas per
capita no Brasil, em 2002- 2003 e 2008-2009, e avalia-ção do grau de progressividade ou regressividade de parcelas da renda familiar. Econ Soc 2010; 19(3):647-661.
5. Monteiro CA, Cannon G, Levy RB, Claro RM, Mou-barac J-C. The Food System. Ultra-processing. The big issue for nutrition, disease, health, well-being. World Nutr 2012; 3(12):527-569.
6. Lignani JB, Sichieri R, Burlandy L. Changes in food consumption among the Programa Bolsa Família partipant families in Brazil. Public Health Nutr 2010; 14(5):785-792.
7. Brasil. Ministério do Desenvolvimento Social e Com-bate à Fome. Bolsa Família. [acessado 2015 maio 15]. Disponível em: http://www.mds.gov.br/bolsafamilia/ beneficios
8. Duarte GB, Sampaio B, Sampaio Y. Programa Bolsa Fa-mília: impacto das transferências sobre os gastos com alimentos das famílias rurais. Rev Econ Sociol 2009; 47(4):903-918.
9. Saldiva SEM, Silva LFF, Saldiva PHN. Avaliação antro-pométrica e consumo alimentar em crianças menores de cinco anos residentes em um município da região do semiárido nordestino com cobertura parcial do programa bolsa família. Rev Nutr 2010; 23(2):221-229. 10. Baptistella JCF. Os impactos dos programas de trans-ferência condicionada de renda na desigualdade do rendimento domiciliar per capita nas macrorregiões brasileiras pós2000. [acessado 2015 jun 21]. Disponível em: http://www3.tesouro.fazenda.gov.br/Premio_TN/ XVPremio/qualidade/3qualidadeXVPTN/Tema_2_3. pdf
11. Instituto Brasileiro de Geografia e Estatística (IBGE).
Pesquisa de Orçamento Familiar (POF):2008-2009: Análise do consumo alimentar pessoal no Brasil. Rio de Janeiro: IBGE; 2011.
12. Brasil. Ministério da Saúde (MS). Guia Alimentar para a população brasileira. Brasília: MS; 2014.
13. Khandker SR, Koolwal GB, Samad HA. Handbook on impact evaluation quantitative methods and practices. Washington: The World Bank; 2010.
14. Fogelholm M, Andressen S, Gunnarsdottir I, La-hti-Koski M. Dietary macronients and foos comsump-tion as determinants of long-term wheigt change in adults population: a systematic literature review. Food Nutr Res 2012; 56.
15. HU FB. Resolved: there is sufficient scientific evidence that decreasing sugar-sweetened beverage consump-tion will reduce the prevalence of obesity and obesi-ty-related diseases. Obes Rev 2013; 14(8):606-619. 16. Willet WC. Nutritional epidemiology. 2nd ed. New York:
Oxford University Press; 1998.
17. Monteiro CA. Nutrition and health: the issue is not food, nor nutrients, so much as processing. Public Health Nutr 2009; 12(5):729-731.
18. Rauber F, Campagnolo PD, Hoffman DJ, Vitolo MR. Consumption of ultra-processed food products and its effects on children’s lipid profiles: a longitudinal study.
Nutr Metab Cardiovasc Dis 2015; 25(1):116-122. 19. Tavares LF, Fonseca SC, Rosa MLG, Yokoo EM.
Rela-tionship between ultra-processed foods and metabolic syndrome in adolescents from a Brazilian Family Doc-tor Program. Public Health Nutr 2012; 15(1):82-87. 20. Levy-Costa RB, Sichieri R, Pontes NS, Monteiro CA.
Disponibilidade domiciliar de alimentos no Brasil: dis-tribuição e evolução (1973-2003). Rev Saude Publica
2005; 39(4):530-540.
21. Martins APB, Levy RB, Claro RM, Moubarac JC, Mon-teiro CA. Participação crescente de produtos ultrap-rocessados na dieta brasileira (1987-2009). Rev Saude Publica 2013; 47(4):656-665.
22. Lima FEL, Fisberg RM, Uchimura KY, Picheth T. Pro-grama Bolsa Família: qualidade da dieta de população adulta do município de Curitiba,PR. Rev Bras Epide-miol 2013; 16(1):58-67.
23. Louzada MLC, Martins APB, Canella DS, Baraldi LG, Levy-Costa RB, Claro RM et al. Alimentos Ultraproces-sados e perfil nutricional da dieta no Brasil. Rev Saude Publica 2015; 49(38):1-11.
24. Diez Garcia RW. Reflexos da globalização na cultura al-imentar: considerações sobre as mudanças na alimen-tação urbana. Rev Nutr. 2003; 16(4):483-492. 25. Batista Filho M, Assis AM, Kac G. Transição
nutricio-nal: conceito e características. In: Kac G, Sichieri R, Gigante DP, organizadores. Epidemiologia Nutricional. Rio de Janeiro: Editora Fiocruz; 2007. p. 445-446. 26. Jomori MM, Proença RPC, Calvo MCM.
Determi-nantes de escolha alimentar. Rev Nutr. 2008; 21(1):63-73.
27. Burlandy L. Transferência Condicionada de Renda e Segurança Alimentar e Nutricional. Cien Saude Colet
2007; 12(6):1441-1451.
Article submitted on 8/8/2015 Approved 16/6/2016