REVISÃO REVIEW
1 Departamento de Educação Física, Universidade Federal do Paraná. R. Coração de Maria 92/Br 116/Km 95, Jardim Botânico. 80.215-370 Curitiba PR Brasil. [email protected] 2 Centro de Desportos, Departamento de Educação Física, Universidade Federal de Santa Catarina.
Epidemiology of physical inactivity, sedentary behaviors,
and unhealthy eating habits among Brazilian adolescents:
a systematic review
Epidemiologia da inatividade física, comportamentos sedentários
e hábitos alimentares não-saudáveis em adolescentes brasileiros:
uma revisão sistemática
Resumo Esta revisão sistemática analisou a pre-valência de inatividade física, comportamentos sedentários e hábitos alimentares não-saudáveis em adolescentes brasileiros. Buscas foram reali-zadas em cinco bases de dados (Lilacs, SciELO, Medline, Web of Science e o Google Scholar) e nas referências dos artigos recuperados. A pesquisa bibliográfica rendeu 5.872 títulos potencialmente relevantes; 69 estudos preencheram todos os crité-rios de inclusão. O comportamento de risco mais frequentemente avaliado foi a inatividade física (48/69; 69,6%), e sua taxa de prevalência variou de 2,3% a 93,5%. Vinte e oito estudos estimaram taxas de inatividade física acima de 50%. A mai-oria dos estudos indicou taxas de inatividade físi-ca superiores entre meninas. As prevalências de comportamentos sedentários (elevado tempo de tela ou usando TV) também esteviveram, frequen-temente, acima de 50%. Diversas variáveis foram utilizadas para a definição de hábitos alimenta-res não saudáveis , e alguns critérios têm indica-do estimativas próximas a 100%. Em conclusão, diversos estudos analisados nesta revisão aponta-ram estimativas de comportamentos de risco em adolescentes brasileiros muito próximas, ou até superiores, às obtidas em países desenvolvidos.
Palavras-chave Fatores de risco, Estilo de vida sedentário, Comportamento alimentar, Jovem, Revisão
Abstract This systematic review analyzed the
prevalence of physical inactivity, sedentary behav-iors and unhealthy eating habits among Brazil-ian adolescents. Searches were conducted in five databases (Lilacs, SciELO, Medline, Web of Sci-ence, and Google Scholar) and in the references cited in the articles retrieved. The literature search yielded 5,872 potentially relevant titles and a total of 69 studies met all the inclusion criteria. The risk behavior most often evaluated was physical inactivity (48/69; 69.6%), and its prevalence rate ranged from 2.3% to 93.5%. Twenty-eight studies estimated the prevalence of physical inactivity at over 50%. Most studies observed the prevalence of greater physical inactivity among girls. The prev-alence of sedentary behaviors (lengthy screen time or TV use) was also frequently over 50%. Several variables were used to identify unhealthy eating habits, and some criteria/studies have indicated unhealthy eating habit estimates at close to 100% among adolescents. In conclusion, the estimates of these risk behaviors among Brazilians adolescents were very close to or even greater than those found in developed countries in several studies analyzed in this review.
Key words Risk factors, Sedentary lifestyle, Ea-ting behavior, Adolescent, Review
Valter Cordeiro Barbosa Filho 1
Wagner de Campos 1
1 7 4
B
ar
b
osa Filho
V
C
et al.
Introduction
Chronic non-communicable diseases (NCDs) are the leading causes of death globally (60% of all deaths), killing more people each year than all other causes combined1. Alarming estimates
sug-gest that NCD deaths will increase 15% globally between 2010 and 20202. Among the
NCD-relat-ed risk factors, the World Health Organization (WHO)1-3 highlights two behaviors that are
per-vasive aspects of economic transition, rapid ur-banization and a 21st-century lifestyle: physical inactivity and unhealthy food habits.
Physical inactivity has been identified as the fourth leading risk factor for global mortality (6% of deaths globally). Physical inactivity over-coming even overweight and obesity (5%) as glo-bal risk factor for mortality4. The available data
also indicate that unhealthy food habits are re-lated strongly to the emergence of NCDs and NCD-related mortality. Approximately 1.7 mil-lion (2.8%) deaths worldwide are attributable to low fruit and vegetable consumption5. Likewise,
low consumption of fruit and vegetables has been directly related to the risk for cardiovascular dis-eases, stomach cancer and colorectal cancer5.
Thus, unhealthy food habits and physical inac-tivity contribute substantially to the global bur-den of disease, death, and disability3,6.
Morbidity and mortality studies have also focused on another NCD behavioral risk factor: sedentary behavior (i.e., too much sitting, as dis-tinct from too little exercise)7. Recent studies had
shown a positive and independent relationship between sedentary behavior and mortality among adults7-9. There is also evidence to suggest that
sedentary behavior has a positive relationship with adverse health outcomes in adults (e.g., car-diovascular diseases and diabetes)10, including
whether the sedentary behavior was adopted during childhood11. Thus, sedentary behavior is
an important area of study and is in need of fur-ther development.
Although physical inactivity, unhealthy food habits, and sedentary behaviors are not the ma-jor behavioral risk factors for morbidity and mortality during adolescence5,12, these behaviors
are frequently interrelated. Additionally, they are often established during childhood and adoles-cence and track into adult life12, having a
consid-erable effect on health at later ages5. Therefore,
the WHO 1 has considered monitoring these
be-haviors during adolescence a priority, and stud-ies have been conducted in adolescents from sev-eral countries12-14.
As a consequence, many local and regional epidemiological studies have been conducted in Brazil concerning physical inactivity, unhealthy food habits, and/or sedentary behaviors among adolescents. To contribute to the development of public policies for health promotion in Brazil, a recent survey involving adolescents from all 26 Brazilian state capitals and the Federal District15
was conducted with the primary purpose of mon-itoring risk behaviors among Brazilian adoles-cents.
The main objective of this systematic review was to analyze the prevalence of physical inactiv-ity, sedentary behaviors, and unhealthy food hab-its in studies including Brazilian adolescents (10-19 years old). This review contributes to the un-derstanding of these behavioral risk factors in Brazilian adolescents who are and who are not included in national studies (i.e., teenagers from small towns) and identifies the primary behav-ioral risk factors in Brazilian youth. As the pat-terns of these behavioral risk factors may differ according to gender6, this review had a
second-ary objective of analyzing differences in these be-havioral risk factors between genders.
Methods
The literature search was performed in June 2011 using the following electronic databases: LILACS, SciELO, PubMed, Web of Science, and the Goog-le Scholar portal. The year and language of pub-lication of the manuscripts were not limited.
ado-lescence OR child*) and nationality (Brazil* OR Brazilian) to locate potentially relevant studies. The Boolean operator “AND” was used for com-binations between the groups. The article search was conducted with keywords in English and Portuguese.
The first author of this study (VCBF) select-ed articles using a systematic method. He first read the article titles. Then, he read abstracts and used the inclusion criteria to analyze the articles. After examining the abstracts, all of the full-text the articles were obtained and included if they met the inclusion criteria. The references for all selected papers were examined to identify other publications that should be reviewed.
The following inclusion criteria were adopted in this review: (i) articles published in peer-re-viewed journals that were original research; (ii) samples included Brazilian adolescents aged 10-19 years (or a mean age within these ranges) or a sample comprising other age years, because the data had been presented separately; (iii) obser-vational studies showing the prevalence of at least one of the behavioral risk factors included in this review, regardless of whether the study dealt with this behavior as an exposure or a response vari-able; (iv) studies using questionnaires or struc-tured interviews as methods for behavior assess-ment; and (v) to be a school- or population-based survey with information about the meth-odological procedures of representation of the target population (i.e., random sampling).
Theses, dissertations and monographs were not included because it was impractical to sys-tematically search them. In cases of duplicates (two or more studies with the same sample), the most recent or the most complete publication was used, and the other publications were excluded.
The following data were extracted: local of the study, sample type, sample size, percentage of girls, age years of adolescents, type and adminis-tration mode of instrument, recall time, and def-inition of the behavioral risk factors. For an ad-ditional description of studies, the Human De-velopment Index (HDI; base year 2000) of the local survey was considered and presented in three categories: low (HDI < 0.600), middle (HDI be-tween 0.600 and 0.799) and high (HDI > 0.800). Studies including the physical inactivity prev-alence were organized into three groups. The first group included studies considering the cutoff point adopted in the Global School-based Stu-dent Health Survey (GSHS; less than 300 min-utes/week of physical activity or moderate-to-vigorous physical activity specifically)13,14, which
was an international survey that identified the physical inactivity prevalence among adolescents from several countries. The second group of stud-ies used other physical inactivity definitions adopted in the literature, while the third group consisted of studies that used the low frequency of participation in physical activities and sports as an indicator of physical inactivity.
The prevalence of sedentary behaviors among Brazilian adolescents has focused on two impor-tant outcomes. The first is related to high screen time use (e.g., playing video games or using a computer) during the day. The second study group focused exclusively on high TV time use.
The studies evaluating the prevalence of un-healthy food habits treated food consumption in two ways: the low consumption of healthy foods (e.g., fruits and vegetables) or the high con-sumption of unhealthy foods (e.g., sweets or soft drinks). Data were also included identifying the prevalence of adolescents who did not meet the WHO recommendations for healthy diet or who had a high fat-rich foods intake (e.g., processed meats and fried chicken), or a low fiber-rich foods intake (e.g., fruits, beans, and rice).
The outcome prevalence and its respective 95% confidence interval (95% CI) were present-ed with the total sample and by gender. The 95% CI was directly from articles15-27, whenever
pos-sible, or calculated using the statistics program Stata 10.0 (Stata Corp., College Station, United States) using the ‘cii’ command (95% CI exact for binomial distribution). The included articles were organized in tables according to the criteria used to identify the behavioral risk factor and in al-phabetical order considering the location of study.
Results
Literature search
1 7 6
B
ar
b
osa Filho
V
C
et al.
was identified by searching the article reference lists and included. Thus, a total of 69 studies were included in this review.
Study characteristics
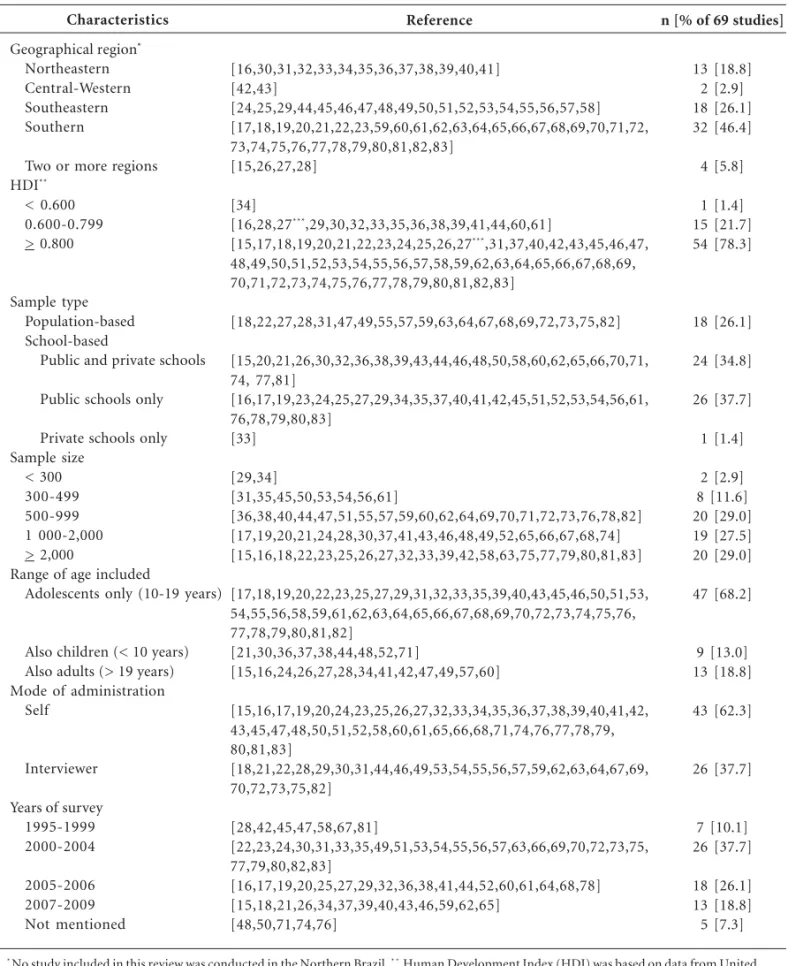
Table 1 shows the main characteristics of the 69 studies included in this review. Most studies
Characteristics
Geographical region* Northeastern Central-Western Southeastern Southern
Two or more regions HDI**
< 0.600 0.600-0.799 > 0.800
Sample type Population-based School-based
Public and private schools
Public schools only
Private schools only Sample size
< 300 300-499 500-999 1 000-2,000 > 2,000
Range of age included
Adolescents only (10-19 years)
Also children (< 10 years) Also adults (> 19 years) Mode of administration
Self
Interviewer
Years of survey 1995-1999 2000-2004
2005-2006 2007-2009 Not mentioned
Reference
[16,30,31,32,33,34,35,36,37,38,39,40,41] [42,43]
[24,25,29,44,45,46,47,48,49,50,51,52,53,54,55,56,57,58] [17,18,19,20,21,22,23,59,60,61,62,63,64,65,66,67,68,69,70,71,72, 73,74,75,76,77,78,79,80,81,82,83]
[15,26,27,28]
[34]
[16,28,27***,29,30,32,33,35,36,38,39,41,44,60,61]
[15,17,18,19,20,21,22,23,24,25,26,27***,31,37,40,42,43,45,46,47,
48,49,50,51,52,53,54,55,56,57,58,59,62,63,64,65,66,67,68,69, 70,71,72,73,74,75,76,77,78,79,80,81,82,83]
[18,22,27,28,31,47,49,55,57,59,63,64,67,68,69,72,73,75,82]
[15,20,21,26,30,32,36,38,39,43,44,46,48,50,58,60,62,65,66,70,71, 74, 77,81]
[16,17,19,23,24,25,27,29,34,35,37,40,41,42,45,51,52,53,54,56,61, 76,78,79,80,83]
[33]
[29,34]
[31,35,45,50,53,54,56,61]
[36,38,40,44,47,51,55,57,59,60,62,64,69,70,71,72,73,76,78,82] [17,19,20,21,24,28,30,37,41,43,46,48,49,52,65,66,67,68,74] [15,16,18,22,23,25,26,27,32,33,39,42,58,63,75,77,79,80,81,83]
[17,18,19,20,22,23,25,27,29,31,32,33,35,39,40,43,45,46,50,51,53, 54,55,56,58,59,61,62,63,64,65,66,67,68,69,70,72,73,74,75,76, 77,78,79,80,81,82]
[21,30,36,37,38,44,48,52,71]
[15,16,24,26,27,28,34,41,42,47,49,57,60]
[15,16,17,19,20,24,23,25,26,27,32,33,34,35,36,37,38,39,40,41,42, 43,45,47,48,50,51,52,58,60,61,65,66,68,71,74,76,77,78,79, 80,81,83]
[18,21,22,28,29,30,31,44,46,49,53,54,55,56,57,59,62,63,64,67,69, 70,72,73,75,82]
[28,42,45,47,58,67,81]
[22,23,24,30,31,33,35,49,51,53,54,55,56,57,63,66,69,70,72,73,75, 77,79,80,82,83]
[16,17,19,20,25,27,29,32,36,38,41,44,52,60,61,64,68,78] [15,18,21,26,34,37,39,40,43,46,59,62,65]
[48,50,71,74,76]
n [% of 69 studies]
13 [18.8] 2 [2.9] 18 [26.1] 32 [46.4]
4 [5.8]
1 [1.4] 15 [21.7] 54 [78.3]
18 [26.1]
24 [34.8]
26 [37.7]
1 [1.4]
2 [2.9] 8 [11.6] 20 [29.0] 19 [27.5] 20 [29.0]
47 [68.2]
9 [13.0] 13 [18.8]
43 [62.3]
26 [37.7]
7 [10.1] 26 [37.7]
18 [26.1] 13 [18.8] 5 [7.3]
* No study included in this review was conducted in the Northern Brazil. * * Human Development Index (HDI) was based on data from United Nations Development Programme for different cities and regions of Brazil, reference year 2000. * * * Nahas et al. 27 included adolescents from Recife (HDI = 0.797) and Florianópolis (HDI = 0.875), and thus was cited twice.
were conducted in Southern Brazil (46.4%), and no study included in this review was performed with adolescents from Northern Brazil. Most stud-ies were conducted in sites with a high HDI (78.3%). Only one study (1.4%) was performed in a city with a low HDI. Most studies (73.9%) were school-based surveys, and a predominance of studies included only adolescents from public schools (37.7%). The sample size of included stud-ies varied from 10529 to 60,97315,26 individuals.
Several studies had sample sizes of 500-999 or more than 2,000 individuals (20 studies in each category). Finally, several studies included only adolescents in the sample (68.2%), used self-re-ports to fill out of the questionnaires (62.3%), and were conducted between 2005 and 2009 (42.0%).
Prevalence of physical inactivity
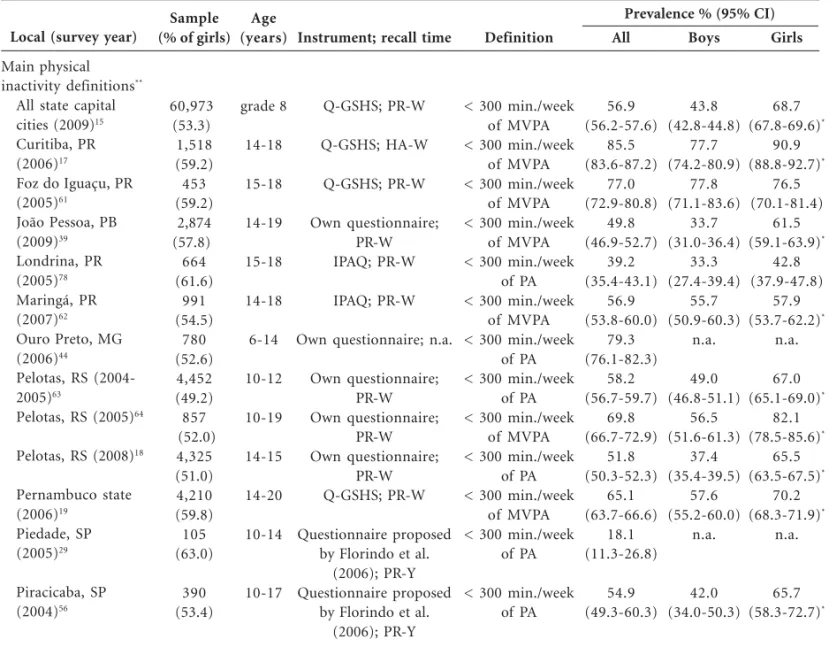
Table 2 shows some characteristics of the stud-ies evaluating the physical inactivity prevalence. A total of 48 studies included this outcome, and the physical inactivity prevalence ranged from 2.3% (95% CI: 1.3-3.8)60 to 93.5% (95% CI: 92.0-94.8)30.
Only four studies (8.3%)26,46,51,60 showed a
phys-ical inactivity prevalence of less than 20%, while 28 studies (58.3%)15,17-21,24,25,28,30-35,44-47,61-69
estimat-ed a physical inactivity prevalence above 50%. Nineteen studies used the GSHS physical in-activity definition, and the lowest physical inac-tivity prevalence was found in Piedade, SP (18.1%; 95% CI: 11.3-26.8)29, and the highest was found
in Curitiba, PR (85.5%; 95% CI: 83.6-87.2)17. Of
the 19 studies, thirteen (68.4%)15,17-20,24,25,31,44,61-64
Local (survey year)
Main physical inactivity definitions**
All state capital cities (2009)15
Curitiba, PR (2006)17
Foz do Iguaçu, PR (2005)61
João Pessoa, PB (2009)39
Londrina, PR (2005)78
Maringá, PR (2007)62
Ouro Preto, MG (2006)44
Pelotas, RS (2004-2005)63
Pelotas, RS (2005)64
Pelotas, RS (2008)18
Pernambuco state (2006)19
Piedade, SP (2005)29
Piracicaba, SP (2004)56
Sample (% of girls)
60,973 (53.3) 1,518 (59.2) 453 (59.2) 2,874 (57.8) 664 (61.6)
991 (54.5)
780 (52.6) 4,452 (49.2) 857 (52.0)
4,325 (51.0) 4,210 (59.8) 105 (63.0)
390 (53.4)
Age (years)
grade 8
14-18
15-18
14-19
15-18
14-18
6-14
10-12
10-19
14-15
14-20
10-14
10-17
Instrument; recall time
Q-GSHS; PR-W
Q-GSHS; HA-W
Q-GSHS; PR-W
Own questionnaire; PR-W IPAQ; PR-W
IPAQ; PR-W
Own questionnaire; n.a.
Own questionnaire; PR-W Own questionnaire;
PR-W Own questionnaire;
PR-W Q-GSHS; PR-W
Questionnaire proposed by Florindo et al.
(2006); PR-Y Questionnaire proposed
by Florindo et al. (2006); PR-Y
Definition
< 300 min./week of MVPA < 300 min./week
of MVPA < 300 min./week
of MVPA < 300 min./week
of MVPA < 300 min./week
of PA < 300 min./week
of MVPA < 300 min./week
of PA < 300 min./week
of PA < 300 min./week
of MVPA < 300 min./week
of PA < 300 min./week
of MVPA < 300 min./week
of PA
< 300 min./week of PA
All
56.9 (56.2-57.6)
85.5 (83.6-87.2)
77.0 (72.9-80.8)
49.8 (46.9-52.7)
39.2 (35.4-43.1)
56.9 (53.8-60.0)
79.3 (76.1-82.3)
58.2 (56.7-59.7)
69.8 (66.7-72.9)
51.8 (50.3-52.3)
65.1 (63.7-66.6)
18.1 (11.3-26.8)
54.9 (49.3-60.3)
Boys
43.8 (42.8-44.8)
77.7 (74.2-80.9)
77.8 (71.1-83.6)
33.7 (31.0-36.4)
33.3 (27.4-39.4)
55.7 (50.9-60.3)
n.a.
49.0 (46.8-51.1)
56.5 (51.6-61.3)
37.4 (35.4-39.5)
57.6 (55.2-60.0)
n.a.
42.0 (34.0-50.3)
Girls
68.7 (67.8-69.6)*
90.9 (88.8-92.7)*
76.5 (70.1-81.4)
61.5 (59.1-63.9)*
42.8 (37.9-47.8)
57.9 (53.7-62.2)*
n.a.
67.0 (65.1-69.0)*
82.1 (78.5-85.6)*
65.5 (63.5-67.5)*
70.2 (68.3-71.9)*
n.a.
65.7 (58.3-72.7)*
Table 2. Description of the prevalence of physical inactivity (%) among Brazilian adolescents and its respective 95%
confidence interval (95% CI, entire sample and by gender) of each study included in this review according to local and year of survey, sample, age, instrument, and definition of physical inactivity.
it continues
1 7 8 B ar b osa Filho V C et al.
Local (survey year)
Main physical inactivity definitions**
Rio de Janeiro, RJ (2003)24
Salvador, BA (2000-2001)31
Salvador, BA (2007-2008)40
Santa Catarina state (2001)79
São Paulo, SP (2006)25
Três de Maio, RS (2006)20
Others physical inactivity definitions
Belo Horizonte, MG (2002-2003)57
Belo Horizonte, MG (n.a.)48
Capão da Canoa, RS (2004)70
Caxias do Sul, RS (2007)65
João Pessoa, PB (2005)32
Florianópolis, SC (2001)66
Lages, SC (n.a.)74
Lapa, PR (2005)60
Maceió, AL (2001)30
Niterói, RJ (1997-1998)45
Presidente Prudente, SP (2007)46
Recife, PE (2002)33
Recife, PE and Florianopolis, SC (2006)27
Simão Dias, SE (2007)34
Sample (% of girls)
1,684 (52.8) 426 (48.6) 694 (52.7) 5,028 (59.3) 3,845 (52.6) 660 (52.0) 563 (54.0) 1,450 (53.0) 719 (50.2) 1,675 (53.2) 2,768 (55.9) 1,107 (52.1) 1,024 boys 608 (60.7) 1,253 (56.3) 325 (62.1) 1,630 (54.0) 2,271 (55.0) 2,147 (55.7) 281 (61.9) Age (years) grade 8 10-18 10-14 15-19 14-19 14-19 15-24 6-18 11-13 11-17 14-18 15-18 1 2-17 14-20 7-17 14-15 11-17 14-19 15-24 Mean = 17.4
Instrument; recall time
Q-GSHS; PR-W
3DPAR adapted by Pires et al. (2001); n.a. Questionnaire proposed
by Florindo et al. (2006); PR-Y Q-GSHS; HA-W IPAQ; PR-W Own questionnaire; PR-W IPAQ; PR-W
1DPAR proposed by Sallis et al. (1993); PR-D Questionnaire proposed by Pate et al. (1995); n.a.
3DPAR adapted from Bouchard et al. (1983);
PR-W 3DPAR adapted from Bouchard et al. (1983);
PR-W 3DPAR adapted from Bouchard et al. (1983);
PR-W 3DPAR adapted from Bouchard et al. (1983);
PR-W IPAQ; PR-W
PAQ-C; PR-W
PAQ-C; PR-W
Questionnaire proposed by Baecke et al. (1982);
PR-4M Questionnaire proposed
by Marcus et al. (1994) Own questionnaire;
PR-W
Questionnaire proposed by Marcus et al. (1994)
Definition
< 300 min./week of MVPA < 300 min./week
of MVPA < 300 min./week
of MVPA
< 300 min./week of MVPA < 300 min./week
of PA < 300 min./week
of MVPA
IPAQ criterion
lower quartile of EE < 12 points in
questionnaire scores EE < 37 kcal/kg/
day
EE < 37 kcal/kg/ day
EE < 37 kcal/kg/ day
EE < 37 kcal/kg/ day
IPAQ criterion
< 2 points in PAQ-C scores < 2 points in PAQ-C scores < 240 min./week
of MVPA
Stages 1-3 from SEBC 0 days/week of
MVPA
Stages 1-3 from SEBC All 59.9 (57.5-62.2) 65.0 (60.3-69.5) 39.6 (36.0-43.4) 36.5 (35.1-37.9) 62.5 (60.5-64,1) 61.2 (56.2-65.9) 34.2 (30.2-38.3) 22.6 (20.5-24.9) 36.9 (33.3-40.5) 55.8 (53.3-58.2) 55.9 (54.0-57.7) 63.1 (60.1-65.9) 29.4 (26.6-32.3) 2.3 (1.3-3.8) 93.5 (92.0-94.8) 91.1 (87.4-93.9) 84.9 (83.1-86.6) 61.6 (59.6-63.6) 10.7 (9.4-12.1) 65.8 (60.0-71.4) Boys 44.8 (41.2-48.3) n.a. 28.0 (23.2-33.2) 26.1 (24.2-28.1) 49.7 (47.4-52.1) 52.4 (46.7-58.0) n.a. n.a. n.a. 43.2 (39.7-46.8) 45.5 (42.7-48.3) 52.1 (47.6-56.4) n.a. 1.7 (0.5-4.2) 90.3 (87.5-92.7) 86.2 (78.8-91.7) 78.3 (75.1-81.2) 51.4 (48.3-54.5) 5.3 (3.9-6.9) 52.3 (42.5-62.1) Girls 73.9 (70.1-76.8)* n.a. 50.0 (44.8-55.2)* 43.7 (41.9-45.5)* 74.1 (72.1-76.0)* 69.4 (64.2-74.2)* n.a. n.a. n.a. 66.8 (63.6-70.0)* 64.2 (61.8-66.6)* 78.3 (74.6-81.6)* n.a. 2.7 (1.3-4.9) 96.0 (94.3-97.3)* 94.1 (89.9-96.9) 90.6 (88.4-92.5)* 70.0 (67.3-72.5)* 15.0 (13.0-17.1)* 74.1 (67.0-80.5)*
Table 2. Continuation
it continues
estimated a physical inactivity prevalence above 50%.
Thirty-two studies (66.7%) evaluated the prevalence of physical inactivity by gender. Only one study61 demonstrated a physical inactivity
prevalence that was slightly higher among boys.
All other studies showed the highest physical in-activity prevalence among girls, with the magni-tude of difference ranging from 1.0%60 to 29.1%24.
In 28 of these studies (87.5%), the 95% CIs for the prevalence rates in boys and girls did not over-lap (Table 2).
Local (survey year)
Low Practice of PA or Sports
Bento Gonçalves, RS (n.a.)71
Caxias do Sul, RS (2007)21
Cuiabá, MT (1998)42
Cuiabá, MT (2008)43
Northeast and Southeast of Brazil (1996-1997)28
Pelotas, RS (1998)81
Pelotas, RS (1999-2000)67
Pelotas, RS (2001-2002)72
Pelotas, RS (2005-2006)68
Recife, PE (2006)41
Rio de Janeiro, RJ (1996)47
São Leopoldo, RS (2002-2003)69
Santos, SP (1997)58
São Paulo state (2001-2002)49
Teixeira de Freitas, BA (2001)35
Sample (% of girls)
590 (58.5) 1,442 (50.0) 2,291 (56.1) 1,209 (55.4) 1,881 (49.0)
2,410 (56.4) 1,187 (51.6) 960 (51.8)
1,056 (51.4) 1,825 (60.8) 823 (47.5)
722 (59.4)
2,059 (55.3) 1,584 (50.9) 354 (38.4)
Age (years)
9-18
7-12
10-20
14-19
15-20
10-19
10-19
15-18
11-15
14-20
12-20
10-19
13-17
12-20
17-19
Instrument; recall time
Own questionnaire; HA-W Own questionnaire;
HA-W Own questionnaire;
HA-W Own questionnaire;
HA-W Own questionnaire;
HA-M
Own questionnaire; HA-Y
Own questionnaire; n.a.
Own questionnaire; HA-W Own questionnaire; n.a.
Q-GSHS; n.a.
Own questionnaire; HA-M
Questionnaire proposed by Blair et al. (1985);
PR-W Own questionnaire; n.a.
Own questionnaire; n.a.
Own questionnaire; n.a.
Definition
< 3 days/week of PA No weekly PA or
sports No weekly PA or
sports No weekly PA or
sports < 3 days/week of
PA
< 3 days/week of PA No weekly PA or
sports < 3 days/week of
PA No weekly PA or
sports < 3 days/week of
PA Do not perform
PA or sports frequently No weekly PA or
sports
No weekly PA or sports No weekly PA or
sports < 3 days/week of
PA
All
52.3 (48.2-56.4)
61.3 (58.7-63.9)
32.9 (30.9-34.8)
19.1 (16.9-21.4)
79.6 (77.7-81.4)
29.6 (27.8-31.5)
54.9 (52.0-57.8)
39.0 (35.9-42.1)
55.0 (51.9-58.0)
42.4 (40.1-44.7)
75.9 (72.9-78.8)
70.0 (66.5-73.3)
30.3 (28.2-32.4)
28.5 (26.3-30.8)
72.0 (67.1-76.6)
Boys
n.a.
n.a.
n.a.
n.a.
67.7 (64.7-70.7)
n.a.
n.a.
22.2 (18.5-26.3)
52.5 (48.0-57.0)
n.a.
66.7 (62.0-71.1)
55.9 (49.9-61.7)
15.3 (12.9-17.9)
n.a.
61.9 (55.1-68.4)
Girls
n.a.
n.a.
n.a.
n.a.
92.1 (90.1-93.7)*
n.a.
n.a.
54.5 (50.0-59.0)*
57.5 (53.1-61.8)
n.a.
86.2 (82.4-89.5)*
79.6 (75.4-83.3)*
41.9 (38.9-44.8)*
n.a.
88.2 (81.6-93.1)*
Table 2. Continuation
States of Brazil: AL: Alagoas; BA: Bahia; MG: Minas Gerais; MT: Mato Grosso; PB: Paraíba; PE: Pernambuco; PR: Paraná; RJ: Rio de Janeiro; RS: Rio Grande do Sul; SC: Santa Catarina; SE: Sergipe; SP: São Paulo. 1DPAR: 1-day physical activity record; 3DPAR: 3-day physical activity record; EE: energy expenditure; HA-W: habitual week; HA-M: habitual month; HA-Y: habitual year; IPAQ: International Physical Activity Questionnaire, short version; min./ week: minutes per week; MVPA: moderate to vigorous physical activity; n.a.: not available; PA: physical activity; PAR-Q: Physical Activity Questionnaire for Older Children; PR-D: previous day; PR-W: previous week; PR-M: previous month; PR-4M: previous 4 months; PR-Y: previous year; Q-GSHS: questionnaires based on Global School-based Student Health Survey 13 and/or Youth Risk Behaviors Surveillance 12 instruments; SEBC: stages of exercise behavior change. * The 95% CIs for the prevalence of physical inactivity in boys and girls did not overlap. ** Studies considering the cutoff point used in the Global School-based Student Health Survey (less than 300 minutes/week of PA or MVPA specifically) for estimates of the prevalence of physical inactivity.
1 8 0 B ar b osa Filho V C et al.
Prevalence of sedentary behaviors
The study characteristics and the sedentary behavior prevalence among Brazilian adolescents are shown in Table 3. Twenty-four studies pre-sented data on the sedentary lifestyles, focusing mainly on high screen time use (13/24,
54.2%)21,22,24,29,30,36,44,48,61,62,65,70,71. There were
im-portant variations in the cutoff point for deter-mining excessive time in these activities, ranging from 2.0 to 5.5 hours per day. The cutoff of two hours daily, in turn, was the criterion most fre-quently used for sedentary behavior
defini-tion19,23,25,35,36,44,49,61,65,72,73.
Local (survey years)
High Screen Time Use Belo Horizonte, MG (n.a)48
Bento Gonçalves, RS (n.a.)71
Capão da Canoa, RS (2004)70
Caxias do Sul, RS (2007)21
Caxias do Sul, RS (2007)65
Foz do Iguaçu, PR (2005)61
Maceió, AL (2001)30
Maringá, PR (2007)62
Ouro Preto, MG (2006)44
Pelotas, RS (2004-2005)22
Piedade, SP (2005)29
Rio de Janeiro, RJ (2003)24
São Luís, MA (2005)36
High TV use All state capital cities (2009)15
Curitiba, PR (2006)17
Pelotas, RS (2003)73
Pelotas, RS (2001-2002)72
Sample (% of girls)
1,450 (53.0) 590 (58.5) 719 (50.2) 1,442 (50.0) 1,675 (53.2) 453 (59.2) 1,253 (56.3) 991 (54.5) 780 (52.6) 4,452 (49.2) 105 (63.0) 1,684 (52.8) 592 (50.5) 60,973 (53.3) 1,518 (59.2) 810 (49.7) 960 (51.8) Age (years) 6-18 9-18 11-13 7-12 11-17 15-18 7-17 14-18 6-14 10-12 10-14 grade 8 9-16 grade 8 14-18 10-19 15-18
Instrument; recall time
1DPAR proposed by Sallis et al. (1993);
PR-D Own questionnaire;
HA-W Own questionnaire; n.a.
Own questionnaire; HA-D Own questionnaire; HA-D Own questionnaire; PR-W PAQ-C; PR-W
Own questionnaire; n.a.
Own questionnaire; n.a.
Own questionnaire; HA-W Own questionnaire; HA-D Own questionnaire; HA-W Own questionnaire; HA-D
Q- GSHS; HA-D
Own questionnaire; HA-W Own questionnaire; n.a.
Own questionnaire; HA-D
Definition
> 5.5 hours/day
5+ hours/day
> 4.5 hours/day
> 3 hours/day
2+ hours/day
2+ hours/day
3+ hours/day
4+ hours/day
2+ hours/day
> 2 hours/day;
> 4 hours/ day
> 2 hours/day
4+ hours/day
2+ hours/day
2+ hours/day
> 4 hours/day
2+ hours/day; 4+ hours/day 2+ hours/day All 28.1 (26.0-30.5) 57.5 (53.3-61.5) 31.4 (28.1-35.0) 30.2 (27.8-32.6) 86.6 (84.9-88.3) 32.2 (27.9-36.7) 65.0 (62.3-67.7) 81.7 (79.2-84.1) 88.0 (85.5-90.3) 79.7 (78.6-80.9) 47.2 (45.7-48.7) 73.3 (63.8-81.5) 71.7 (69.5-73.9) 53.9 (49.7-58.0) 79.5 (78.9-80.0) 30.0 (24.1-37.0) 75.4 (72.3-78.4) 29.0 (25.9-32.3) 74.6 (71.7-77.3) Boys n.a. n.a. n.a. n.a. 89.6 (87.2-91.7) 29.2 (22.7-36.3) 63.4 (59.3-67.5) n.a. n.a. 80.7 (79.0-82.3) 50.5 (48.4-52.6) n.a. 71.9 (68.4-75.4) n.a. 79.4 (78.5-80.3) 28.4 (24.9-32.2) 73.9 (69.4-78.2) 26.5 (22.3-31.1) n.a. Girls n.a. n.a. n.a. n.a. 84.0 (81.3-86.4) 34.3 (28.7-40.3) 65.3 (61.7-68.9) n.a. n.a. 78.8 (77.0-80.5) 44.0 (42.0-46.1)* n.a. 71.5 (68.6-74.4) n.a. 79.5 (78.7-80.3) 32.0 (29.0-35.2) 76.9 (72.5-81.0) 31.5 (27.0-36.3) n.a.
Table 3. Description of the prevalence of sedentary behavior (%) among Brazilian adolescents and its respective 95%
confidence interval (95% CI, entire sample and by gender) of each study included in this review according to local and year of survey, sample, age, instrument, and definition of sedentary behavior.
Prevalence % (95% CI)
Considering the 13 studies that examined the high screen time use prevalence, it was observed prevalence between 28.1% (95% CI: 26.0-30.5)48
e 88.0% (95% CI: 85.5-90.3)44. Eight studies
(61.5%)22,24,29,30,44,61,62,65,71 analyzing high screen
time use and obtained an estimate above 50%. In the 11 studies analyzing high TV use, the preva-lence ranged from 11.3% (95% CI: 8.1-15.1)35 to
79.5% (95% CI: 78.9-80.0)15. Six studies
(54.5%)15,23,49,69,72,73 obtained a high TV use
prev-alence above 50%.
Thirteen studies (54.2%) stratified the preva-lence of sedentary behaviors by gender. Seven studies (53.8%)15,17,30,35,46,61,73 identified higher
sedentary behavior prevalence in girls, with the magnitude of difference ranging from 0.1%15 to
14.8%46. Four studies (30.8%)19,22,24,65 showed a
higher prevalence of sedentary behaviors among boys, with the magnitude of difference ranging
from 0.4%24 to 6.9%19. Two studies (15.4%)23,69
found that the pattern of the gender differences change according to the cutoff point for deter-mining the sedentary behavior outcome. Using cutoff point of two or more hours per day of TV use, boys had higher sedentary behavior; but a cutoff point of four or more hours per day re-sulted in a higher prevalence of girls with seden-tary behavior. Only three studies (23.1%)19,22,46
demonstrated no overlap between the 95% CIs for the sedentary behavior prevalence in boys and girls (Table 3).
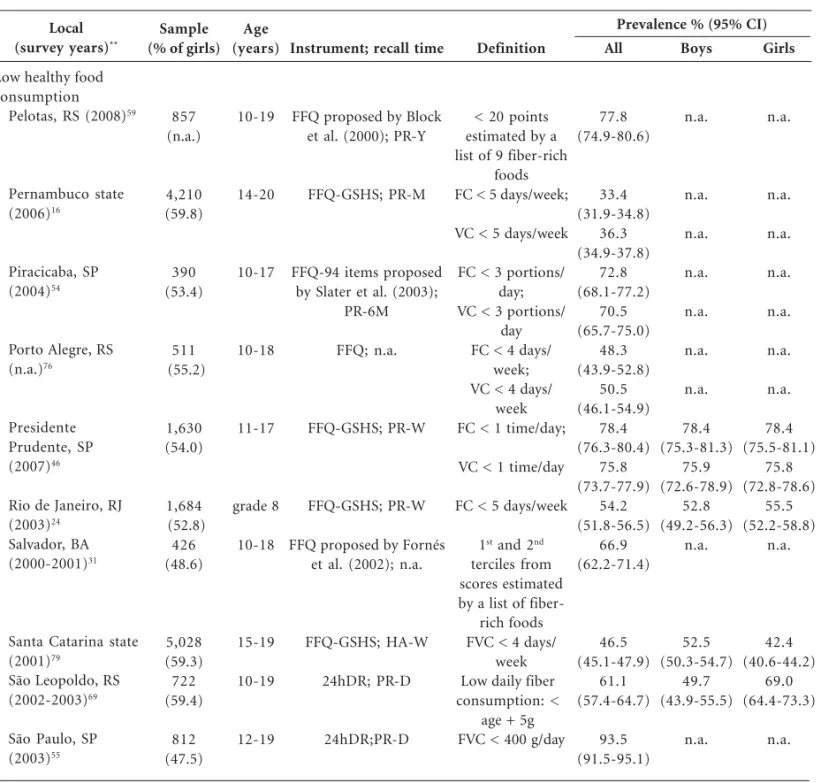
Prevalence of unhealthy food habits
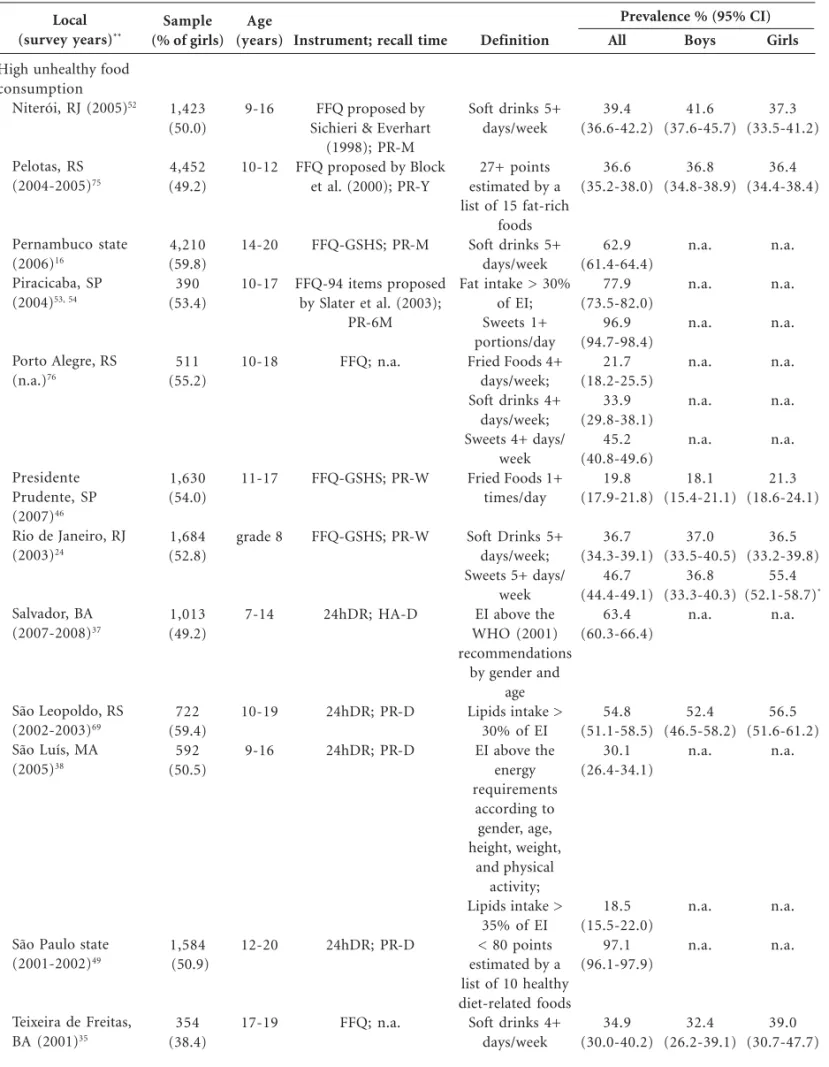
The studies on unhealthy food habits are pre-sented in Table 4. Unhealthy food habits were analyzed by 32 different articles, 24 of which15,16,20,24,35,37,38,46,48-54,61,66,69,70,71,74-77
present-Local (survey years)
High TV use Pernambuco state (2006)19, 16
Presidente Prudente, SP (2007)46
Santa Catarina state (2001)23,83
São Paulo, SP (2006)25
São Paulo state (2001-2002)49
São Leopoldo, RS (2002-2003)69,82
Teixeira de Freitas, BA (2001)35
Sample (% of girls)
4,210 (59.8)
1,630 (54.0)
5,028 (59.3)
3,845 (52.6) 1,584 (50.9)
722 (59.4)
354 (38.4)
Age (years)
14-20
11-17
15-19
14-19
12-20
10-19
17-19
Instrument; recall time
Q- GSHS; HA-D
Questionnaire proposed by Baecke et al. (1982);
PR-4M Own questionnaire;
HA-W
Own questionnaire; HA-D Own questionnaire; n.a.
Questionnaire proposed by Blair et al. (1985);
PR-W
Own questionnaire; n.a.
Definition
2+ hours/day;
3+ hours/day
TV use always/
2+ hours/day;
4+ hours/day
2+ hours/day
2+ hours/day;
> 4 hours/day
> 2 hours/day;
> 4 hours/day
2+ hours/day;
> 4 hours/day
All
40.9 (39.4-42.4)
40.8 (39.3-42.3)
37.2 (34.8-39.6)
72.7 (71.5-74.0)
38.5 (36.7-40,3)
29.1 (27.7-30.6)
73.9 (71.7-76.1)
17.6 (15.8-19.6)
75.1 (71.7-78.2)
41.0 (37.4-44.7)
47.5 (42.0-53.0)
11.3 (8.1-15.1)
Boys
54.0 (51.6-56.4)
n.a.
29.2 (26.0-32.6)
73.8 (71.8-75.8)
37.7 (35.1-40.3)
n.a.
n.a.
n.a.
75.7 (70.3-80.5)
40.3 (34.6-46.1)
43.7 (36.8-50.8)
10.7 (6.8-15.7)
Girls
47.1 (45.1-49.1)*
n.a.
44.0 (40.7-47.3)*
72.0 (70.3-73.7)
39.1 (36.8-41.5)
n.a.
n.a.
n.a.
74.6 (70.2-78.7)
41.7 (37.0-46.5)
53.4 (44.5-62.2)
12.2 (7.1-19.1)
Table 3. Continuation
Prevalence % (95% CI)
1 8 2
B
ar
b
osa Filho
V
C
et al.
ed outcomes related to high consumption of un-healthy foods. Ten studies (31.2%) examined the prevalence of unhealthy food habits based on the high consumption of fat-rich foods48,51,70,75 or
by analyzing the daily energy intake and classify-ing it accordclassify-ing to national and international rec-ommendations for a healthy diet20,37,38,49,54,69. In
these studies, the prevalence of unhealthy food habits ranged from 30.1% (95% CI: 26.4-34.1)38
to 98.3% (95% CI: 97.0-99.2)20. Six of these
stud-ies (60%)20,37,48,49,54,69 estimated an unhealthy
food habit prevalence above 50%.
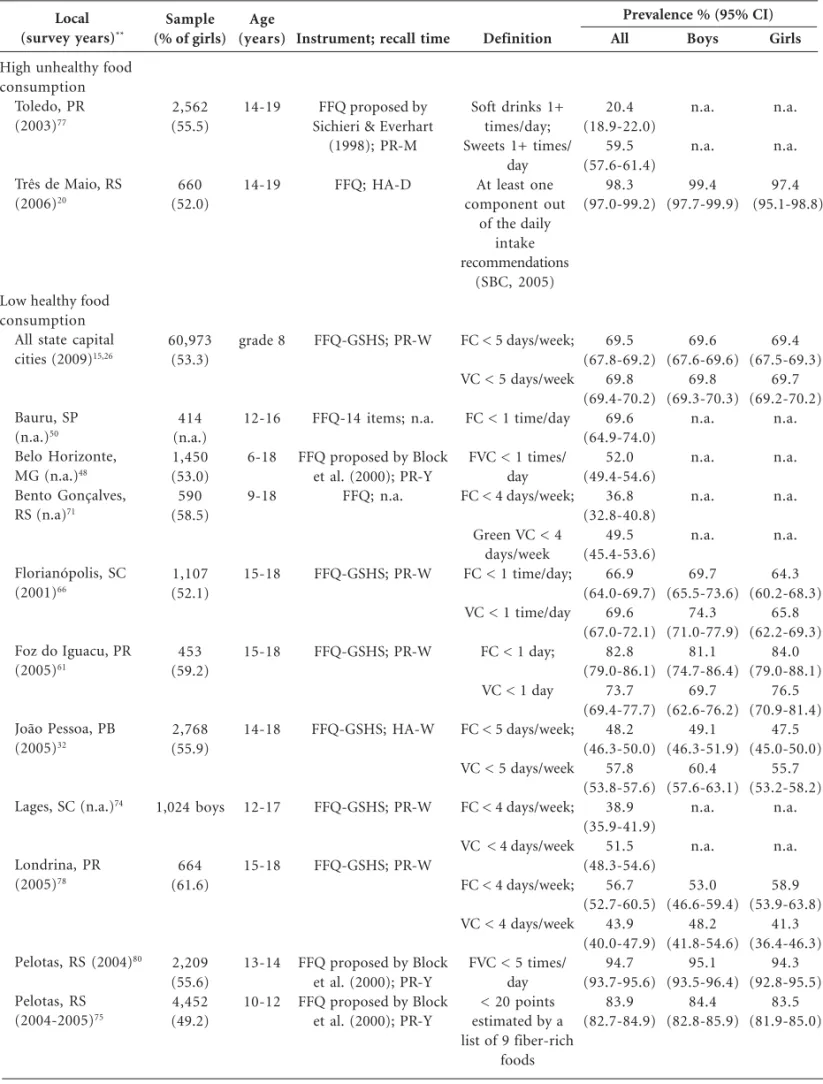
Other studies evaluated the consumption of unhealthy foods (e.g., soft drinks or sweets). High soft drink consumption was the most studied outcome (37.5%)15,16,24,35,48,50,52,61,71,74,76,77,
fol-lowed by the high sweets consumption (31.2%)15,
24,48,50,54,66,74,71,76,77. Overall, the prevalence of high
soft drink consumption varied from 20.4% (95% CI: 18.9-22.0)77 to 71.0% (95% CI: 67.2-74.6)71.
Most studies that examined the high soft drink consumption (84.6%)15,16,24,35,38,48,50, 52,61,74,71 have
found a prevalence rate above 30%. In the 10 stud-ies analyzing the high sweets consumption, the prevalence ranged from 20.1% (95% CI: 17.8-22.5)66 to 96.9% (95% CI: 94.7-98.4)54. Four of
these studies (40%)15,48,54,77 estimated a prevalence
of high sweets consumption above 50%. Others unhealthy foods were analyzed in a few studies included in this review (e.g., fast or fried foods). Thus, they were only presented in the Table 4.
A total of 23 studies (71.9%)15,16,24,26,31,32,46,48,
50,54,55,59,61,66,69,71,74-80,82 analyzed low healthy food
consumption outcomes. Nine studies (28.1%)31,48,
55,59,69,75,79,80,82 estimated this factor based on
die-tary fiber intake or fiber-rich foods intake (fruits and vegetables specifically or in a clustering with other fiber-rich foods). These studies have esti-mated the low healthy food consumption preva-lence ranged from 46.5% (95% CI: 45.1-47.9)79
to 94.7% (95% CI: 93.7-95.6)80. Seven of these
studies (77.8%)31,55,59,69,75,80,82 estimated a
preva-lence rate above 50%.
Thirteen studies (40.6%)15,16,24,32,46,50,54,61,
66,71,74,76,78 specifically analyzed the low fruit
con-sumption, with the prevalence ranging from 33.4% (95% CI: 31.9-34.8)16 to 82.8% (95% CI:
79.0-86.1)61. Nine of these studies (69.2%)15,24,46,
50,54,61,66,76,78 estimated a prevalence rate above
50%. Likewise, 11 studies (34.4%)16,26,32,46,54,61,
66,71,74,76,78 found prevalence of low vegetable
con-sumption ranging from 36.3% (95% CI: 34.9-37.8)16 to 75.8% (95% CI: 73.7-77.9)46. Six of these
studies (54.5%)26,32,46,54,61,66 observed a prevalence
rate above 50%.
Only 10 articles (31.2%) showed results strat-ified by gender on high unhealthy food consump-tion, leading to the evaluation of 13 outcomes (e.g., high consumption of sweet, fast food, soft drinks and others). Of these outcomes, seven (53.8%)15,20,24,52,61,66,75 presented higher estimates
among boys, with the magnitude of difference ranging from 0.4%75 to 4.3%52. Six outcomes
(46.2%)15,24,35,46,66,69 were higher among girls, with
the magnitude of difference ranging from 2.7%66
to 18.6%24. However, these gender differences
were discrete in most outcomes; only two
stud-ies15,24 obtained no overlap between the 95% CIs
for the prevalence in boys and girls (Table 4). Eleven studies (34.4%) evaluating the preva-lence of low healthy food consumption stratified their results by gender, leading to the evaluating of 17 outcomes. Of these outcomes, eleven (64.7%)15,26,32,46,66,75,78-80 showed a higher
preva-lence among boys, with the magnitude of differ-ence ranging from 0.1%26,46 to 10.1%79. Five
out-comes (29.4%)24,61,69,78 were higher among girls
and the magnitude of difference ranged from 2.7%24 to 19.3%69. One study46 found a similar
prevalence between genders for the low consump-tion of fruits. The magnitude of these differences was also discrete; only three studies66,69,79
ob-tained no overlap between the 95% CIs for the prevalence in boys and girls (Table 4).
Discussion
Study characteristics
The studies included in this review have some characteristics that should be highlighted. First, the examined studies indicated a growing interest in epidemiological research related to physical ac-tivity/inactivity among adolescents (70% of stud-ies assessed this behavior). This evolution of phys-ical activity-related literature in Brazil has also been observed in previous reviews84,85. This review also
identified a large number of studies with survey periods between 2005 and 2009, indicating the growing national scientific interest in the assess-ment of behaviors related to physical activity, a sedentary lifestyle, and healthy food habits.
re-Local
(survey years)**
High unhealthy food consumption
All state capital cities (2009)15
Bauru, SP (n.a.)50
Belo Horizonte, MG (n.a.)48
Bento Gonçalves, RS (n.a)71
Capão da Canoa, RS (2004)70
Florianópolis, SC (2001)66
Foz do Iguacu, PR (2005)61
Lages, SC (n.a.)74
Niterói, RJ (2003)51
Sample (% of girls)
60,973 (53.3)
414 (n.a.)
1,450 (53.0)
590 (58.5)
719 (50.2)
1,107 (52.1)
453 (59.2) 1,024 boys
539 (63.4)
Age (years)
grade 8
12-16
6-18
9-18
11-13
15-18
15-18
12-17
12-19
Instrument; recall time
FFQ-GSHS; PR-W
FFQ-14 items; n.a.
FFQ proposed by Block et al. (2000); PR-Y
FFQ; n.a.
FFQ proposed by Chiara & Sichieri (2001); PR-M
FFQ-GSHS; PR-W
FFQ-GSHS; PR-W
FFQ-GSHS; PR-W
FFQ proposed by Chiara & Sichieri (2001); PR-M
Definition
Soft drinks 5+ days/week; Sweets 5+ days/
week Soft drinks 1+
times/day; Sweets 1+ times/
day Soft drinks 6+
days/week; Sweets 6+ days/
week; Very high fat content and very
low FVC in habitual food
intake
Animal fats 4+ days/week; Fast foods 4+
days/week; Soft drinks 4+
days/week; Sweets 4+ days/
week 120+ points estimated by a
list of 9 high-energy density
foods Fried Foods 1+
times/day; Sweets 1+ times/
day Soft drinks 1+
times/day Fried Foods 4+
days/week; Soft Drinks 4+
days/week; Sweets 4+ days/
week 120+ points estimated by a
list of 9 high-energy density
foods
All
37.2 (36.5-37.9)
50.9 (50.1-51.6)
43.3 (38.5-48.3)
35.3 (30.7-40.1)
32.9 (30.4-35.4)
58.3 (55.7-60.8)
64.8 (62.2-67.2)
24.4 (21.0-28.1)
70.3 (66.4-73.9)
71.0 (67.2-74.6)
42.7 (38.7-46.8)
50.1 (46.3-53.8)
7.7 (6.3-9.2)
20.1 (17.8-22.5)
42.8 (38.2-47.5)
29.1 (26.3-32.0)
36.8 (33.8-39.8)
39.6 (36.6-42.7)
38.0 (33.9-42.3)
Boys
37.9 (36.9-38.9)
42.6 (41.5-43.6)
n.a.
n.a.
n.a.
n.a.
n.a.
n.a.
n.a.
n.a.
n.a.
n.a.
8.9 (6.6-11.6)
18.8 (15.6-22.3)
43.8 (36.5-51.2)
n.a.
n.a.
n.a.
n.a.
Girls
36.6 (35.7-37.5)
58.3 (57.4-59.3)*
n.a.
n.a.
n.a.
n.a.
n.a.
n.a.
n.a.
n.a.
n.a.
n.a.
6.9 (5.3-8.8)
21.5 (18.3-25.0)
42.2 (36.2-48.3)
n.a.
n.a.
n.a.
n.a.
Table 4. Description of prevalence of unhealthy food habits (%) among Brazilian adolescents and its respective 95%
confidence interval (95% CI, entire sample and by gender) of each study included in this review according to local and year of survey, sample, age, instrument, and definition of unhealthy food habit.
Prevalence % (95% CI)
1 8 4
B
ar
b
osa Filho
V
C
et al.
Table 4. Continuation
Local
(survey years)**
High unhealthy food consumption
Niterói, RJ (2005)52
Pelotas, RS (2004-2005)75
Pernambuco state (2006)16
Piracicaba, SP (2004)53, 54
Porto Alegre, RS (n.a.)76
Presidente Prudente, SP (2007)46
Rio de Janeiro, RJ (2003)24
Salvador, BA (2007-2008)37
São Leopoldo, RS (2002-2003)69
São Luís, MA (2005)38
São Paulo state (2001-2002)49
Teixeira de Freitas, BA (2001)35
Sample (% of girls)
1,423 (50.0)
4,452 (49.2)
4,210 (59.8) 390 (53.4)
511 (55.2)
1,630 (54.0)
1,684 (52.8)
1,013 (49.2)
722 (59.4)
592 (50.5)
1,584 (50.9)
354 (38.4)
Age (years)
9-16
10-12
14-20
10-17
10-18
11-17
grade 8
7-14
10-19
9-16
12-20
17-19
Instrument; recall time
FFQ proposed by Sichieri & Everhart
(1998); PR-M FFQ proposed by Block
et al. (2000); PR-Y
FFQ-GSHS; PR-M
FFQ-94 items proposed by Slater et al. (2003);
PR-6M
FFQ; n.a.
FFQ-GSHS; PR-W
FFQ-GSHS; PR-W
24hDR; HA-D
24hDR; PR-D
24hDR; PR-D
24hDR; PR-D
FFQ; n.a.
Definition
Soft drinks 5+ days/week
27+ points estimated by a list of 15 fat-rich
foods Soft drinks 5+
days/week Fat intake > 30%
of EI; Sweets 1+ portions/day Fried Foods 4+
days/week; Soft drinks 4+
days/week; Sweets 4+ days/
week Fried Foods 1+
times/day
Soft Drinks 5+ days/week; Sweets 5+ days/
week EI above the WHO (2001) recommendations
by gender and age Lipids intake >
30% of EI EI above the
energy requirements
according to gender, age, height, weight,
and physical activity; Lipids intake >
35% of EI < 80 points estimated by a list of 10 healthy diet-related foods
Soft drinks 4+ days/week
All
39.4 (36.6-42.2)
36.6 (35.2-38.0)
62.9 (61.4-64.4)
77.9 (73.5-82.0)
96.9 (94.7-98.4)
21.7 (18.2-25.5)
33.9 (29.8-38.1)
45.2 (40.8-49.6)
19.8 (17.9-21.8)
36.7 (34.3-39.1)
46.7 (44.4-49.1)
63.4 (60.3-66.4)
54.8 (51.1-58.5)
30.1 (26.4-34.1)
18.5 (15.5-22.0)
97.1 (96.1-97.9)
34.9 (30.0-40.2)
Boys
41.6 (37.6-45.7)
36.8 (34.8-38.9)
n.a.
n.a.
n.a.
n.a.
n.a.
n.a.
18.1 (15.4-21.1)
37.0 (33.5-40.5)
36.8 (33.3-40.3)
n.a.
52.4 (46.5-58.2)
n.a.
n.a.
n.a.
32.4 (26.2-39.1)
Girls
37.3 (33.5-41.2)
36.4 (34.4-38.4)
n.a.
n.a.
n.a.
n.a.
n.a.
n.a.
21.3 (18.6-24.1)
36.5 (33.2-39.8)
55.4 (52.1-58.7)*
n.a.
56.5 (51.6-61.2)
n.a.
n.a.
n.a.
39.0 (30.7-47.7)
Prevalence % (95% CI)
Table 4. Continuation
Local
(survey years)**
High unhealthy food consumption
Toledo, PR (2003)77
Três de Maio, RS (2006)20
Low healthy food consumption
All state capital cities (2009)15,26
Bauru, SP (n.a.)50
Belo Horizonte, MG (n.a.)48
Bento Gonçalves, RS (n.a)71
Florianópolis, SC (2001)66
Foz do Iguacu, PR (2005)61
João Pessoa, PB (2005)32
Lages, SC (n.a.)74
Londrina, PR (2005)78
Pelotas, RS (2004)80
Pelotas, RS (2004-2005)75
Sample (% of girls)
2,562 (55.5) 660 (52.0) 60,973 (53.3) 414 (n.a.) 1,450 (53.0) 590 (58.5) 1,107 (52.1) 453 (59.2) 2,768 (55.9) 1,024 boys 664 (61.6) 2,209 (55.6) 4,452 (49.2) Age (years) 14-19 14-19 grade 8 12-16 6-18 9-18 15-18 15-18 14-18 12-17 15-18 13-14 10-12
Instrument; recall time
FFQ proposed by Sichieri & Everhart
(1998); PR-M
FFQ; HA-D
FFQ-GSHS; PR-W
FFQ-14 items; n.a.
FFQ proposed by Block et al. (2000); PR-Y
FFQ; n.a. FFQ-GSHS; PR-W FFQ-GSHS; PR-W FFQ-GSHS; HA-W FFQ-GSHS; PR-W FFQ-GSHS; PR-W
FFQ proposed by Block et al. (2000); PR-Y FFQ proposed by Block
et al. (2000); PR-Y
Definition
Soft drinks 1+ times/day; Sweets 1+ times/
day At least one component out
of the daily intake recommendations
(SBC, 2005)
FC < 5 days/week;
VC < 5 days/week
FC < 1 time/day
FVC < 1 times/ day FC < 4 days/week;
Green VC < 4 days/week FC < 1 time/day;
VC < 1 time/day
FC < 1 day;
VC < 1 day
FC < 5 days/week;
VC < 5 days/week
FC < 4 days/week;
VC < 4 days/week
FC < 4 days/week;
VC < 4 days/week
FVC < 5 times/ day < 20 points estimated by a list of 9 fiber-rich
foods All 20.4 (18.9-22.0) 59.5 (57.6-61.4) 98.3 (97.0-99.2) 69.5 (67.8-69.2) 69.8 (69.4-70.2) 69.6 (64.9-74.0) 52.0 (49.4-54.6) 36.8 (32.8-40.8) 49.5 (45.4-53.6) 66.9 (64.0-69.7) 69.6 (67.0-72.1) 82.8 (79.0-86.1) 73.7 (69.4-77.7) 48.2 (46.3-50.0) 57.8 (53.8-57.6) 38.9 (35.9-41.9) 51.5 (48.3-54.6) 56.7 (52.7-60.5) 43.9 (40.0-47.9) 94.7 (93.7-95.6) 83.9 (82.7-84.9) Boys n.a. n.a. 99.4 (97.7-99.9) 69.6 (67.6-69.6) 69.8 (69.3-70.3) n.a. n.a. n.a. n.a. 69.7 (65.5-73.6) 74.3 (71.0-77.9) 81.1 (74.7-86.4) 69.7 (62.6-76.2) 49.1 (46.3-51.9) 60.4 (57.6-63.1) n.a. n.a. 53.0 (46.6-59.4) 48.2 (41.8-54.6) 95.1 (93.5-96.4) 84.4 (82.8-85.9) Girls n.a. n.a. 97.4 (95.1-98.8) 69.4 (67.5-69.3) 69.7 (69.2-70.2) n.a. n.a. n.a. n.a. 64.3 (60.2-68.3) 65.8 (62.2-69.3) 84.0 (79.0-88.1) 76.5 (70.9-81.4) 47.5 (45.0-50.0) 55.7 (53.2-58.2) n.a. n.a. 58.9 (53.9-63.8) 41.3 (36.4-46.3) 94.3 (92.8-95.5) 83.5 (81.9-85.0)
Prevalence % (95% CI)
1 8 6
B
ar
b
osa Filho
V
C
et al.
Table 4. Continuation
Local
(survey years)**
Low healthy food consumption
Pelotas, RS (2008)59
Pernambuco state (2006)16
Piracicaba, SP (2004)54
Porto Alegre, RS (n.a.)76
Presidente Prudente, SP (2007)46
Rio de Janeiro, RJ (2003)24
Salvador, BA (2000-2001)31
Santa Catarina state (2001)79
São Leopoldo, RS (2002-2003)69
São Paulo, SP (2003)55
Sample (% of girls)
857 (n.a.)
4,210 (59.8)
390 (53.4)
511 (55.2)
1,630 (54.0)
1,684 (52.8)
426 (48.6)
5,028 (59.3) 722 (59.4)
812 (47.5)
Age (years)
10-19
14-20
10-17
10-18
11-17
grade 8
10-18
15-19
10-19
12-19
Instrument; recall time
FFQ proposed by Block et al. (2000); PR-Y
FFQ-GSHS; PR-M
FFQ-94 items proposed by Slater et al. (2003);
PR-6M
FFQ; n.a.
FFQ-GSHS; PR-W
FFQ-GSHS; PR-W
FFQ proposed by Fornés et al. (2002); n.a.
FFQ-GSHS; HA-W
24hDR; PR-D
24hDR;PR-D
Definition
< 20 points estimated by a list of 9 fiber-rich
foods FC < 5 days/week;
VC < 5 days/week
FC < 3 portions/ day; VC < 3 portions/
day FC < 4 days/
week; VC < 4 days/
week FC < 1 time/day;
VC < 1 time/day
FC < 5 days/week
1st and 2nd
terciles from scores estimated by a list of
fiber-rich foods FVC < 4 days/
week Low daily fiber consumption: <
age + 5g FVC < 400 g/day
All
77.8 (74.9-80.6)
33.4 (31.9-34.8)
36.3 (34.9-37.8)
72.8 (68.1-77.2)
70.5 (65.7-75.0)
48.3 (43.9-52.8)
50.5 (46.1-54.9)
78.4 (76.3-80.4)
75.8 (73.7-77.9)
54.2 (51.8-56.5)
66.9 (62.2-71.4)
46.5 (45.1-47.9)
61.1 (57.4-64.7)
93.5 (91.5-95.1)
Boys
n.a.
n.a.
n.a.
n.a.
n.a.
n.a.
n.a.
78.4 (75.3-81.3)
75.9 (72.6-78.9)
52.8 (49.2-56.3)
n.a.
52.5 (50.3-54.7)
49.7 (43.9-55.5)
n.a.
Girls
n.a.
n.a.
n.a.
n.a.
n.a.
n.a.
n.a.
78.4 (75.5-81.1)
75.8 (72.8-78.6)
55.5 (52.2-58.8)
n.a.
42.4 (40.6-44.2)
69.0 (64.4-73.3)
n.a.
Prevalence % (95% CI)
gions in Brazil15,26-28. These studies contributed
to the research comprehensiveness to unexplored territories of Brazil, including small cities and poorer regions of a state. Additionally, several studies adopted a comprehensive sample selec-tion procedure, based on the youth populaselec-tion (household surveys) or they were school-based
surveys considering both public and private schools (see Table 1).
Two other characteristics, however, indicated that there are some lacunas in the national liter-ature on physical inactivity, sedentary behaviors, and unhealthy food habits in youth. First, a high concentration of studies focused on the South
and Southeast regions of Brazil, whereas few in-cluded studies were conducted in North and Cen-tral-West regions (see Table 1). This characteris-tic has also been observed in other reviews of adolescent health84-86 and indicates that
the development of scientific research related to the risk behaviors in Brazil has yet to cover all regions of the country. There is an effort of re-gional and national institutions to performed surveys involving adolescents from all regions of Brazil15,26. However, public and private
institu-tions should to invest more financially and aca-demically in this research area, developing poli-cies for the diagnosis and prevention of behavio-ral risk factors among young people from differ-ent regions in Brazil.
Another feature of this review reinforces the discrepancy between Brazilian regions in research on behavioral risk factors among Brazilian youth: only one included study was conducted in a low-HDI (< 0.600) site34. The literature has pointed
out the importance of assessing health-related
risk behaviors in sites with low human develop-ment level because a lack of knowledge about health factors and structural problems in health systems available to the population of these sites contribute to the adoption of inappropriate be-havior and the emergence of diseases in different age groups, including the young1,2. Therefore,
institutions focused on population health should intensify their efforts to the diagnosis and treat-ment of behavioral risk factors among Brazilian youth from regions/sites lacking in research (Chart 1).
Physical inactivity
The inter-study comparison of physical in-activity prevalence has several limitations that should be considered when interpreting the re-sults of this review. Firstly, the use of different instruments, recall time, and physical activity domains (i.e., total physical activity or leisure and transportation physical activity only) interferes
Risk behaviors
Physical inactivity
Sedentary behaviors
Unhealthy food habits
Main findings
. The prevalence of physical inactivity ranged from 2.3% to 93.5%. Only 4 studies (8.3%) indicated physical inactivity prevalence of less than 20%, while 28 studies (58.3%) estimated physical inactivity prevalences above 50%.
. The 95% CIs for the prevalence of physical inactivity in boys and girls did not overlap in 87.5% of studies.
. Prevalence of high screen time use ranged from 28.1% to 88.0%, whereas the high TV use ranged from 11.3% to 79.5%. Most of studies (60%) demonstrated prevalence rates above 50%.
. The magnitude of difference between genders for the sedentary behaviors was small at most of studies because the 95% CIs for the prevalence of sedentary behaviors in boys and girls did not overlap in only three studies (23.1%).
. Overall, several indicators were used to identify unhealthy food habits. Some criteria/studies have indicated estimates of unhealthy food habits in close to 100% of adolescents. Moreover, it was consistent that low healthy food consumption was more present than high unhealthy food consumption.
. The high soft drink consumption was the outcome most frequently studied regarding unhealthy food habits among Brazilian adolescents (37.5% of studies), with prevalence rates ranged from 20.4% to 71.0%. The high sweets consumption was evaluated in 31.2% of studies, and the prevalence rates ranged from 20.1% to 96.9%.
. The prevalence of low fruit consumption among adolescents ranged from 33.4% to 82.8%, and the prevalence of low vegetable consumption ranged from 36.3% to 75.8%. Most studies (60%) evaluating these risk behaviors has indicated prevalence rates above 50%.
. The magnitude of difference between genders for the prevalences of high unhealthy food consumption or low healthy food consumption was discrete in most studies.
1 8 8
B
ar
b
osa Filho
V
C
et al.
with the inter-study comparison. Secondly, the use of different cutoff points for the definition of physical inactivity is another important limita-tion of inter-study comparison (i.e., several phys-ical inactivity definitions were adopted since the low frequency of participation in physical activi-ties and sports until the estimating of the daily energy expenditure). Thirdly, different age groups were considered in the included studies – some studies involved early adolescents21,44,63,70, while
others examined subjects in the late adoles-cence19,20,25,35,62,61,66,72,78,79. Therefore, it is
impos-sible to identify national and regional estimates of physical inactivity, or to analyze prevalence rates stratified by some study characteristics (e.g., survey periods or HDI level).
Despite these limitations for data analysis, this review provides a framework indicating that phys-ical inactivity affects at least half of the adoles-cents in several sites of Brazil. Although there was a wide range in the prevalence of physical inactiv-ity, a large number of studies found a physical inactivity prevalence above 50%. Thus, studies consistently demonstrate that physical inactivity is a behavioral risk factor present in most ado-lescents and public policies should focus on ac-tive lifestyle promotion in youth.
The indication that physical inactivity affects more than half of young people was also found in adolescents from several countries, according to the GSHS13 data. This study also
demonstrat-ed that the percentage of physical inactivity ex-ceeds 75% in more than half of the 34 surveyed countries, especially in girls13. The Health
Behav-iour in School-aged Children (HBSC) 2005-2006 survey87, which was an international study with
adolescents from 41 countries in Europe and North America, also identified a physical inactiv-ity prevalence above 50% in several countries. Thus, it is clear that physical inactivity is a world-wide phenomenon that has reached alarming lev-els in young people.
Some studies included in this review have iden-tified possible exposure factors associated with physical inactivity among Brazilian adolescents. Several studies have found that female15,17,20,24,25,33,
34,35,39,45,46,60,63,66,79 and older adolescents19,25,33,64,65,
66,79 comprise population subgroups most
ex-posed to physical inactivity. Other population subgroups have also been identified, including working adolescents19,79, those from the public
school system15,62, and whose that parents are
inactive18,63-65. Importantly, the association
be-tween socioeconomic status and physical activity varies; some studies highlight that adolescents of
elevated socioeconomic status are at a higher risk for physical inactivity18,25,63, whereas others
indi-cate an inverse association34,62,64.
The findings of these studies have contribut-ed to the development of public policies promot-ing physical activity among Brazilian youth, based on the subgroups at higher risk for physical in-activity. However, future cross-sectional and lon-gitudinal studies are necessary to identify others variables (e.g., socioeconomic conditions and parents’ physical activity) associated with physi-cal inactivity among Brazilian adolescents. Addi-tionally, the study of variables from different lev-els, going from individual factors (e.g., satisfac-tion and self-efficacy for physical activity) to en-vironmental contexts (e.g., favourable school and community environment for physical activity) is fundamental to determine the primary and dif-ferent levels of the physical activity predictors.
In studies evaluating physical inactivity as an exposure factor and identifying health-related outcomes among Brazilian adolescents, we ob-served associations of physical inactivity with a greater prevalence of
overweight/obesi-ty31,40,48,70,83, a high total cholesterol48, high blood
pressure41 and a high body fat percentage41,48.
Finally, it has also been noted that the physical inactivity are associated with higher estimates of other risk behaviors, such as excessive time watch-ing TV23,63 and the low consumption of fruits
and/or vegetables32,46,83. The findings of these
Brazilian studies have evidenced the association of physical inactivity and other health-related outcomes.
Sedentary behaviors
Although methodological differences are small in sedentary behavior studies when com-pared to studies evaluating physical activity, the inter-study comparison is also limited. First, the recall time to identify sedentary behaviors varied significantly, ranging from previous or habitual days to previous four months. The type of activ-ities considered in the sedentary behavior also limited the comparison because some studies in-cluded TV use only and others also considered sedentary leisure habits (i.e., computer and vid-eo game use). However, the most important lim-itation was the use of different cutoff points for the determination of sedentary behavior, limit-ing the inter-study comparison (see Table 3).
high screen time use prevalence (3 or more hours per day) above 50% only in adolescents aged 13 to 15 years old from 4 of 34 countries (Cayman Islands, Colombia, Saint Lucia, and Seychelles). Additionally, higher prevalence rates have been found in countries of the Americas Region (not including Brazil in this study)13. The GSHS also
showed that the prevalence of high screen time use were similar between the genders in most countries.
Data obtained from the Youth Risk Behavior Surveillance (YRBS) survey12, conducted with
American adolescents in 2009, also show higher estimates of sedentary behavior (24.9% and 32.8% of adolescents use computer/videogames and watch TV three or more hours per day, re-spectively). However, the sedentary behavior prev-alence among American adolescents was still be-low those found in most Brazilian adolescent studies. Therefore, it is clear that sedentary be-havior is a bebe-havioral risk factor present in a large proportion of Brazilian adolescents. Preventive measures should be taken to reduced this risk behavior and improve health in Brazilian youth. The literature provides little evidence regard-ing factors associated with the adoption of a sed-entary lifestyle among Brazilian adolescents. Gen-der was associated with sedentary behaviors in a few studies22,46. In addition, a few studies
identi-fied an association between sedentary behaviors and other sociodemographic variables, such as socioeconomic status22, parental education65,82,
age19,82, and the type of school15. Thus, study is
required to evaluate potential factors associated with sedentary behavior during adolescence be-cause these factors are not well understood in the Brazilian youth-related literature. Longitudinal monitoring of this risk behavior during adoles-cence and the evaluation of predictors from dif-ferent levels, as specified for studies of physical inactivity, are also fundamental to understand-ing the reasons for the high sedentary behavior estimate among Brazilian adolescents.
Unhealthy food habits
The inter-study comparison of the prevalence of unhealthy food habits should also be performed with caution. The amount and types of food in-cluded in the questionnaires (e.g., some studies considered natural fruit juice for fruit consump-tion definiconsump-tion, whereas others do not) has signif-icant variations between studies. The use of dif-ferent cutoff points (e.g., the cutoff points for iden-tifying the low consumption of fruits and
vegeta-bles ranged from four times per week to five por-tions per day) is also an important limitation of the inter-study comparison. Therefore, the anal-ysis of the results of unhealthy food habits should consider these characteristics.
Based on the results of the studies included in this review, a high number of adolescents in sev-eral Brazilian sites are exposed to unhealthy food habits, with some studies estimating rates of un-healthy food habits in close to 100%20,49,54,55 of
adolescents. Most studies also demonstrate a prev-alence of low healthy food consumption that was higher than the prevalence of high unhealthy food consumption15,24,46,50,54,61,66,69,74-76. These results
indicate a need to promote proper eating habits, and such healthy diet policies should primarily encourage the consumption of healthy foods.
Estimates of unhealthy food habits in several included studies are very close to those found in developed countries like the United States12 and
Canada87, where health problems related to a
poor diet (especially high blood pressure and overweight/obesity) are already well established among the younger population. Recent data from the YRBS12 indicate that 29% of American
adolescents consume soft drinks daily. Several Brazilian studies have found a prevalence of high soft drink consumption very close to those ob-tained from American adolescents, including studies that used the same cutoff point (one or more times per day)50,61,77. If interventions are
not developed to reduce these behaviors, serious health problems (such as type 2 diabetes, high blood pressure, and dyslipidemia) may reaching alarming proportions in Brazilian youth and worsen the NCD framework in Brazil.
Some studies have identified factors associat-ed with unhealthy food habits among Brazilian adolescents. Although some studies show signifi-cant differences between genders in unhealthy food habits20,24,66,79, the direction of this association is
inconsistent and varies according to the unhealthy food habit outcome. These features were also observed in this review (see Table 4). Other stud-ies have found that low socioeconomic status is associated with a higher prevalence of low healthy food consumption (e.g., fruits and vegeta-bles)26,70,75, but the direction of the association
var-1 9 0
B
ar
b
osa Filho
V
C
et al.
iables associated with high unhealthy food habits estimates. Additionally, these peculiarities should be considered when determining the primary fo-cuses of healthy eating interventions.
Only two studies69,76 included in this review
found a significant association between unhealthy food habits and overweight/obesity. No study identified a significant association between un-healthy food habits and other health outcomes in adolescence (e.g., high total cholesterol or high blood pressure). Two features of this review may be related to these results. First, most Brazilian studies that evaluated food habits and metabolic health-related risk factors (e.g., low HDL, high cholesterol, high blood pressure) adopted non-probabilistic methods for the sample selection and in turn were not included in this review. Moreover, some studies evaluating the associa-tion between food habits and health outcomes may have been excluded for having a more com-plete replication study, considering the purposes of this review.
However, lack of evidence for an association between unhealthy food habits and health out-comes may be related to another factor. Most studies included in this review evaluated food habits using a food-frequency questionnaire without portion sizes. The quantification of total intake based on frequency alone may be inaccu-rate because of the absence of information on portion sizes87. These characteristics have been
identified as the reason for the lack of association between unhealthy food habits and overweight/ obesity in studies of the HBSC87. Therefore, the
use of more precise methods to determine food habits in adolescence is fundamental to identify the relationship between food habits and health outcomes.
Final considerations
Some limitations of this review should be high-lighted. The first limitation was discussed previ-ously and is related to the viability of inter-study comparison on the prevalence of physical inac-tivity, sedentary behaviors, and unhealthy food habits. A second limitation is related to the pos-sibility of that some important studies have not been included in this review. A large number of adolescent-related health behavior studies are theses and dissertations, and the time to publish some manuscripts in peer-reviewed literature is often lengthy. However, it is believed that the main research on physical inactivity, sedentary
behav-iors, and unhealthy food habits among Brazilian adolescents, including the Pesquisa Nacional de
Saúde do Escolar15,26, were presented in this
re-view. Third, this review was limited to those stud-ies that presented data on the prevalence of at least one of three behavioral risk factors studied, not including studies that have addressed these behaviors with other methods of analysis (e.g., mean time watching TV or daily mean of serv-ings of fruits and vegetables).
This systematic review demonstrates that three important behavioral risk factors are present in a large proportion of Brazilian youth. As such, this review has identified important de-terminants of the present and future health of this population. The estimates of these risk be-haviors among Brazilians adolescents were very close to or even greater than those found in de-veloped countries in several studies. Considering that NCDs are the leading causes of death in Bra-zilian adults, if public policies to combat these NCD behavioral risk factors during youth are not developed, future estimates may be even more worrisome. Further studies identifying and tracking the possible factors associated with the adoption of NCD behavioral risk factors in ado-lescence are required, and we highlight the urgent need for interventions to promote health among Brazil youth.
Collaborations
V. C. Barbosa Filho participated in all stages of the study, including the search and review of stud-ies, analysis and writing of the manuscript. W. de Campos and A. S. Lopes participated in the struc-turing of the methods, analysis of results and critical review of the manuscript.
Acknowledgments
The first author was supported by the Coorde-nação de Aperfeiçoamento de Pessoal de Nível
Su-perior (CAPES) during the Master’s scholarship.