FREE THEMES
1 Programa de Pós-Graduação em Enfermagem, Centro de Ciências da Saúde, Universidade Estadual de Maringá. Av Colombo 5790, Jardim Universitário. 87020-900 Maringá PR Brasil. [email protected] 2 Pós-Graduação em Saúde Pública, Centro Universitário Internacional. Curitiba PR Brasil.
Hospitalizations for diabetes mellitus and the Family Health
Strategy, Paraná, Brazil, 2000-2012
Abstract The aim of this study was to identify trends in hospitalization for diabetes mellitus and their correlation with the Family Health Strategy (FHS) coverage in the state of Paraná, by Health District (HD), between 2000 and 2012. It is an ecological study based on secondary data from the Hospital Information System of the Brazilian Unified Health System and the Primary Care Department. There was downward trend for ge-neral admission rates (from 10.2 to 9.0/10,000 inhabitants), but upward trend for some HDs. No correlation was observed between admission rates and the FHS coverage for the state. However, there was strong inverse correlation for Paranaguá, Me-tropolitan, Foz do Iguaçu and Umuarama HDs, and strong and direct correlation for Pato Branco, Campo Mourão, Cianorte, Telêmaco Borba and Ivaiporã HDs. Overall, hospitalizations for diabe-tes mellitus proved to be decreasing and without correlation with FHS coverage; however, there were differences according to HDs.
Key words Diabetes Mellitus, Hospitalization,
Family Health Strategy, Public health care servi-ces coverage, Primary Health Care
A
rr
uda GO
Introduction
The prevalence of Diabetes Mellitus is estimat-ed to increase considerably by 2030 among the elderly in European countries and in the United States, and among people of all ages in develop-ing countries, with a twice as higher rate for those
aged between 20 and 44 years old1. In Brazilian
capitals, the prevalence of self-reported diabetes among people older than 18 years old has risen from 5.3% to 5.6% between 2006 and 2011, but
with differences as to age groups and regions2.
Between 1990 and 2000, diabetes stood out among chronic conditions that have determined an increase in the number of lost years of life adjusted by incapacity, accounting for 5% of the latter; in addition, it causes early deaths, com-promises people’s ability to work and the main-tenance of family savings for future years, pos-sibly due to acute and chronic complications of the disease, which results in high morbimortality
rates and costs for health systems3.
Diabetes adverse trends require relevant po-litical interventions that offer the sufficient and
cost-effective attention3. In this sense, it is worth
highlighting that diabetes constitutes an Ambu-latory Care-Sensitive Condition (ACSC), as there is evidence that the adequate performance of healthcare professionals and managers at the lev-el of Primary Healthcare (PHC) can hlev-elp reduce the number of hospitalizations and deaths, espe-cially through the prevention of micro and mac-ro-vascular complications in the care provided
by Family Health Strategy (FHS) teams4.
In this way, hospitalizations for ACSC (HACSC) serve as an indicator of hospital activ-ity and, at the same time, as an indirect
measure-ment of effectiveness, access and quality of PHC5.
The ACSC Brazilian List (Decree 221-SAS/MS-2008) is a reference for the assessment of the FHS
operation6. It is worth highlighting that, besides
the list, there are also specific lists of the states of Minas Gerais and Ceará, and the municipality of
Curitiba, in Paraná4, and all of them contain the
diabetes diagnosis, followed or not by coma or
ketoacidosis4.
Considering that PHC is implemented in Brazil through the FHS, the increase in the FHS population coverage should lead to a decrease in morbimortality from ACSC, such as
diabe-tes6. Studies of HACSC in Brazil have focused on
identifying what evitable causes most cause
hos-pitalizations in the Brazilian population5,7.
Con-cerning diabetes, more specifically, three interna-tional studies have been found, which addressed
this disease and its relationship with the care
provided in PHC, conducted in Philadelphia8,
United States in general9, and Ontario, Canada10.
A study conducted with data on hospitalizations for diabetes in Ceará is an advancement, as it points the trends of hospitalization rates by sex and age group, but does not establish a
correla-tion with the FHS coverage11.
In addition, the FHS coverage is a vital com-ponent in the operationalization of PHC and should be considered in the assessment of uni-versal health systems, because it indicates the set of actions and services to which the population
has acess12.
Thus, the question is: what is the trend of hospitalization for diabetes rates in the state of Paraná? Is there any correlation between rates of hospitalization for diabetes and the FHS cover-age? In this way, the present study aimed to iden-tify rate trends of hospitalization for diabetes mellitus and their correlation with the FHS cov-erage in the state of Paraná, according to Health Districts, from 2000 and 2012.
Methods
This is a time-series study about rates of hos-pitalization for diabetes among residents of the state of Paraná, and about the time evolution of the FHS population coverage in the same state, according to 22 HDs, from 2000 to 2012. Pop-ulation information about Paraná and its HDs were obtained from results of the 2000 and 2010 Demographic Census, and also from inter-census estimates provided by the Brazilian Institute of Geography and Statistics. Data on hospitaliza-tion for diabetes were collected from the
Hospi-tal Information System (Sistema de Informações
Hospitalares) of the Brazilian Unified Health
System (Sistema Único de Saúde) SUS, available
at the website of SUS’s IT Department, between February and March 2014.
Hospitalization rates were calculated for each HD through the ratio between the absolute fre-quency of hospitalizations for diabetes and the residing population, using the interval from E-10 to E-14 of Chapter IV of the International Clas-sification of Diseases, version 10 (ICD-10). Sub-sequently, hospitalization rates, calculated on a base of 10,000 inhabitants, were standardized by means of direct method, having as standard the population of each region and the state of Paraná in 2010.
aúd
e C
ole
tiv
a,
23(2):543-552,
2018
were collected from the website of the
Prima-ry Healthcare Department (Departamento da
Atenção Básica) of the Brazilian Ministry of Health. The next step was the calculation of es-timated population coverages of the FHS for the state of Paraná and for each HD, adopting as base the population covered in December of each year of the historical series. Afterwards, this study used the ratio between the population covered by the FHS and the population residing in the region, the series year, and then multiplied it by 100 for the calculation of the estimated popula-tion coverage, represented by percentage values.
The Shapiro-Wilk test for normality was carried out, which is recommended for samples with size smaller than 30, in order to verify the distribution of data collected, for both hospital-ization rates and population coverage. Later, for data with normal distribution, the Pearson Cor-relation test was applied, and for non-normal data, the Spearman Correlation test; from the correlation matrix it was possible to analyze the relationship between the behavior of hospitaliza-tions for diabetes and the evolution in FHS cov-erage; the hospitalization rates met the normality supposition. In order to classify the intensity of correlation coefficients, this study adopted the following categorization: correlation coefficients < 0.4 (weak correlation), > 0.4 to < 0.5
(moder-ate correlation) and > 0.5 (strong correlation)13.
Cases in which no significance was found in the correlation test (p > 0.05) were regarded as “without correlation”. The coefficients also indi-cated direct or inverse correlation, according to the coefficient sign (positive or negative).
In the trend analysis, data corresponding to the 2000-2012 historical series were adjusted by polynomial regression models, which allow for the estimation of a statistical model for historical series, from which it is possible to verify the series behavior and indicate factors that are supposedly associated with this behavior. This type of analy-sis was chosen due to easy elaboration and
inter-pretation of models and great statistical power14.
Hospitalization rates composed the depen-dent variable (Y), and the calendar years of the study the independent variable (X), based on the assumption that the hospitalization rates varied over time, under the influence, in the case of the present study, of the FHS coverage. In order to prevent self-correlation between equation terms of the regression, the “year” variable was turned into “centralized year” variable, which is obtained by “year” minus the medium point of the histor-ical series (year – 2003). The first model to be
tested was simple linear regression (Y = β0 + β1X)
and, then, models of higher degree were tested:
second order (Y = β0 + β1X + β2X2) and third
or-der (Y = β0 + β1X + β2 X2+ β3X3).
For the choice of the model, there was analy-sis of the dispersion diagram, the determination
coefficient value (r2 closer to 1 corresponds to a
better adjustment of the model) and the residue distribution, which, in turn, allowed verifying the data homoscedasticity supposition. In cases of statistical equality between models, the model of lower order was chosen (first order or linear model). The series were smoothened through the 3-point moving average. All data were stored in tables on Tabwin 2.7 (Datasus app for data tabu-lation and treatment) and then shifted to Micro-soft Excel 2010, where they were organized into databases. Polynomial regression models were generated from SPSS, version 20. The level of sig-nificance adopted was p < 0.05 (5%) for all tests performed.
The research project that resulted in the pres-ent study was approved by the Ethics Committee on Research Involving Humans of the State Uni-versity of Maringá (COPEP/UEM), under legal opinion.
Results
Between 2000 and 2012, 111,402 hospitaliza-tions for diabetes were recorded in the state of Paraná. The highest number of hospitalizations (21,436/19, 2%) was recorded in the Metropoli-tan HD, followed by Maringá, with 9,487 (8.5%), Londrina, with 7,445 (6.7%), and Ponta Grossa, with 6,986 hospitalizations for diabetes (6.3%). The FHS coverage in Paraná rose from 27.0% to 56.2% in the period studied, representing an increase of approximately 108% (percentage variation = 29.2%). Among the HDs, Apucarana showed the highest percentage of FHS coverage, both in the beginning (76.8%) and in the end of the period (96.1%). (Table 1).
A
rr
uda GO
Table 1. FHS population coverage proportion and rates of hospitalization for diabetes mellitus among residents of the state of Paraná, by health region, 2000 to 2012.
Health Region 2000 2001 2002 2003 2004 2005 2006
% Rt % Rt % Rt % Rt % Rt % Rt % Rt
Paraná 22.4 10.2 31.5 10.7 35.9 10.1 38.4 9.3 41.4 9.1 45.9 9.8 48.0 9.5
1st Paranaguá HD 7.8 12.2 4.3 12.8 13.1 12.5 12.2 11.2 7.2 8.8 19.5 9.6 23.3 11.6
2nd Metropolitan HD 15.3 9.7 19.1 10.2 20.3 8.3 19.8 7.0 24.0 5.9 27.9 4.6 31.4 5.1
3rd Ponta Grossa HD 10.1 12.8 11.8 12.2 20.0 11.8 21.7 11.6 28.5 9.5 36.4 9.1 36.5 8.5
4th Irati HD 16.7 9.6 21.6 11.0 28.0 9.5 32.4 8.3 46.1 6.5 52.2 7.2 66.3 11.5
5th Guarapuava HD 12.3 10.1 23.1 11.8 29.2 10.8 43.1 9.4 52.1 9.3 52.4 11.0 53.0 10.8
6th União da Vitória HD 13.3 6.7 17.4 10.5 19.4 6.8 23.5 7.8 27.6 10.3 36.4 10.2 40.5 8.2
7th Pato Branco HD 17.6 7.6 20.4 9.1 27.5 9.2 31.7 8.1 14.3 9.1 27.0 10.6 30.9 11.6
8th F. Beltrão HD 20.4 9.7 34.1 10.1 44.0 7.6 52.4 9.8 57.8 8.9 65.2 11.9 66.3 10.7
9th F. do Iguaçu HD 8.0 5.6 15.4 5.3 16.0 7.4 17.4 6.2 21.6 6.2 39.2 6.9 42.4 5.4
10th Cascavel HD 30.7 5.3 39.0 6.0 34.3 4.2 34.6 3.8 34.0 3.9 38.9 6.4 36.1 6.0
11th Campo Mourão HD 18.8 9.4 34.4 10.0 41.8 12.6 45.1 12.3 43.8 14.2 67.7 16.8 71.5 19.3
12th Umuarama HD 39.1 26.1 40.6 27.7 43.8 29.2 47.6 32.8 54.9 31.3 61.0 43.3 65.1 36.1
13th Cianorte HD 39.6 7.5 59.9 8.3 59.6 11.5 64.6 11.6 69.6 15.9 67.1 17.4 67.5 21.1
14th Paranavaí HD 35.1 11.5 62.9 9.7 67.4 12.6 72.0 13.8 73.8 11.7 82.7 14.4 88.2 11.8
15th Maringá HD 41.1 11.0 43.5 11.4 44.2 10.6 49.3 11.9 55.3 12.0 39.2 14.0 52.3 13.4
16th Apucarana HD 62.8 16.2 85.2 15.8 91.7 17.1 92.0 13.8 90.8 15.4 89.2 17.2 91.1 13.0
17th Londrina HD 23.7 10.2 65.1 9.9 74.8 9.2 76.2 9.0 76.6 10.0 77.4 9.2 66.9 7.5
18th C. Procópio HD 35.5 21.4 32.6 20.8 61.9 26.0 67.2 24.3 67.7 20.2 72.9 23.5 77.2 20.6
19th Jacarezinho HD 17.7 14.8 38.2 13.8 48.6 15.2 58.7 11.9 58.6 13.9 69.5 16.6 68.8 17.2
20th Toledo HD 11.7 9.2 16.3 12.6 16.8 9.8 22.1 8.5 26.4 10.1 29.9 12.8 28.4 14.6
21st Telêmaco Borba HD 19.5 12.0 19.4 11.1 25.3 7.4 29.5 2.5 38.1 9.0 59.6 12.3 66.3 9.3
22rd Ivaiporã HD 45.6 3.9 54.2 7.8 63.3 9.7 64.0 9.2 64.6 10.6 78.0 14.3 78.0 18.2
Health Region 2007 2008 2009 2010 2011 2012
% Tx % Tx % Tx % Tx % Tx % Tx
Paraná 47.5 8.4 50.5 9.5 51.9 9.8 55.7 10.0 55.7 9.0 57.3 9.0
1st Paranaguá HD 30.6 10.1 39.9 11.1 39.3 11.8 49.8 9.0 50.6 8.9 52.8 7.0
2nd Metropolitan HD 31.2 4.6 33.4 4.5 34.5 4.9 38.8 5.4 38.9 4.6 42.3 5.3
3rd Ponta Grossa HD 34.8 9.2 45.6 10.5 45.0 11.3 41.5 12.2 44.1 10.7 45.0 9.1
4th Irati HD 57.6 7.5 57.1 9.7 64.4 11.8 64.2 14.4 63.9 12.7 60.8 7.5
5th Guarapuava HD 52.7 9.7 57.8 13.6 58.3 16.1 69.6 13.4 68.6 12.0 68.9 12.4
6th União da Vitória HD 40.4 5.7 40.1 8.5 40.0 8.5 41.7 10.2 42.7 12.2 46.6 11.5
7th Pato Branco HD 36.8 11.0 48.4 10.0 55.6 13.0 64.1 12.0 64.9 11.5 64.5 10.8
8th F. Beltrão HD 68.3 10.2 69.1 10.3 70.9 9.8 78.5 10.7 79.7 10.8 80.3 11.5
9th F. do Iguaçu HD 39.3 5.4 43.2 6.0 41.6 4.7 54.3 4.0 52.4 3.9 52.6 3.8
10th Cascavel HD 32.7 6.0 34.6 6.4 36.5 6.5 38.6 6.1 38.2 6.6 42.5 5.1
11th Campo Mourão HD 75.0 15.5 71.9 19.4 80.1 18.7 82.3 15.3 81.1 14.9 82.1 17.0
12th Umuarama HD 70.0 27.5 61.9 10.1 72.8 12.9 75.0 12.0 74.7 11.7 79.7 8.0
13th Cianorte HD 72.8 18.7 70.4 17.1 72.4 16.0 69.5 16.8 68.9 15.2 69.8 13.7
14th Paranavaí HD 87.9 12.2 79.6 14.1 816 18.5 86.8 17.8 84.2 17.2 85.5 14.3
15th Maringá HD 48.6 11.3 50.8 13.3 53.7 12.7 55.0 12.1 57.8 9.8 55.1 10.5
16th Apucarana HD 95.1 11.2 96.1 11.8 96.5 13.5 97.0 16.8 96.7 15.3 94.7 12.5
17th Londrina HD 70.2 5.6 72.0 6.3 68.8 5.0 68.0 6.1 63.6 6.9 65.5 6.0
18th C. Procópio HD 78.6 17.6 78.1 24.4 78.2 20.5 79.0 24.3 79.7 19.1 81.3 22.4
19th Jacarezinho HD 60.0 15.1 69.7 20.1 75.8 20.5 79.0 22.3 82.1 16.3 85.6 16.0
20th Toledo HD 25.6 13.5 33.6 12.6 30.4 12.7 32.2 12.9 37.7 10.2 35.2 10.3
21st Telêmaco Borba HD 53.7 8.7 60.7 12.0 65.2 12.4 71.7 15.1 73.8 13.7 75.5 25.7
22rd Ivaiporã HD 72.6 10.5 66.5 14.6 74.3 15.2 78.8 19.1 75.6 12.4 73.3 17.8
aúd
e C
ole
tiv
a,
23(2):543-552,
2018
showed high rates permanently, always around or higher than 20 hospitalizations/10,000 inhab. The highest rate found was 37.2 hospitaliza-tions/10,000, in Umuarama health district, from 2004 to 2005 (Table 1).
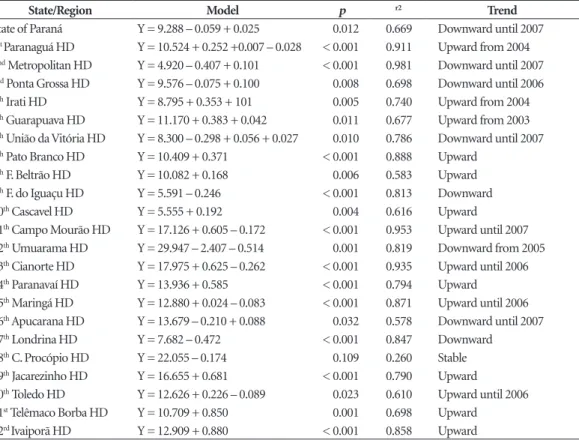
Regarding hospitalization trends, it was found that in nearly 2/3 of the HDs (14 HDs), hospitalizations for diabetes increased, seven HDs showed downward trend, and only one showed stability. Ivaiporã, Telêmaco Borba and Jacarezinho health districts were those with the highest yearly medium increments, representing an increase of almost 1 hospitalization/10,000 in-habitants/year. Umuarama HD showed the high-est historical average (29.9), but has been show-ing downward trend in hospitalization rates, having the greatest yearly average reduction observed, which was 2.4 hospitalizations/10,000 inhabitants. Londrina and the Metropolitan HDs were also among those which showed the greatest average reduction. Though stable, hos-pitalization rates in Cornélio Procópio HD pre-sented a historical average of about 22 hospital-izations/10,000 inhabitants (Table 2).
There was no correlation between hospital-ization rates and the FHS population coverage. However, strong and inverse correlation was found for Paranaguá, Metropolitan, Foz do Ig-uaçu and Umuarama health districts. Pato Bran-co, Campo Mourão, Cianorte Telêmaco Borba and Ivaiporã districts, in turn, showed strong and direct correlations. There was no correlation for the remaining districts (Table 3).
Figure 1 shows that Cornélio Procópio HD
(18th HD), lighter in the map, was the only
pre-senting stability. There is some proximity be-tween the HDs that presented linear upward and upward trend most of the time – the darker ones in the map.
Figure 2 shows some proximity between the HDs that presented strong positive or negative correlation.
Discussion
The greater proportion of hospitalizations in the Metropolitan HD can be explained by the larger
Table 2. Polynomial regression analysis for trend of hospitalizations for Diabetes Mellitus, in the state of Paraná, by Health District, Brazil, 2013.
State/Region Model p r2 Trend
State of Paraná Y = 9.288 – 0.059 + 0.025 0.012 0.669 Downward until 2007
1st Paranaguá HD Y = 10.524 + 0.252 +0.007 – 0.028 < 0.001 0.911 Upward from 2004 2nd Metropolitan HD Y = 4.920 – 0.407 + 0.101 < 0.001 0.981 Downward until 2007
3rd Ponta Grossa HD Y = 9.576 – 0.075 + 0.100 0.008 0.698 Downward until 2006
4th Irati HD Y = 8.795 + 0.353 + 101 0.005 0.740 Upward from 2004
5th Guarapuava HD Y = 11.170 + 0.383 + 0.042 0.011 0.677 Upward from 2003
6th União da Vitória HD Y = 8.300 – 0.298 + 0.056 + 0.027 0.010 0.786 Downward until 2007
7th Pato Branco HD Y = 10.409 + 0.371 < 0.001 0.888 Upward
8th F. Beltrão HD Y = 10.082 + 0.168 0.006 0.583 Upward
9th F. do Iguaçu HD Y = 5.591 – 0.246 < 0.001 0.813 Downward
10th Cascavel HD Y = 5.555 + 0.192 0.004 0.616 Upward
11th Campo Mourão HD Y = 17.126 + 0.605 – 0.172 < 0.001 0.953 Upward until 2007
12th Umuarama HD Y = 29.947 – 2.407 – 0.514 0.001 0.819 Downward from 2005
13th Cianorte HD Y = 17.975 + 0.625 – 0.262 < 0.001 0.935 Upward until 2006
14th Paranavaí HD Y = 13.936 + 0.585 < 0.001 0.794 Upward
15th Maringá HD Y = 12.880 + 0.024 – 0.083 < 0.001 0.871 Upward until 2006
16th Apucarana HD Y = 13.679 – 0.210 + 0.088 0.032 0.578 Downward until 2007
17th Londrina HD Y = 7.682 – 0.472 < 0.001 0.847 Downward
18th C. Procópio HD Y = 22.055 – 0.174 0.109 0.260 Stable
19th Jacarezinho HD Y = 16.655 + 0.681 < 0.001 0.790 Upward
20th Toledo HD Y = 12.626 + 0.226 – 0.089 0.023 0.610 Upward until 2006
21st Telêmaco Borba HD Y = 10.709 + 0.850 0.001 0.698 Upward
A
rr
uda GO
Tabela 3. Coeficientes e significância de correlação entre as internações por Diabetes Mellitus e a proporção de cobertura populacional da ESF, segundo Regional de Saúde, Estado do Paraná, 2000 a 2012.
Health Region Correlation Coefficient p-value Correlation
State of Paraná -0.532* 0.061 No correlation
1st Paranaguá HD -0.603* 0.029 Strong
2nd Metropolitan HD -0.657** 0.015 Strong
3rd Ponta Grossa HD -0.529* 0.063 No correlation
4th Irati HD 0.459** 0.114 No correlation
5th Guarapuava HD 0.427* 0.146 No correlation
6th União da Vitória HD 0.413** 0.160 No correlation
7th Pato Branco HD 0.709* 0.007 Strong
8th F. Beltrão HD 0.523* 0.067 No correlation
9th F. do Iguaçu HD -0.643* 0.018 Strong
10th Cascavel HD 0.307** 0.214 No correlation
11th Campo Mourão HD 0.637** 0.019 Strong
12th Umuarama HD -0.555* 0.049 Strong
13th Cianorte HD 0.626** 0.022 Strong
14th Paranavaí HD 0.440** 0.133 No correlation
15th Maringá HD -0.197* 0.519 No correlation
16th Apucarana HD -0.379** 0.201 No correlation
17th Londrina HD 0.058** 0.851 No correlation
18th C. Procópio HD -0.256** 0.399 No correlation
19th Jacarezinho HD 0.527* 0.064 No correlation
20th Toledo HD 0.313* 0.297 No correlation
21st Telêmaco Borba HD 0.579* 0.038 Strong
22rd Ivaiporã HD 0.868* <0.001 Strong
*Pearson coefficient; **Spearman coefficient.
Figure 1. Map showing the analysis of rate trends of hospitalization for Diabetes Mellitus in the state of Paraná, by Health Districts. Paraná, Brazil, 2000-2012.
Linear upward
Upward trend most of the time Downward trend most of the time
aúd
e C
ole
tiv
a,
23(2):543-552,
2018
population residing in that region, especially be-cause it is where the most populous city in Paraná is located, Curitiba. The present study found re-duction in hospitalization rates and strong cor-relation with the expansion in the number of FHS teams in the Metropolitan HD.
The 108% rise in the FHS population cover-age was higher than that observed in Brazil
be-tween 1998 and 2006, which stood at 86.5%15,
and in Minas Gerais, between 2000 and 2010, where the relative difference between coverages in the beginning and end of the period oscillated
between 26.5% and 74.8%, according to HDs16.
Considering Paraná’s territorial dimensions and administrative divisions, this increase in coverage represents the progress of the process to reorient PHC and the gradual overcoming of barriers in the access to services and socioeconomic
differ-ences between the HDs15. About said differences,
the division of the state into HDs represents the decentralization of healthcare proposed by the Ministry of Health in Brazil, as it is believed that this model of organization, based on regionaliza-tion, favors the access to and efficiency of
health-care networks15.
The drop in rates of hospitalization for dia-betes in Paraná, in general, was also observed in the state of Minas Gerais, 0.85 to 0.80 hospital-izations/1,000 inhabitants, between 2000 and
201016; in the capital city Campo Grande, 5.9 to
3.1 hospitalizations/10,000 inhabitants, between
2000 and 200917; and in the capital city Rio de
Janeiro, among the elderly, 3.8 to 2.6
hospitaliza-tions/1,000 inhabitants, from 2000 to 201018. On
the other hand, just as evidenced in the present study for HDs, for instance, Ivaiporã, there was an increase in the overall rate of hospitalization for diabetes in Juiz de Fora, between 2002 and
200919; in Guarulhos, with increase of 10% in
hospitalizations, between 2008 and 201220; and
even in Poland, between 2005 and 200921.
Although downward trend has been found for the state of Paraná, in most part of the peri-od, most of the HDs studied presented upward trend. In the state of Ceará, the overall trend of hospitalizations for diabetes was upward; how-ever, the analysis stratified by sex performed
found downward trend among women11. As for
Minas Gerais, the difference between 2000 and 2010 rates pointed significant overall reduction in rates; however, the regionalized analysis
iden-tified increase in two HDs16.
Such results may vary largely according to economic, political and environmental determi-nants. A study conducted in Victoria, Australia, points that, in addition to diabetes and its com-plications being the main ACSC among hos-pitalizations of people older than 28 years old,
Figure 2. Map showing the analysis of correlation between rates of hospitalization for Diabetes Mellitus and the family health strategy population coverage, by Health Districts, Paraná, Brazil, 2000-2012.
Strong negative
Strong positive
A
rr
uda GO
variables such as sex, age, rurality, socioeconomic disadvantages and access difficulties are
import-ant predictors for increased hospitalizations22.
Moreover, there is great influence of the structuration of health services in each territory on hospitalizations, with highlight to the orga-nization of the ambulatory service, composition of health teams (which have as an important challenge the establishment of doctors in the lo-cations), qualification of professionals, employ-ment ties, among other eleemploy-ments linked to the
structural dimension23. Therefore, the analysis is
deemed necessary, not only of the results of the assistance, through hospitalizations, for instance, but also of the working process and the structure professionals have to implement their actions.
When it comes to the state of Paraná, the cor-relation between FHS coverage and rates of hos-pitalization for diabetes was nearly significant (p=0.061), in an inverse way and with strong intensity. However, in Paranaguá, Metropolitan, Foz do Iguaçu and Umuarama HDs, the correla-tion analysis suggests that the increase in FHS coverage may have influenced the reduction in rates of hospitalization for diabetes.
Consonantly, a study conducted in the south of Santa Catarina observed that hospitalizations for diabetes presented an upward trend in the population with basic ambulatory care rated as
adequate23. Other studies also observed inverse
correlation between PHC coverage and
hospital-ization for diabetes8,17. However, this question is
pondered, stressing that, even with free access to ambulatory services for underprivileged popula-tions, the latter still present an excessive number
of HACSC10.
In the case in which no correlation was found, it can be inferred that the FHS, which, strictly speaking, should lead to a reduction in hospitalizations for diabetes, may still present difficulties in the implementation of resolutive actions about diabetes, although it is considered the most sensitive one among the ACSC, because the obtainment of positive results requires mini-mal organization from the health service. A study conducted in Rio Grande do Sul also identified higher rates in regions with greater concentra-tion of small cities, and attributes this profile to the fact that hospitals in said cities use their maximum installed capacity. For this reason, they admit more easily cases which would not necessarily need this level of assistance, in order to obtain resources according to the number of
hospitalizations performed24.
In this sense, another study, conducted in Rio Grande do Sul as well, identified strong and
pos-itive correlation between HACSC and FHS cov-erage in municipalities with small-size hospitals, differently from those municipalities which did not have small-size hospitals, indicating lower rates of HACSC in medium-size cities and big
centers25.
It is believed that the same principle can be attributed to HDs where there was direct correla-tion with FHS coverage. That is, “unnecessary” hospitalizations may have influenced this cor-relation. In this way, the coordination power of PHC over the flow of health system users ceases to impact the occupation of hospital beds, and begins to comply with a certain accounting logics that opposes to the model of reorganization of assistance and reaffirms the healing perspective with which health services are impregnated.
Furthermore, it should be taken into consid-eration that the rise in hospitalizations in said HDs, concomitant with that of the FHS coverage, may be linked to improved access, the system’s better capacity for diagnosis, and empty hospital
beds17. Therefore, in the case of chronic
condi-tions, the demand for longer care time, the influ-ence of morbidity profile, the search for health services, and the population’s lifestyle can restrict the assessment of the impact of the FHS on such
conditions17.
Although the population coverage of the ser-vice is an essential component of the health sys-tem’s problem-solving ability, the high HACSC rates man indicate poor access to services offered by PHC or the offering of low-quality services. A systematic review of the literature found that PHC deficiencies were associated with HACSC in different countries, whereas the continuity of care, the performance of the multiprofession-al team and the population served by said team were associated with lower likelihood of
hospi-talization for ACSC26.
The regionalized analysis of diabetes trends and correlations with the FHS can provide sub-sidizes of epidemiological character to the plan-ning of local interventions. In this way, it is pos-sible to meet – besides population needs – mu-nicipal agreements with the Ministry of Health, which include, among other indicators, the rate of hospitalization for diabetes and complications among people aged 30 years or over, as well as the focus on the 30-59 years old age group, as a strat-egy to avoid the aforementioned events, since the longer the diagnosis time, the smaller the success
of interventions26.
Jo-aúd
e C
ole
tiv
a,
23(2):543-552,
2018
inville, Santa Catarina, indicates some charac-teristics of health profile, use of health services and compliance with therapy, which may be associated with hospitalizations, such as type-2 diabetes with evolution time equal or greater than 10 years, comorbidities, re-hospitalizations, non-attendance to PHC consultations in the last 12 months, discrepancies in appointed tions, difficulty of access to specialized consulta-tions, flaws in the performance of drug therapy and low compliance with health practices,
espe-cially the regular practice of exercises27.
As options, strategies coming from clinical management and based on risk stratification and biopsychosocial factors of the population, such as operative groups and supported self-care, can be decisive in the gaining of self-efficacy by PHC users and, consequently, in the achievement of
lower hospitalization rates28. The
implementa-tion of multidisciplinary intervenimplementa-tion programs at basic health units can promote the adoption of health practices among people with diabetes, as pointed by a study conducted in a municipality
in northwestern Paraná29. In general terms, PHC
must be associated with the improvement in de-cision-making as to drug prescriptions, to addi-tional exam requests and to other assessments, including improvement in glycemic control, decrease in consultations with specialists and in
search for emergency services30.
The results of the present study can indicate stalemates in the organization of the health sys-tem at local and regional levels, that is, for each
HD and the state of Paraná. Concerning diabetes, this study may contain subsidizes for the sur-veillance and operationalization of health plan-ning, focusing on the capacity of organization of the health system PHC has. It is worth stressing methodological limitations of the present inves-tigation. First, the use of data from secondary da-tabases, which may present problems concerning the range and quality of information recorded and conveyed by the system and, for this reason, the use of information for epidemiological pur-poses requires caution.
Additionally, the absence of demographic and socioeconomic data may represent a lim-itation as well, as they can constitute important information to be associated with hospital mor-bidity deriving from diabetes. Thus, as a recom-mendation, further investigations should per-form an analysis of hospitalizations, with control of confusion factors represented by demographic and socioeconomic variables, as well as variables concerning local health services, which may re-quire the crossing of data from different sources. Finally, the fact that the information system does not discriminate what individuals are or are not assisted by the FHS, that it does not consider pri-vate hospitalizations and does not allow for the identification of re-hospitalizations, constitutes limitations of this study. Therefore, the correla-tion coefficients evidenced cannot be regarded as consequences derived exclusively from FHS interventions, because confusion variables have not been controlled.
Collaborations
A
rr
uda GO
References
1. International Diabetes Federation. Diabetes atlas upda-te 2012: Regional & Country Facctsheets. [acessado 2013 Dez 3]. Disponível em: http://www.idf.org/diabetes -atlas-update-2012-regional-country-factsheets 2. Brasil. Ministério da Saúde (MS). Vigilância de Fatores
de Risco e Proteção para Doenças Crônicas por Inquérito Telefônico: Vigitel 2011. Brasília: MS; 2011.
3. Schmidt MI, Duncan BB, Silva GA, Menezes AM, Mon-teiro CA, Barreto SM, Chor D, Menezes PR. Chronic non-communicable diseases in Brazil: burden and cur-rent challenges. Lancet 2011; 377(9781):1949-1961. 4. Alfradique ME, Bonolo PF, Dourado I, Lima-Costa MF,
Macinko J, Mendonça CS, et al. Internações por condi-ções sensíveis à atenção primária: a construção da lista brasileira como ferramenta para medir o desempenho do sistema de saúde (Projeto ICSAP – Brasil). Cad Sau-de Publica 2009; 25(6):1337-1349.
5. Brasil. Ministério da Saúde (MS). Portaria 221, de 17 de abril de 2008. Diário Oficial da União 2008; 18 abr. 6. Moura BLA, Cunha, RC, Aquino R, Medina MG, Mota
ELA, Macinko J, Dourado I. Principais causas de inter-nação por condições sensíveis à atenção primária no Brasil: uma análise por faixa etária e região. Rev. Bras. Saude Mater. Infant. 2010; 10(Supl. 1):583-591. 7. Rehem TCMSB, Oliveira MRF, Amaral TCL.
Interna-ções por condiInterna-ções Sensíveis à Atenção Primária em uma metrópole brasileira. Revista da Escola de Enfer-magem da USP 2013; 47(4):884-890.
8. Robbins JM, Valdmanis VG, Webb DA. Do public health clinics reduce rehospitalizations?: the urban diabetes study. J Health Care Poor Underserved 2008; 19(2):562-573.
9. Niefeld MR, Braunstein JB, Wu AW, Saudek CD, Weller WE, Anderson GF. Preventable hospitalization among elderly Medicare beneficiaries with type 2 diabetes. Di-abetes Care 2003; 26(5):1344-1349.
10. Booth GL, Hux JE. Relationship between avoidable hospitalizations for diabetes mellitus and income level.
Archiv Intern Med 2003; 163(1):101-106.
11. Santos FAL, Lima WP, Santos AL, Teston EF, Marcon SS. Hospitalizações por diabetes em adultos e ido-sos no Ceará, 2001-2012. Epidemiol. Serv Saúde 2014; 23(4):655-663.
12. Lobato LVC, Giovanella L. Sistemas de saúde: origens, componentes e dinâmica. In: Giovanella L, Escorel S, Lobato LVC, Noronha JC, Carvalho AI, organizadores.
Políticas e sistema de saúde no Brasil. Rio de Janeiro: Editora Fiocruz; 2008. p. 89-119.
13. Hulley SB, Cummings SR, Browner WS, Grady DG, Newman TB. Delineando a pesquisa clínica: uma abor-dagem epidemiológica. 3ª ed. Porto Alegre: Artmed; 2008.
14. Latorre MRDO, Cardoso MRA. Time series analysis in epidemiology: an introduction to methodological as-pects. Rev Bras Epidemiol 2001; 4(3):145-152. 15. Ceccon RF, Borges DO, Paes LG, Klafke JZ, Viecili PRN.
Mortalidade por doenças circulatórias e evolução da estratégia da saúde da família no Brasil: um estudo eco-lógico. Cien Saude Colet 2013; 18(5):1411-1416. 16. Rodrigues-Bastos RM, Campos EMS, Ribeiro LC,
Bas-tos-Filho MG, Bustamante-Teixeira MT. Internações por condições sensíveis à atenção primária, Minas Ge-rais, 2000 e 2010. Rev Saude Publica 2014; 48(6):958-967.
17. Campos AZ, Theme-filha MM. Internações por condi-ções sensíveis à atenção primária em Campo Grande, Mato Grosso do Sul, Brasil, 2000 a 2009. CadSaude Publica 2012; 28(5):845-855.
18. Marques AP, Montilla DER, Almeida WS, Andrade CLT. Internação de idosos por condições sensíveis à atenção primária à saúde. Rev Saude Publica 2014; 48(5):817-826.
19. Rodrigues-Bastos RM, Campos SEM, Ribeiro LC, Fir-mino RUR, Bustamante-Teixeira MT. Internações por condições sensíveis à atenção primária em município do sudeste do Brasil. Rev Assoc Bras 2013; 59(2):120-127.
20. Melo MD, Egry EY. Determinantes sociais das inter-nações por condições sensíveis à atenção primária em Guarulhos, São Paulo. Rev Esc Enferm USP 2014; 48(Esp):133-140.
21. Gajewska M, Gebska-Kuczerowska A, Gorynski P, Wy-socki MJ. Analyses of hospitalization of diabetes melli-tus patients in Poland by gender, age and place of res-idence. Annals Agric Environm Med 2013; 20(1):61-67. 22. Ansari Z, Haider SI, Ansari H, Gooyer T, Sindall C.
Pa-tient characteristics associated with hospitalisations for ambulatory care sensitive conditions in Victoria, Aus-tralia. BMC Health Serv Res 2012; 12:475.
23. Elias E, Magajenski F. A Atenção Primária à Saúde no Sul de Santa Catarina: uma análise das internações por condições sensíveis à atenção ambulatorial, no período de 1999 a 2004. Rev Bras Epidemiol 2008;11(4):633-647. 24. Dias-da-Costa JS, Buttenbender DC, Hoefel AL, Souza
LL. Hospitalizações por condições sensíveis à atenção primária nos municípios em gestão plena do sistema no Estado do Rio Grande do Sul, Brasil. CadSaude Pu-blica 2010; 26(2):358-364.
25. Soleiman AP. Análise da relação entre internações por condições sensíveis à atenção primária, hospitais de pe-queno porte e estratégia saúde da família no âmbito de uma regional de saúde [tese]. Porto Alegre: Universida-de FeUniversida-deral do Rio GranUniversida-de do Sul; 2013.
26. Nedel FB, Facchini LA, Martín M, Navarro A. Caracte-rísticas da atenção básica associadas ao risco de inter-nar por condições sensíveis à atenção primária: revisão sistemática da literatura. Epidemiologia e Serviços de Saúde 2010; 19(1):61-75.
27. Artilheiro MMVSA, Franco SC, Schulz VC, Coelho CC. Quem são e como são tratados os pacientes que inter-nam por diabetes mellitus no SUS? Saúde Debate 2014; 38(1):210-224.
28. Mendes EV. O cuidado das condições crônicas na Aten-ção Primária à Saúde: o imperativo da consolidaAten-ção da Estratégia Saúde da Família. Brasília: OPAS; 2012 29. Carolino ID, Molena-Fernandes CA, Tasca RS. Risk
factors in patients with type 2 diabetes mellitus. Rev Latino-Am Enferm 2008; 16(2):238-244.
30. Batista SRR, Jardim PCB, Sousa ALL, Salgado CM. Hospitalizações por condições cardiovasculares sen-síveis à atenção primária em municípios goianos. Rev Saude Publica 2012; 46(1):34-34.
Article submitted 02/11/2015 Approved 07/05/2016
Final version submitted 09/05/2016
This is an Open Access article distributed under the terms of the Creative Commons Attribution License BY