1
Universidade Federal de Goiás, Faculdade de Nutrição, Programa de Pós-Graduação em Nutrição e Saúde. R. 227, Qd. 68, s/n., Setor Leste Universitário, 74605-080, Goiânia, GO, Brasil. Correspondência para/Correspondence to: MRG PEIXOTO. E-mail: <[email protected]>.
2
Universidade Federal de Goiás, Faculdade de Medicina, Departamento de Pediatria. Goiânia, GO, Brasil. 3
Universidade Federal de Goiás, Faculdade de Medicina, Departamento de Nefrologia. Goiânia, GO, Brasil.
Anthropometric measurements and
markers of renal function in adults
and older adults
Indicadores antropométricos e
marcadores de função renal
em adultos e idosos
Victoria Araujo Ganzaroli AMADOR1
Ana Tereza Vaz de Sousa FREITAS1
Alessandra Vitorino NAGHETTINI2
Edna Regina Silva PEREIRA3
Maria do Rosário Gondim PEIXOTO1
A B S T R A C T
Objective
To determine whether anthropometric indicators are associated with markers of renal function in adults and older adults.
Methods
This cross-sectional study included 279 adults and older adults attending eight primary healthcare units in eastern Goiânia, Góias. Sociodemographic, lifestyle, and clinical data were collected using a standard questionnaire. Body mass index was categorized as overweight (≥25 kg/m²) or non-overweight. Waist circumference was classified as normal or high; chronic kidney disease was defined as a glomerular filtration rate below 60 mL/minutes/1.73 m²; micro/macroalbuminuria was defined as an albumin/creatinine ratio above 30 mg/g. The association between anthropometric indicators and renal function markers was assessed by multiple linear regression analysis.
Results
filtration rate, characterized as glomerular hyperfiltration. Microalbuminuria was positively associated with body mass index in women.
Conclusion
The prevalences of chronic kidney disease and overweight were high in the study population. Overweight was positively associated with glomerular filtration rate.
Keywords: Albuminuria. Glomerular filtration rate. Nutritional status. Obesity. Renal insuffiemcy, chronic.
R E S U M O
Objetivo
Avaliar a associação entre indicadores antropométricos do estado nutricional e marcadores da função renal em adultos e idosos.
Métodos
Estudo transversal realizado com 279 adultos e idosos atendidos por oito Unidades de Atenção Básica à Saúde da Família da região Leste de Goiânia por meio de visitas domiciliares. Foram coletados dados socioeconômicos, de estilo de vida e clínicos. Para avaliação do estado nutricional foi considerado o índice de massa corporal, com classificação para excesso de peso (≥25 kg/m²) e sem excesso de peso; também foi avaliada a circunferência da cintura, caracterizada como aumentada ou normal. Para o diagnóstico de doença renal crônica foi considerada uma taxa de filtração glomerular <60 mL/minutos/1,73m² e para detecção de presença de albuminúria mo-deradamente/acentuadamente aumentada foi considerada a relação albumina/creatinina urinária >30 mg/g. A associação entre os indicadores antropométricos e marcadores da função renal foi avaliada com regressão linear múltipla.
Resultados
A prevalência de doença renal crônica foi de 8,9% e de albuminúria foi de 34,8%. O excesso de peso foi detectado em 57,0% da amostra. Houve associação positiva do índice de massa corporal e da circunferência da cintura com a taxa de filtração glomerular em ambos os sexos (p<0,01), enquanto a albuminúria apresentou associação positiva somente com o índice de massa corporal e apenas em mulheres (p=0,016).
Conclusão
A amostra apresentou alta prevalência de doença renal crônica e excesso de peso, sendo que os indicadores antropométricos apresentaram associação positiva com a taxa de filtração glomerular.
Palavras-chave: Albuminúria. Taxa de filtração glomerular. Estado nutricional. Obesidade. Insuficiência renal
crônica.
I N T R O D U C T I O N
Chronic Kidney Disease (CKD) consists of renal lesion and progressive and irreversible loss of the endocrine, glomerular, and tubular kidney functions present for three months or more with various health implications1. Important clinical
implications appear2 when the glomerular
filtration rate is below 60 mL/minutes/1.73 m².
In Brazil chronic kidney disease has an incidence of approximately 115 cases for every one million inhabitants, while its prevalence is roughly 500 cases in every one million inhabitants3. The increasing incidence and
prevalence of CKD is directly associated with an increase in the main risk factors associated with its development and progression, such as excess weight, high blood pressure, diabetes, personal and family history of CKD, smoking, age higher than 60 years, low socioeconomic class, alcoholism, and physical inactivity4-6.
CKD8-11. Abdominal obesity, one of the components of the metabolic syndrome, dramatically increases the rates of metabolic, cardiovascular, and renal diseases globally12.
Excess weight, characterized by an increase in Body Mass Index (BMI) or waist circumference, increases the number of adipocytes in the body, which increase oxidative stress and inflammatory status, which in turn many result in renal failure associated with overweight and obesity13,14.
In addition to assessing nutritional status, one should also assess the main biochemical markers used for screening kidney disease. These markers include albuminuria and serum creatinine, used for estimating the glomerular filtration rate2,15.
Since the initial stages of CKD are asymptomatic and CKD development and progression have numerous risk factors, epidemiological, clinical, and nutritional surveillance should be conducted by primary healthcare, whose critical role is to try to contain its growing incidence and mortality2,3. National data on the association between anthropometric indicators and markers of renal function, and on the prevalence of CKD in the population covered by the Family Health Strategy are scarce. Thus, this study aimed to assess the association between anthropometric indicators of nutritional status and markers of renal function in adults and older adults.
M E T H O D S
This is a cross-sectional study originating from a parent project called “Mapping of chronic kidney disease and its risk factors in families covered by the Family Health Strategy of eastern Goiânia”. The study was approved by the Human and Animal Medical Research Ethics Committee of the Clinics Hospital of the Universidade Federal de Goiás under Protocol nº CEPMHA/HC/UFG nº 170/09. The sample of the parent study represented the users of eight Family Health
Strategy units in eastern Goiânia, who were interviewed at home. The households were selected randomly in the catchment area of each unit. The study included males and females living in the selected households aged ≥6 years covered by the Family Health Strategy. Individuals who could not walk or were hospitalized at the time of data collection were excluded.
The study sample consisted of 279 adults and older adults submitted to biochemical tests and anthropometric assessment. A posteriori calculation showed that the sample size (n=279) allowed estimating the prevalence of CKD in the study population with an error margin of 3.5%, considering an expected prevalence of 9.6% and confidence level of 95.0%. For the measures of association, the study16 had a power of 90.0% (β=10.0%) and a confidence level of 95.0% (α=5.0%) for detecting significant correlations between the anthropometric indicators and outcomes ≥2.0.
Data were collected from September 2011 to March 2013 after conducting a pilot study with 10 families. Trained interviewers accompanied by community health agents used a standardized questionnaire to collect socioeconomic, demographic, lifestyle, anthropometric, and laboratory data in home interviews.
Socioeconomic class was classified as recommended by the Critério Padrão de Classifi-cação Economica Brasil - 200817. The socioeconomic classes were grouped because of the small sample size as follows: class A/B, class C, and class D/E; class A/B consists of individuals with the highest income and class D/E, of individuals with the lowest income.
ex-smoker (quit smoking six or more months ago); and nonsmoker (never smoked)19.
Weight, height, and waist circumference were collected using the standard procedures20. The individuals were weighed and measured barefoot, wearing light clothing, by the electronic scale Plenna (São Paulo, Brazil - capacity of 150 kg and accuracy of 100 g) and portable stadiometer Seca (Cotia, São Paulo, Brazil - accuracy of 0.1 cm). Waist circumference was measured by an inelastic tape measure (accuracy of 0.1 cm) at the midpoint between the anterior superior iliac crest and the last rib. BMI was calculated by dividing body weight by the square of the height.
Body mass index was classified into two categories only, non-overweight and overweight. Adults with BMI <25 kg/m² and older adults with BMI ≤27 kg/m² were considered non-overweight. Adults with BMI ≥25 kg/m² and older adults with BMI >27 kg/m² were considered overweight21,22. Waist circumference was classified as recommended by the World Health Organization22: women with Waist circumference >80 cm and men with waist circumference >94 cm are considered at higher risk of obesity-related metabolic complications.
The percentage of Body Fat (%BF) was given by the formula proposed by Deurenberg et al.23: %BF= (1.2 x BMI) + (0.23 x age) - (10.8 x sex) - 5.4, where BMI is measured in kg/m², age in years; and female sex = 0 and male sex = 1. The cut-off point for high %BF was 32% for females and 25% for males24.
Blood pressure was measured by the semi-automatic devices Omron - HEM 705 CP (Omoron Health Care, São Paulo, Brazil), using the technique standardized by the VI Brazilian Guideline for Hypertension. Blood pressure was measured in both arms at the beginning of the interview and again in the arm with the higher value at the end of the interview. Both measurements were made by the same interviewer. The analyses used the mean of the baseline and final Blood pressure measurements. Individuals with casual systolic blood pressure ≥140 mmHg and/or casual diastolic
blood pressure ≥90 mmHg were considered
hypertensive25.
Individuals with a diagnosis of diabetes, using antidiabetic drugs, or whose fasting blood glucose ≥126 were considered diabetic26.
The markers of renal function were: serum creatinine (for calculating the Glomerular Filtration Rate [GFR] and determining hypercreatininemia), urinary creatinine, and urinary albumin (for calculating the albumin/creatinine ratio). Albumin and creatinine were quantified by the biochemical analyzer Konelab 30 (Thermo Fisher Scientific Inc., Wattham, Massachusetts, United States), albumin by the colorimetric method (bromocresol green) and creatinine by the kinetic method.
Glomerular filtration rate was calculated by the method proposed by Cockcroft & Gault15, which includes the variables serum creatinine, weight, age, and sex. Any individual with a GFR <60 mL/minutes/1.73m2 regardless of cause was considered CKD positive1.
Microalbuminuria was defined as urinary albumin/creatinine ratio between 30 and 299 mg; macroalbuminuria was defined as urinary albumin/creatinine ratio ≥300 mg1. Individuals with micro- and macroalbuminuria were grouped together for data analysis because the number of individuals with macroalbuminuria was low (n=2). Hypercreatininemia was defined as serum creatinine >1.3 mg/dL27.
Chi-square test. The differences between the continuous variables were measured by the Student’s t test or the Mann-Whitney test. Spearman’s correlation coefficient determined whether BMI and waist circumference were correlated.
Multiple linear regressions assessed the independent effect of anthropometric indicators (BMI and waist circumference) on GFR and albuminuria (dependent variables) adjusted for age, mean diastolic and systolic blood pressure, and diabetes Mellitus status. The significance level was set at 5% (p<0.05). The dependent variables were transformed to a logarithmic scale to achieve normal distribution.
R E S U L T S
A total of 279 individuals were assessed, 70.9% females and 22.6% older adults. The prevalence of CKD, defined as a GFR ≤60 mL/minutes, was 8.9% in the population covered by the Family Health Strategy in east Goiânia. Micro- and macroalbuminuria were present in 34.8% of the sample.
Table 1 shows the general characteristics of the participants. The median age was 45 years and did not differ between the genders. The frequency of BMI-based overweight was 57%, which also did not differ between the genders. High waist circumference was more common in
Table 1. Sociodemographic and health characteristics of users of the Family Health Strategy in Eastern Goiânia (GO), Brazil, 2013.
Age (years)
Socioeconomic class
A/B C D/E
Regular physical activity
Yes No
Body mass index
Non-overweight Overweight
Percentage of body fat
Normal High
Waist circumference
Normal High
Systolic blood pressure (mmHg) Diastolic blood pressure (mmHg) High blood pressure
Smokers
Casual glycemia (mg/dL) Diabetes
Serum creatinine (mg/dL) Hypercreatininemia Urinary albumin (mg/dL) Micro/macroalbuminuria
Glomerular filtration rate (mL/minutes) Chronic kidney disease
Note: *p-value of the Chi-square test (categorical variables) or Mann-Whitney test (continuous variables).
The continuous variables are presented as median and interquartile range (P25-P75); and the categorical variables as number (percentage). Chronic
kidney disease defined as glomerular filtration rate <60 mL/minutes. The differences in absolute frequencies correspond to the missing values.
Variable Total n=279
females (p<0.001). Waist circumference was highly correlated with BMI (r=0.80) in both genders.
Regarding the study chronic non-communicable diseases, 32 (11.6%) individuals were diabetic and 85 (30.4%) were hypertensive, with no differences between the genders. Males had higher median serum creatinine (0.93 mg/dL).
The median urinary albumin was 13 mg/dL, with no differences between the genders. Hypercreati-ninemia was found in 60 (21.5%) individuals, mostly males (p=0.015).
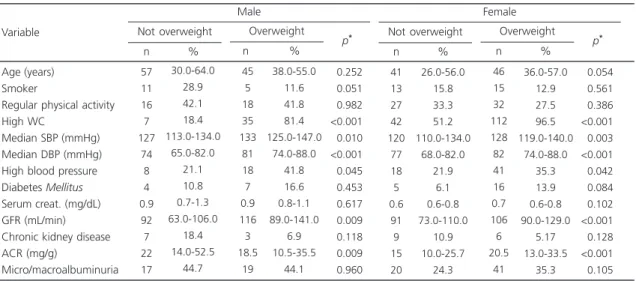
Table 2 shows the clinical and lifestyle characteristics, and markers of renal function according to BMI. High waist circumference and
Table 2. Clinical and lifestyle characteristics, and markers of renal function according to the body mass index of users of the Family Health Strategy, eastern Goiânia (GO), Brazil, 2013.
Age (years) Smoker
Regular physical activity High WC
Median SBP (mmHg) Median DBP (mmHg) High blood pressure Diabetes Mellitus
Serum creat. (mg/dL) GFR (mL/min) Chronic kidney disease ACR (mg/g)
Micro/macroalbuminuria
Variable Not overweight
57 11 16 7 127 74 8 4 0.9 92 7 22 17 30.0-64.0 28.9 42.1 18.4 113.0-134.0 65.0-82.0 21.1 10.8 0.7-1.3 63.0-106.0 18.4 14.0-52.5 44.7 n % Overweight 45 5 18 35 133 81 18 7 0.9 116 3 18.5 19 38.0-55.0 11.6 41.8 81.4 125.0-147.0 74.0-88.0 41.8 16.6 0.8-1.1 89.0-141.0 6.9 10.5-35.5 44.1 n % <0.252 <0.051 <0.982 <0.001 <0.010 <0.001 <0.045 <0.453 <0.617 <0.009 <0.118 <0.009 <0.960 p* Male Not overweight 41 13 27 42 120 77 18 5 0.6 91 9 15 20 26.0-56.0 15.8 33.3 51.2 110.0-134.0 68.0-82.0 21.9 6.1 0.6-0.8 73.0-110.0 10.9 10.0-25.7 24.3 n % Overweight 46 15 32 112 128 82 41 16 0.7 106 6 20.5 41 36.0-57.0 12.9 27.5 96.5 119.0-140.0 74.0-88.0 35.3 13.9 0.6-0.8 90.0-129.0 5.17 13.0-33.5 35.3 n % <0.054 <0.561 <0.386 <0.001 <0.003 <0.001 <0.042 <0.084 <0.102 <0.001 <0.128 <0.001 <0.105 p* Female
Note: *p-value in the Chi-square test (categorical variables) or Mann-Whitney test (continuous variables).
WC: Waist Circumference; SBP: Systolic Blood Pressure; DBP: Diastolic Blood Pressure; Serum creat.: Serum Creatinine; GFR: Glomerular Filtration Rate; ACR: Urinary Albumin/Creatinine Ratio.
Table 3. Clinical and lifestyle characteristics, and markers of renal function according to the waist circumference of users of the
Family Health Strategy, eastern Goiânia (GO), Brazil, 2013
Age (years) Smoker
Regular physical activity Median SBP (mmHg) Median DBP (mmHg) High blood pressure Diabetes Mellitus
Serum creatinine (mg/dL) GFR (mL/min)
Chronic kidney disease ACR (mg/g)
Micro/macroalbuminuria
Variable Normal WC
47 8 13 127 75 8 3 0.8 100 4 20 15 30.0-63.0 20.5 33.3 114.0-134.0 70.0-82.0 20.5 7.8 0.7-1.1 71.0-118.0 10.2 11.0-40.0 38.4 n % High WC 47 8 21 133 81 18 8 0.9 102 6 23 21 38.0-57.0 19.1 50.0 122.0-145.0 74.0-88.0 42.8 19.5 0.8-1.3 74.0-141.0 14.2 12.0-42.0 50.0 n % <0.830 <0.869 <0.129 <0.030 <0.016 <0.031 <0.136 <0.061 <0.060 <0.582 <0.771 <0.296 p* Male (n=81) Normal WC 32 7 13 118 75 8 2 0.7 95 4 15 8 22.0-44.0 16.0 30.2 111.0-129.0 68.0-81.0 18.2 4.5 0.6-0.7 80.0-116.0 9.1 11.0-22.0 18.2 n % High WC 47 21 46 127 80 51 19 0.7 99 11 19 53 36.0-61.0 13.6 29.8 118.0-140.0 73.0-87.0 33.1 12.5 0.6-0.8 80.0-122.0 7.1 11.0-33.0 34.4 n % <0.001 <0.703 <0.963 <0.004 <0.007 <0.056 <0.133 <0.424 <0.420 <0.667 <0.139 <0.040 p* Female (n=198)
Note: *p-value in the Chi-square test (categorical variables) or Mann-Whitney test (continuous variables).
GFR were more common in overweight than in non-overweight males (p<0.05). Similar results were found in females.
Table 3 shows the clinical and lifestyles characteristics, and markers of renal function according to waist circumference. The markers of renal function did not differ significantly in males. However, in females the frequency of micro- and macroalbuminuria was higher in those with high waist circumference (p=0.04).
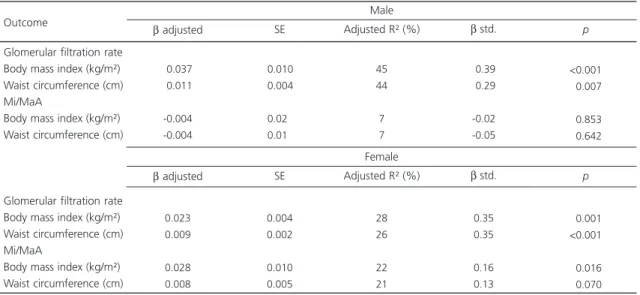
The multiple linear regression model (Table 4) showed that for each 1 kg/m2 increase in BMI, log GFR increased 0.037±0.01 mL/minutes in males (p<0.001) and 0.023±0.004 mL/minutes in females (p=0.001). For each 1 cm increase in waist circumference, log GFR increased 0.0011±0.37 mL/minutes in males (p=0.007) and 0.009±0.002 mL/minutes (p<0.001) in females.
Only body mass index was associated with albuminuria. For each 1 kg/m2 increase in BMI, log albuminuria increased 0.028±0.01 mL/minutes in females (p=0.016).
D I S C U S S I O N
Overweight based on BMI and abdominal obesity based on waist circumference were positively associated with GFR. Albuminuria was associated with high waist circumference only in females. Moreover, the study sample had a high prevalence of CKD (8.9%).
This prevalence is similar to those found in other Brazilian cities. In Juiz de Fora (MG) the prevalence of CKD in individuals aged more than 18 years was 9.6%9, and in São Paulo (SP) the prevalence in adults was 8.4%28.
The prevalence of CKD in the study sample was similar to the prevalences reported by foreign studies, such as two studies from Peking (China), which found prevalences of 9.4% in 200629 and 10.8% in 201230. In Liege (Belgium) the prevalence of CKD was 9.8%31. However, some studies find higher prevalences of CKD, ranging from 15.3% in a community of ethnic minorities in China32 to 21.8% in Iran33. Hence, the prevalence of CKD in the global population, especially in developing
Table 4. Results of the multiple linear regression models that assess whether body mass index and waist circumference are associated
with the markers of renal function. Goiânia (GO), Brazil, 2013.
Glomerular filtration rate Body mass index (kg/m²) Waist circumference (cm) Mi/MaA
Body mass index (kg/m²) Waist circumference (cm)
Glomerular filtration rate Body mass index (kg/m²) Waist circumference (cm) Mi/MaA
Body mass index (kg/m²) Waist circumference (cm)
-0.037
-0.011
-0.004 -0.004
Outcome
0.010 0.004
0.020
0.010
45 44
7 7
-0.39
-0.29
-0.02 -0.05
β adjusted SE Adjusted R² (%) β std.
<0.001
<0.007
<0.853
<0.642
p
Male
β adjusted SE Adjusted R² (%) β std. p
Female
0.023 0.009
0.028 0.008
0.004 0.002
0.010 0.005
28 26
22 21
0.35 0.35
0.16 0.13
<0.001 <0.001
<0.016
<0.070
Note: Linear regression results are expressed as β coefficient ± standard error and standardized β coefficient (standardized measure that verifies the effects of anthropometric parameters on glomerular filtration rate). Models adjusted for age, diabetes Mellitus, and systolic and diastolic blood pressure.
countries, is already a serious public health problem12,28,33.
The 34.7% prevalence of micro- and macroalbuminuria in the study sample is similar to the 38.8% found in Tibet34. Smaller prevalences have been found in other locations, varying from 4.51 to 12.5%28,30,33,35. This difference between the prevalences can be explained by the fact that albuminuria increases gradually according to age and many studies did not include older adults. Król et al.36 found that the prevalence of albuminuria increased from 8.8% in younger individuals to 32.0% in older adults, pointing out the influence of age. Brown et al.37 reported that the prevalences of albuminuria increase when family members of CKD patients are included in a study since family history has a direct influence on kidney disease.
The present study collected data from individuals belonging to the same family and many already had CKD (8.9% of the sample), justifying the high prevalence of albuminuria. Boer et al.38 believe that the prevalence of microalbuminuria can vary greatly if two consecutive albuminuria tests are not performed.
The present study found a frequency of hypercreatininemia of 21.5%. On the other hand, two other studies conducted in Brazil, one in Salvador (BA)27 and another in Bambuí (MG)39 reported hypercreatininemia prevalences of 3.1 and 5.1%, respectively. These differences may be explained by the different serum creatinine cut-off points used by the three studies - the present study used a cut-off point of 1.3 mg/dL. Additionally, antihypertensive drugs and higher age increase creatinine levels in males27,40,41.
Excess weight is considered a risk factor for the onset of CKD, and its prevalence has increased significantly in all continents3. The frequency found by this study was similar to those reported by other studies41-43.
In this study excess weight based on BMI and central obesity based on waist circumference were positively associated with high GFR. Other studies found similar results41,43-45.
Excess weight increases sodium retention in renal tubules, reducing sodium excretion in the urine. To reduce the effects of retention in the short run, the body expands the intravascular volume, increases blood pressure and plasma flow in the kidneys, and increases the GFR, resulting in glomerular hyperfiltration, which reinforces the positive association between anthropometric indicators and GFR. However, as this scenario persists in the long run, microalbuminuria would develop followed by a decrease in GFR46.
Higher body weight may increase angiotensinogen expression in adipocytes, with greater formation of circulating angiotensin II and consequently, more lipogenesis. This mechanism changes blood pressure homeostasis, which may also change glomerular homeostasis47.
Obesity also affects the structure of the renal medulla because adipose tissue on the renal capsule, which is more developed in overweight individuals, may penetrate the renal medulla and compress the glomerular and tubular filtration systems, leading to higher blood pressure to compensate nephron compression, which in turn increases GFR and consequently, causes hyperfiltration and higher tubular reabsorption of sodium48.
The current study used the formula for estimating the glomerular filtration rate proposed by Cockcroft & Gault15, but this formula is known for not taking into account the low excretion of creatinine in obese individuals, resulting in an overestimation of the GFR of individuals with BMI >25 kg/m² 49. In Brazil Napoli-Filho et al.41 found that renal function estimated by the formula of Cockcroft-Gault was overestimated by 8.0% in individuals with BMI between 25 and 30 kg/m² and by as much as 29.6% in individuals with grade III obesity.
Boer et al.38 found that BMI and waist circumference were associated with a greater likelihood of albuminuria. Clinical studies suggest that adiponectin can have a key role in the development of obesity-related albuminuria51. Moreover, high leptin secretion in individuals with abdominal obesity is one of the mechanisms associated with the development of albuminuria. The development of CKD varies between males and females, and Franceschini et al.14 found that central obesity in menopausal women is associated with the risk of CKD development and progression, even in women with normal BMI. This study did not investigate albuminuria.
The cross-sectional design of the present study does not allow identifying what occurs between exposure and outcome. Other limitations include the small number of older adults in the sample and the instrument used for assessing the level of physical activity: although widely used, it is limited because of its lack of quantitative accuracy.
The high prevalence of CKD found by this population-based study reinforces the need of primary healthcare to identify and control early on the risk factors for CKD. The anthropometric indicators emphasize the importance of intensifying the strategies that prevent increases in BMI and waist circumference in adults and older adults.
C O N C L U S I O N
The study sample had a high prevalence of chronic kidney disease and excess weight. The anthropometric indicators body mass index and waist circumference were positively associated with glomerular filtration rate in both genders.
C O N T R I B U T O R S
VAG AMADOR, AV NAGHETTINI, and ERS PEREIRA participated in data collection and analysis, literature search, and article writing. ATVS FREITAS
participated in literature search and article writing. MRG PEIXOTO participated in data analysis, literature search, and article writing.
R E F E R E N C E S
1. Kidney Disease Improving Global Outcomes CKD Work Group. KDIGO 2012 clinical practice guideline for the evaluation and management of chronic kidney disease. Kidney Int Suppl. 2013; 3(1):1-150.
2. Kwon KS, Bang H, Bomback AS, Koh DH, Yum JH, Lee JH, et al. A simple prediction score for kidney disease in the Korean population. Nephrology. 2012; 17(3):278-84. https://dx.doi.org/10.1111/ j.1440-1797.2011.01552.x
3. Jha V, Garcia-Garcia G, Iseki K, Li Z, Naicker S, Plattner B, et al. Chronic kidney disease: Global dimension and perspectives. Lancet. 2013; 382(9888):260-72. https://dx.doi.org/10.1016/S01 40-6736(13)60687.x
4. Cabrera SS. Definición y classificación de lós estádios de La enfermedad renal crónica: prevalência, claves para el diagnóstico precoz, factores de riesgo de enfermedad renal crónica. Nefrologia. 2004; 24(6):27-34.
5. Dummer CD, Thomé FS, Veronese FV. Doença renal crônica, inflamação e aterosclerose: novos conceitos de um velho problema. Rev Assoc Med Bras. 2007; 53(5):446-50.
6. Levey AS, Coresh J. Chronic kidney disease. Lancet. 2012; 379(1):165-80. https://dx.doi.org/10.1016/S0 140-6736(11)60178-5
7. Martins KA, Monego ET, Paulinelli RR, Freitas-Junior R. Comparação de métodos de avaliação da gor-dura corporal total e sua distribuição. Rev Bras Epidemiol. 2011; 14(4):677-87.
8. França AKT, Santos AM, Calado IL, Santos EM, Cabral PC, Salgado JVL, et al. Filtração glomerular e fatores associados em hipertensos atendidos na atenção básica. Arq Bras Cardiol. 2009; 94(6):779-87. 9. Bastos RMR, Bastos MG, Ribeiro LC, Bastos RV, Teixeira MTB. Prevalência da doença renal crônica nos estágios 3, 4 e 5 em adultos. Rev Assoc Med Bras. 2009; 55(1):40-4.
10. Ejerblad E, Fored M, Lindblad P, Fryzek J, McLaughlin JK, Nyre O. Obesity and risk for chronic renal failure. J Am Soc Nephrol. 2006; 17(6):1695-702. https:// dx.doi.org/10.1681/ASN.2005060638
12. Huda MN, Alam KS, Rashid HU. Prevalence of chronic kidney disease and its association with risk factors in disavantageous population. Int J Nephrol. 2012; 12(1):1-7. https://dx.doi.org/10.1155/2012/2 67329
13. Ruster C, Wolf G. Adipokines promote chronic kidney disease. Nephrol Dial Transplant. 2013; 28(Suppl. 4):iv8-14. https://dx.doi.org/10.1093/ ndt/gft191
14. Franceschini N, Gouskova NA, Reiner AP, Bostom A, Howard BV, Pettinger M, et al. Adiposity patterns and the risk for ESRD in postmenopausal women. Clin J Am Soc Nephrol. 2014; 10(2):1-10. https:// dx.doi.org/10.2215/CJN.02860314
15. Cockcroft DW, Gault MH. Prediction of creatinine clearance from serum creatinine. Nephron. 1976; 16(1):31-41.
16. Hulley SP, Cummings SR. Designing Clinical research an epidemiologic approach. Baltimore: Williams & Wilkin; 1988.
17. Associação Brasileira dos Institutos de Pesquisa de Mercado. Critério padrão de classificação econô-mica Brasil-2008. Rio de Janeiro: Abep; 2007. 18. Organização Mundial de Saúde. Estratégia global
em alimentação saudável, atividade física e saúde. Brasília: OMS; 2004.
19. Organización Panamericana de la Salud. Protocolo y directrices: conjunto de ações para la reducción multifactorial de enfermedades no transmisibles (CARMEN/CINDI). Washington (DC): OPAS; 1997.
20. Lohman TG, Roche AF, Martorell R. Antropometric standardization reference manual. Champaign (IL): Human Kinetics; 1988.
21. Lipschitz DA. Screening for nutritional status in elderly. Prim Care. 1994; 21(1):55-67.
22. World Health Organization. Obesity: Preventing and managing the global epidemic. Technical Report Series, nº 894. Geneva: WHO; 2000.
23. Deurenberg P, Weststrate JA, Seidell JC. Body mass index as a measure of body fatness: Age- and sex-specific prediction formulas. Br J Nutr. 1991; 65(2):105-14.
24. Lohman TG. Advances in body composition assessment. Champaign (IL): Human Kinectis Publishers; 1992.
25. Sociedade Brasileira de Cardiologia, Sociedade Brasileira de Hipertensão, Sociedade Brasileira de Nefrologia. VI Diretrizes Brasileiras de Hipertensão. Arq Bras Cardiol. 2010; 95(1):1-51.
26. Sociedade Brasileira de Diabetes. Diretrizes da So-ciedade Brasileira de Diabetes 2013/2014. São Paulo: AC Farmacêutica; 2014.
27. Lessa I. Níveis séricos de creatinine: hipercreatininemia em segmento da população adulta de Salvador. Rev Bras Epidem. 2004; 7(2):176-86.
28. Lima AO, Kesrouani S, Gomes A, Cruz J, Mastroianni-Kirstajn G. Population screening for chronic kidney disease: A survey involving. Nephrol Dial Transplant. 2012; 27(Suppl. 3):35-8. https:// dx.doi.org/10.1093/ndt/gfs063
29. Zhang LX, Topley N, Ito T. Interleukin-6 regulation of transforming grown factor (TGF)-beta receptor compartmentalization and turnover enhances TGF-beta 1 signaling. J Biol Chem. 2005; 280(13): 12239-45.
30. Zhang LX, Wang F, Wang L, Wang W, Liu J, Chen M, et al. Prevalence of chronic kidney disease in China: A cross-sectional survey. Lancet. 2012; 379(9818):815-22.
31. Delanaye P, Cavalier E, Moranne O, Lutteri L, Krzesinski JM, Bruyere O. Creatinine-or cystatin C-based equations to estimate glomerular filtration in the general population: Impact on the epidemiology of chronic kidney disease. BMC Nephrol. 2013; 14(57):2-10.
32. Tohidi M, Hasheminia M, Mohebi R, Khalili D, Hosseinpanah F, Yazdani B, et al. Incidence of chronic kidney disease and its risk factors, results of over 10 year follow up in an Iranian cohort. PLoS One. 2012; 7(9):e45304. https://dx.doi.org/10. 1371/journal.pone.0045304
33. Xue C, Ye XD, Li W, Peng Q, Ding HY, Zhang YH, et al. Prevalence of chronic kidney disease in Jing adults in China: A village-based study. Clin Nephrol. 2013; 79(1):50-6. https://dx.doi.org/10.5414/ CN107511
34. Chen W, Liu Q, Wang H, Chen W, Johnson RJ, Dong X, et al. Prevalence and risk factors of chronic kidney disease: A population study in the Tibetan population. Nephrol Dial Transplant. 2011; 26(5):1592-99. https:// dx.doi.org/10.1093/ndt/gfq608
35. Shan Y, Zhang Q, Liu Z, Hu X, Liu D. Prevalence and risk factors associated with chronic kidney disease in adults over 40 years: A population study from Central China. Nephrology. 2010; 15(1):354-61. 36. Król E, Rutkowski B, Czarniak P. Early detection of
chronic kidney disease: Results of the PolNef study. Am J Nephrol. 2009; 29(3):264-73.
37. Brown WW, Peters RM, Ohmit SE. Early detection of kidney disease in community settings: The Kidney Early Evaluation Program (KEEP). Am J Kidney Dis. 2003; 42(1):22-35.
39. Passos VMA, Barreto SM, Lima-Costa MFF. Detection of renal disfunction based on sérum creatinine levels in a Brazilian community: The Bambui Health and Ageing Study. Bras J Med Biol Res. 2003; 17(11):3135-44.
40. Culleton BF, Larson MG, Evans JC, Wilson PW, Barret BJ, Parfrey PS, et al. Prevalence and correlates of elevated serum creatinine levels: The Framinghan Heart Study. Arch Int Med. 1999; 159(5):1785-90. 41. Napoli-Filho M, Burnmeister JE, Miltersteiner DR, Campos BM, Costa MG. Estimativa da função renal pela fórmula de Cockcroft e Gault em pacientes com sobrepeso ou com obesidade. J Bras Nefrol. 2008; 30(3):185-91.
42. Ramkumar N, Cheung AK, Pappas LM, Roberts WL, Beddhu S. Association of Obesity with Inflammation in Chronic Kidney Disease: A cross-sectional study. J Ren Nutr. 2004; 14(4):201-7.
43. Kao YM, Chen JD. Inverse association between body mass index and chronic kidney disease in older diabetic adults. Ann Epidemiol. 2013; 23:255-9. https://dx.doi.org/10.1016/j.annepidem.2013. 03.005
44. Gerchman F, Tong J, Utzschneider K, Zraika S, Udayasankar J, McNeely MJ. BMI is associated with increased creatinine clearance by a mechanism independent of body fat distribution. J Clin Endocrinol Metab. 2009; 94(10):3781-88.
45. Kalantar-Zadeh K, Abbott KC, Salahudeen AK, Kilpatrick RD, Horwich TB. Survival advantages of obesity in dyalisis patients. Am J Clin Nutr. 2005; 81:543-54.
46. Gross JL, Azevedo MJ, Silverio SP, Canani LH, Caramori ML, Zelmanovitz T. Diabetic nephropathy: Diagnosis, prevention and treatment. Diabetes Care. 2005; 28(1):164-76.
47. Kim S, Soltani-Bejnood M, Quignard-Boulange A, Massiera F, Teboul M, Ailhaud G, et al. The adipose renin-angiotensin modulates systemic markers of insulin sensitivity and activates the intrarenal renin-angiotensin system. J Biomed Biotechnol. 2006; 20(5):212-17.
48. Chagnac A, Weinstein T, Herman M, Hirsh J, Gafter U, Ori Y. The effects of weight loss on renal function in patients with severe obesity. J Am Soc Nephrol. 2003; 14:1480-86. https://dx.doi.org/10.1097/01. ASN.0000068462.38661.89
49. Gabriel IC, Nishida SK, Mastroianni-Kirsztajn G. Cistatina C sérica: uma alternativa prática para ava-liação de função renal? J Bras Nefrol. 2011; 33(2):261-7.
50. Thoenes M, Reil JC, Khan BV, Bramlage P, Volpe M, Kirch W, et al. Abdominal obesity is associated with microalbuminuria and an elevated cardiovascular risk profile in patients with hypertension. Vasc Health Risk Manag. 2009; 5(4):577-85.
51. Sharma K. The linkbetween obesity and albuminuria: Adiponectin and podocyte dysfunction. Kidney Int Suppl. 2009; 76(2):145-8. https://dx.doi.org/10. 1038/ki.2009.137