FREE THEMES
1 Escola de Enfermagem, Universidade Federal de Minas Gerais. Av. Alfredo Balena 190, Santa Efigênia. 30130-100 Belo Horizonte MG Brasil.
[email protected] 2 Departamento de Epidemiologia. Faculdade de Saúde Pública, Universidade de São Paulo. São Paulo SP Brasil. 3 Diretoria de Pesquisas, Instituto Brasileiro de Geografia e Estatística. Rio de Janeiro RJ Brasil. 4 Instituto de Comunicação e Informação Científica e Tecnológica em Saúde, Fundação Oswaldo Cruz. Rio de Janeiro RJ Brasil. 5 Agência Nacional de Saúde. Brasília DF Brasil. 6 Departamento de Medicina Preventiva, Universidade Federal de São Paulo. São Paulo SP Brasil.
Private Health Care Coverage in the Brazilian population,
according to the 2013 Brazilian National Health Survey
Abstract This study aims to present the percent-ages of the Brazilian population holding health insurance plans, itemized by social-demographic characteristics, based on the data of the National Health Survey carried out in 2013, and to compare this information with the administrative data of the National Supplementary Health Agency for the same year. Data from the National Health Survey, and from the Beneficiaries Information System of the National Health Agency for the year 2013, were used. The percentage of people having a health plan was described according to stratifi-cation for: all of Brazil, urban/rural, Brazilian of-ficial Regions, Brazilian States and state capitals, gender, age group, level of schooling, position in the workforce, ethnic classification, and self-assessed state of health. Results include the following: The percentage of people saying they had some health plan in Brazil was 27.9% (CI 95%: 27.1-28.8). A significant difference was found relating to level of schooling – the percentage being highest for those who stated they had complete secondary education (68.8% CI 95%: 67.2-70.4) and for those who said they were currently in work (32.5% CI 95%: 31.5-33.5). The increase in health plan coverage in the Brazilian population reflects the improvement of the suply of employment and the growth in the country’s economy.
Key words Pre-paid health plans, Prevalence of
private health plans, Epidemiological surveys, Health services, Brazil
Deborah Carvalho Malta 1
Sheila Rizzato Stopa 2
Cimar Azeredo Pereira 3
Célia Landmann Szwarcwald 4
Martha Oliveira 5
M
alta D
Introduction
Brazil’s Unified Health System (SUS) was brought into existence by the Federal
Constitu-tion of 19881, which is based on the principles
of: universality, full coverage, and equity. It was further established that the private sector would organize itself in a manner complementary to the
public sector2. Since then, rules and regulations
have been established for the functioning of the supplementary sector, among them Law 9656 of
19983 (‘Law 9656/98’), which sets rules for the
functioning of the sector, and Law 9961/20004,
which created the National Supplementary Health Agency (ANS), which was given the duty of preparing rules for the operators and inspect-ing them, includinspect-ing in relation to their content and their care models.
Health plan providers have been operating
in Brazil since the 1940s5,6; the Supplementary
Health subsector comprises the market for pri-vate healthcare plans. The commercial segment comprises cooperatives for medical work, dental care cooperatives, group medicine companies, self-management companies and the insurance
companies2,7. Another segment, the non-profits,
is not covered by the regulations of the sector and the ANS, and is part of the segment of Pub-lic Institutions, including institutions providing healthcare to government workers (municipal, state or military).
The sector has expanded and, at the end of the 1990s, the National Household Sampling Survey (Pesquisa Nacional por Amostra de Domicílios, or
PNAD, of 19888, estimated that approximately
38.7 million Brazilians were covered by at least one health plan – then corresponding to 24.5%
of the population. In the PNAD of 20039, it
was estimated that 24.6% of the Brazilian pop-ulation had at least one health plan, and in the
year 200810 this had increased to 25.9%, or 49.2
million people. In 2013, in continuation of the health survey of the PNAD of previous years,
the National Health Survey (Pesquisa Nacional
de Saúde – PNS) was held, which included in its scope information about the characteristics of the Supplementary Health Sector, especially on coverage by territory. The PNS further expand-ed the subjects – including items such as chronic
diseases, and lifestyle, among others11.
Information on coverage of health plans in Brazil is important for monitoring region-al trends, and sociregion-al-demographic distribution, providing the possibility of improvement of the
public regulation measures11,12.
The objective of this article is to show the extent of coverage of the population by private health plans in Brazil, separated according to so-cial-demographic characteristics, based on the data of the National Health Survey made in 2013, and to compare these data with administrative data from the National Supplementary Health Survey for the same year.
Methods
The data of the National Health Survey (PNS) were analyzed. This is a household-based survey carried out in Brazil in 2013 by the Brazilian
Ge-ography and Statistics Institute (Instituto
Brasile-iro de Geografia e Estatística – IBGE), in partner-ship with the Health Ministry. The PNS is part of the IBGE’s Integrated Home Survey System (SIPD), and uses the Master Sample of that Sys-tem, which has greater geographical spread and higher precision of estimates.
Cluster sampling was used, divided into three stages: The primary sampling unit was census sectors; the secondary unit, homes; and as the third unit, one adult member of the household (aged 18 or over). The homes and residents were selected by simple random sampling. The minimum size of the sample decided was 1,800 households per state of the Brazilian Federation; 81,767 households were initially selected, and the interviews obtained in 64,348 of them. Tak-ing closed households into account, the propor-tion of losses was 20.8%, and the proporpropor-tion of
non-replies, 8.1%13.
The estimates supplied by the PNS were weighted taking into account the weighting of the Primary Sampling Unit (UPA) in relation to the probability of being part of the survey, weighting of the household, with adjustments for correction for non-response and calibration of the population totals, and weighting of the residents selected, which further took into ac-count the probability of selection of the resident, non-response adjustments by gender, and cali-bration for the population totals by gender and age groups estimated with the weight of all the residents. Other details on the process of sam-pling and weighting are available in prior
pub-lications13,14.
aúd
e C
ole
tiv
a,
22(1):179-190,
2017
each home; 2) information on all the residents: one for each resident (the ‘proxy’ answered for the others living in the same household); and 3) resident selected: an adult resident (aged 18 or over) who was selected to answer the specific
blocks of the questionnaire14.
The information on possession of a health plan was obtained in the block for all the resi-dents in the home. By this means the PNS
col-lected valid information for 205,000 residents14.
Information on possession of health plans was processed to produce the indicator:
1) Percentage of people having some health plan (medical or dental), in which the numerator was: Number of people who have some health plan; and the denominator was the sum of the number of residents of all the households visit-ed. This indicator was analyzed according to so-cial-demographic characteristics: Gender (male, female), age group (0 to 17, 18 to 29, 30 to 39, 40 to 59, 60 and over), level of schooling (none, or primary incomplete; primary complete and secondary incomplete; secondary complete and higher incomplete; and higher complete); status in the workforce (working, unemployed, or out-side the workforce); state of health (very good and good, average, bad and very bad); location (urban, rural); Brazilian Region (North, North-east, SouthNorth-east, South and Center-West); and fi-nally for the whole of Brazil.
The figures for percentage of people having health plans, in the whole of Brazil and in the Brazilian States, were compared with administra-tive data of the Beneficiaries Information System of the National Supplementary Health Agency
(ANS)15 of December 2013, for comparison with
the data collected by the PNS in 2013.
Other indicators were also investigated, also itemizing by social-demographic characteristics:
2) Percentage of people who have some health plan (medical or dental) as primary hold-er. Numerator: Number of people who have some health plan and are the nominal owner of the plan. Denominator: Number of people who have some health plan.
3) Percentage of people who have more than one health plan (medical or dental). Numera-tor: Number of people who have more than one health plan. Denominator: Sum of the number of residents of all the households visited.
4) Percentage of people who have some health plan only for dental care. Numerator: Number of people who have some health plan only for den-tal care. Denominator: Sum of the number of residents of all the homes visited.
5) Percentage of people whose principal (or sole) health plan is from a government work-ers’ healthcare institution (municipal, state or military). Numerator: Number of people whose principal health plan is a government workers’ healthcare institution. Denominator: Sum of the number of residents of all the households visited. 6) Percentage of people who have had a health plan for more than one year without in-terruption. Numerator: Number of people who have held a health plan for more than one year without interruption. Denominator: Sum of the number of residents of all the households visited. 7) Percentage of people with a plan who eval-uate the principal health plan (medical or den-tal) as good or very good. Numerator: Number of people with a plan who assess the principal health plan (medical or dental) as good or very good. Denominator: People with a health plan.
Additionally, the formats for financing of the plan were described:
8) Percentage of people whose health plan is paid by the holder’s employer; (Numerator: Number of people whose plan is paid by the em-ployer. Denominator: People with a health plan). 9) Percentage of people whose health plan is paid by the holder through present or prior em-ployment. Numerator: Number of people whose plan is paid by the holder through present or pri-or employment situation. Denominatpri-or: People with a health plan).
10) Percentage of people whose health plan is paid directly by the holder or another resident in the same home. Numerator: Number of people whose plan is paid directly by the holder or by another resident of the household. Denomina-tor: People with health plans.
These indicators were analyzed by: Gen-der (male, female); age group (0-17, 18-29, 30-39, 40-59, 60 and over); and level of schooling (no schooling, or primary incomplete; primary complete and secondary incomplete; secondary complete and higher incomplete; and secondary complete).
The software Stata, version 11.0, was
em-ployed, using the Survey module, which takes into
account effects of the sampling plan, presenting prevalences and respective 95% confidence in-tervals (CI 95%). The differences between the categories were evaluated by superposition of the confidence intervals.
M
alta D
Results
Of the total of those interviewed by the PNS, the proportion who said they had some health plan (medical or dental) in Brazil was 27.9% (CI 95%: 27.1-28.8), there being no difference by gender. In age groups, the proportions were lower in the 0-17 and 18-29 age groups than in the older age groups (30-39, 40-59 and 60 and over). In level
of schooling, the proportions increased accord-ing to the years of study. Thus, the proportion of people who said they had completed higher ed-ucation and a health plan was 68.8% (CI 95%: 67.2-70.4), while for those without schooling or with incomplete primary education this propor-tion was 16.4% (CI 95%: 15.7-17.1) (Table 1).
For this same indicator, there were also signif-icant differences for status in the workforce: The
Table 1. Brazilian National Health Survey, 2013: Percentage having some health plan (medical or dental), in
each population category. Confidence interval: 95%. Categories: social-demographic, city/country, geographic (Brazilian official Regions).
Sub-category
% having some health
plan
CI lower limit
CI upper
limit
Estimated total number
(’000)
Gender
Male 27,0 26,1 27,9 26,045
Female 28.8 27.9 29.7 29,940
Age group (years)
0-17 23.1 22.1 24.0 12,516
18-29 26.0 25.0 27.1 10,114
30-39 31.3 30.1 32.6 9,703
40-59 31.0 29.8 32.1 15,514
Over 60 30.8 29.3 32.3 8,138
Level of schooling
No education, or primary incomplete 16.4 15.7 17.1 15,065
Primary complete, secondary incomplete 22.8 21.7 23.9 6,704
Secondary complete, higher incomplete 37.4 36.3 38.5 18,020
Higher education complete 68.8 67.2 70.4 12,733
Racial group
White 37.9 36.6 39.2 34,856
Black 21.6 19.9 23.3 3,743
Mixed race 18.7 18.0 19.4 16,592
Workforce status
In work 32.5 31.5 33.5 30,199
Out of work 16.3 14.4 18.1 926
Not in workforce 24.7 23.6 25.7 15,251
State of health
Very good, or good 31.3 30.3 32.3 46,536
Average 19.1 18.2 20.0 8,245
Bad, or very bad 13.8 12.4 15.2 1,204
Home location
Urban 31.7 30.7 32.7 54,136
Rural 6.2 5.2 7.2 1,849
Regions
North 13.3 12.2 14.4 2,225
Northeast 15.5 14.6 16.5 8,639
Southeast 36.9 35.2 38.6 31,163
South 32.8 30.4 35.2 9,437
Center-West 30.4 28.7 32.0 4,521
aúd e C ole tiv a, 22(1):179-190, 2017
proportion of people who said they had a health plan was greater for those in work (32.5% – CI 95%: 31.5-33.5) than those out of work (16.3% – CI 95%: 14.4-18.1), or outside the workforce (24.7% – CI 95%: 23.6-25.7). Differences were also found: between those reporting their state of health to be good and very good (31.3% – CI 95%: 30.3-32.3) in relation to the others; and be-tween those with urban and rural homes, the pro-portion being higher in those living in an urban area (31.7% – CI 95%: 30.7-32.7). By Brazilian Region, the largest proportion of people having a health plan was in the Southwest (36.9% – CI 95%: 35.2-38.6), and the lowest in the Northeast (13.3% CI 95%: 12.2-14.4) (Table 1).
The data obtained were also compared with administrative data of the ANS, relating to the same period investigated. Both the PNS and ANS showed the Region and State with highest per-centage of health plans to be, respectively, the Southeast and São Paulo State. Correspondence and/or proximity was also observed between the data of the PNS and ANS in other locations, such as in the Northern Region, and in the states of Maranhão, Rio Grande do Norte and Alagoas.
However, some states had quite different values: these included Paraná, Rio Grande do Sul, Mato Grosso do Sul, Mato Grosso, Goiás and the Fed-eral District. Figure 1 shows the proportions of possession of health plans for Brazil, by Brazilian Region and by State, based on the data from the PNS and from the Beneficiaries Information Sys-tem of the ANS.
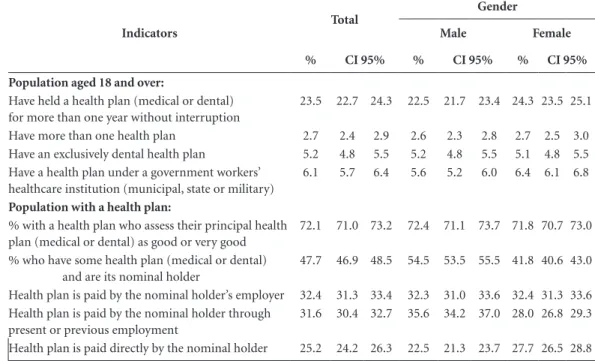
Table 2 shows the other indicators re-searched, by gender of interviewee. There was a significant difference in possession of a health as primary owner: the proportion was great-er for men (54.5% CI 95%: 53.5-55.5) than for women (41.8% CI 95%: 40.6-43.0). However, differences by gender were also found for: People whose health plan is paid by the nominal holder through work – greater in men (35.6% – CI 95%: 34.2-37.0); and People whose health plan is paid directly by the nominal holder, greater among women (27.7% – CI 95%: 26.5-28.8). The other indicators did not show significant differences.
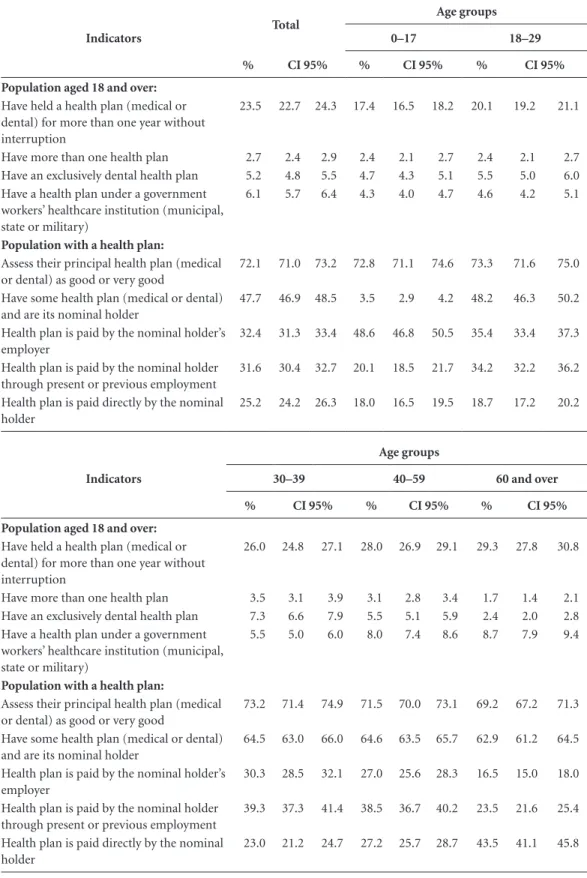
Table 3shows the indicators by interviewee
age group. The proportion of people having an exclusively dental health plan was greater in the age group 30-39 (7.3% – CI 95%: 6.6-7.9) than in
Brazil Nort
h Rondônia Acre Amaz onas Ror
aima Pará
Amapá Tocant ins Nor theast Mar
anhão Piauí Ceará
Rio G rand
e do N
orte Par aíba Pernamb uco Alag oas Serg ipe Bahia Sou theast Mat
o Grosso d
o Sul
Mat
o Grosso Go
iás
Fede
ral D
istric
t
Minas Ge
rais
Espír ito S
anto
Rio d
e Jane
iro
São P
auloSou Ptharaná
Santa C atar
ina
Rio G rand
e do S
ul
Cent
er-W
est
PNS ANS
Figure 1. % of the researched population holding health plans – according to: (a) Brazilian National Health
Survey (‘PNS’), 2013; and (b) Beneficiaries Information System of the Brazilian National Supplementary Health Agency (‘ANS’), 2013. For: whole of Brazil, Brazilian Regions, and by State.
Sources: (i) National Health Survey (PNS), 2013; (ii) Beneficiaries Information System of the National Supplementary Health Agency (ANS), December 2013.
0 5 10 15 20 25 30 35 40 45 50 27.9 25.5 13.5
11.5 13.0 11.3 7.3 5.9 15.3 17.2 8.9 7.3 13.7 10.7 12.5 9.7 11.2 7.1 15.5 12.3 6.9 7.1 11.8 8.1
15.6 13.9 15.7 16.6
M
alta D
the others. For people with a government work-ers’ institutional health plan, higher proportions were found in the 40-49 age group (8.0% – CI 95%: 7.4-8.6) and 60 or over (8.7% – CI 95%: 7.9-9.4). These age groups were also those with the highest proportions of holders of a health plan for more than one year without interrup-tion. The proportion of people whose health plan was paid directly by the owner was highest in people aged 60 or over (43.5% – CI 95%: 41.1-45.8).
Table 4 shows the indicators by interviewee’s level of schooling. In this comparison, several categories showed significant differences. The proportions were highest for those with com-plete higher education for the following catego-ries: People holding a health plan in the status of primary holder (67.4% – CI 95%: 66.0-68.8); people with more than one health plan (8.5% – CI 95%: 7.6-9.4); people who have an exclusively dental plan (12.6% – CI 95%: 11.6-13.6); people with a government workers’ institutional health plan (17.8% – CI 95%: 16.7-19.0); and people who have had a health plan for more than one year without interruption (63.4% – CI 95%: 61.7-65.1). There was a gradual increase in the proportions with the increase in level of
school-ing. Thus, the lowest proportions of holding of plans, mostly, were found in the category of people without schooling and/or without having completed primary education (Table 4).
Discussion
The proportion of people with health plans in Brazil has increased in the last five years, to 27.9%, or approximately 56 million Brazilians, in 2013. The proportion of plans is higher after the age of 30, and for those who are in the labor mar-ket, followed by retirees and the elderly. Further, it is higher among people with higher levels of schooling, and indeed is as much as four times higher among those with completed higher edu-cation; and slightly more frequent among wom-en. The populations of the Southeastern and Northern regions have, respectively, the highest and the lowest proportions of health plan cover-age. In urban regions health plans are four times more frequent than in rural areas.
The PNS showed an increase in the number of beneficiaries of health plans in Brazil, which may be explained by various components of the population, especially people with formal
em-Table 2. Holders of health plans in Brazil, by gender: (a) categories in population age over 18; (b) Categories in
whole population researched. Confidence interval 95%. Brazilian National Health Survey, 2013.
Indicators
Total
Gender
Male Female
% CI 95% % CI 95% % CI 95%
Population aged 18 and over:
Have held a health plan (medical or dental) for more than one year without interruption
23.5 22.7 24.3 22.5 21.7 23.4 24.3 23.5 25.1
Have more than one health plan 2.7 2.4 2.9 2.6 2.3 2.8 2.7 2.5 3.0
Have an exclusively dental health plan 5.2 4.8 5.5 5.2 4.8 5.5 5.1 4.8 5.5
Have a health plan under a government workers’ healthcare institution (municipal, state or military)
6.1 5.7 6.4 5.6 5.2 6.0 6.4 6.1 6.8
Population with a health plan:
% with a health plan who assess their principal health plan (medical or dental) as good or very good
72.1 71.0 73.2 72.4 71.1 73.7 71.8 70.7 73.0
% who have some health plan (medical or dental) and are its nominal holder
47.7 46.9 48.5 54.5 53.5 55.5 41.8 40.6 43.0
Health plan is paid by the nominal holder’s employer 32.4 31.3 33.4 32.3 31.0 33.6 32.4 31.3 33.6
Health plan is paid by the nominal holder through present or previous employment
31.6 30.4 32.7 35.6 34.2 37.0 28.0 26.8 29.3
aúd
e C
ole
tiv
a,
22(1):179-190,
2017
Table 3. Holders of health plans in Brazil, by age group: (a) categories in population age over 18; (b) Categories
in whole population researched. Confidence interval 95%. Brazilian National Health Survey, 2013.
Indicators
Total
Age groups
0–17 18–29
% CI 95% % CI 95% % CI 95%
Population aged 18 and over:
Have held a health plan (medical or dental) for more than one year without interruption
23.5 22.7 24.3 17.4 16.5 18.2 20.1 19.2 21.1
Have more than one health plan 2.7 2.4 2.9 2.4 2.1 2.7 2.4 2.1 2.7
Have an exclusively dental health plan 5.2 4.8 5.5 4.7 4.3 5.1 5.5 5.0 6.0
Have a health plan under a government workers’ healthcare institution (municipal, state or military)
6.1 5.7 6.4 4.3 4.0 4.7 4.6 4.2 5.1
Population with a health plan:
Assess their principal health plan (medical or dental) as good or very good
72.1 71.0 73.2 72.8 71.1 74.6 73.3 71.6 75.0
Have some health plan (medical or dental) and are its nominal holder
47.7 46.9 48.5 3.5 2.9 4.2 48.2 46.3 50.2
Health plan is paid by the nominal holder’s employer
32.4 31.3 33.4 48.6 46.8 50.5 35.4 33.4 37.3
Health plan is paid by the nominal holder through present or previous employment
31.6 30.4 32.7 20.1 18.5 21.7 34.2 32.2 36.2
Health plan is paid directly by the nominal holder
25.2 24.2 26.3 18.0 16.5 19.5 18.7 17.2 20.2
Indicators
Age groups
30–39 40–59 60 and over
% CI 95% % CI 95% % CI 95%
Population aged 18 and over:
Have held a health plan (medical or dental) for more than one year without interruption
26.0 24.8 27.1 28.0 26.9 29.1 29.3 27.8 30.8
Have more than one health plan 3.5 3.1 3.9 3.1 2.8 3.4 1.7 1.4 2.1
Have an exclusively dental health plan 7.3 6.6 7.9 5.5 5.1 5.9 2.4 2.0 2.8
Have a health plan under a government workers’ healthcare institution (municipal, state or military)
5.5 5.0 6.0 8.0 7.4 8.6 8.7 7.9 9.4
Population with a health plan:
Assess their principal health plan (medical or dental) as good or very good
73.2 71.4 74.9 71.5 70.0 73.1 69.2 67.2 71.3
Have some health plan (medical or dental) and are its nominal holder
64.5 63.0 66.0 64.6 63.5 65.7 62.9 61.2 64.5
Health plan is paid by the nominal holder’s employer
30.3 28.5 32.1 27.0 25.6 28.3 16.5 15.0 18.0
Health plan is paid by the nominal holder through present or previous employment
39.3 37.3 41.4 38.5 36.7 40.2 23.5 21.6 25.4
Health plan is paid directly by the nominal holder
M
alta D
ployment and companies, being led to acquire health plans as a result of the increase in the number of people employed, economic growth,
and/or greater availability of money10-12.
This increase coincides with the registration data of the ANS, identified by the Beneficiaries Information System. These data indicate that the number of beneficiaries in the year 2008 was ap-proximately 40 million, increasing to 50 million in 2013, that is to say an increase of 25% in five years. However, it is emphasized that the data of the ANS refer to the number of health plans, and
that one individual may have more than one. Also, the number of plans does not include plans for government workers, which are not under the
regulation of the ANS15.
Another item of data that is worth highlight-ing is that the majority of beneficiaries of health
plans are affiliated to the collective plans15. This
was already indicated by the 2008 PNAD10, and
also by the administrative information of the ANS, which indicates growth in corporate collec-tive plans from 23.4 million in 2008 to 33.7 mil-lion in 2014, and collective plans by subscription
Table 4. Selected indicators according to possession of health plans, by level of schooling. Confidence interval 95%.
Brazilian National Health Survey, 2013.
Indicators
Total
Level of schooling
No education, or primary incomplete
Primary complete and
secondary incomplete
Secondary complete
and higher education
incomplete
Higher education
complete
% CI 95% % CI 95% % CI 95% % CI 95% % CI 95%
Population aged 18 and over:
Have held a health plan (medical or dental) for more than one year without interruption
23.5 22.7 24.3 14.1 13.5 14.8 18.8 17.8 19.8 31.5 30.4 32.5 63.4 61.7 65.1
Have more than one health plan
2.7 2.4 2.9 1.2 1.1 1.4 1.9 1.6 2.3 3.6 3.2 4.0 8.5 7.6 9.4
Have an exclusively dental health plan
5.2 4.8 5.5 2.6 2.4 2.9 4.6 4.1 5.1 7.6 7.0 8.1 12.6 11.6 13.6
Have a health plan under a government workers’ healthcare institution (municipal, state or military)
6.1 5.7 6.4 3.3 3.0 3.6 4.4 3.9 4.9 8.3 7.8 8.9 17.8 16.7 19.0
Population with a health plan:
People who assess their principal health plan (medical or dental) as good or very good
72.1 71.0 73.2 68.2 66.4 70.0 71.1 69.0 73.3 73.1 71.7 74.5 74.8 73.2 76.4
% who have some health plan (medical or dental) and are its nominal holder
47.7 46.9 48.5 31.4 30.1 32.8 42.3 40.3 44.3 58.6 57.4 59.9 67.4 66.0 68.8
Health plan is paid by the nominal holder’s employer
32.4 31.3 33.4 34.4 32.8 36.0 35.8 33.6 38.1 30.7 29.3 32.0 25.1 23.6 26.7
Health plan is paid by the nominal holder through present or previous employment
31.6 30.4 32.7 22.9 21.3 24.4 28.8 26.7 31.0 37.7 36.1 39.3 38.0 36.2 39.8
Health plan is paid directly by the nominal holder
aúd
e C
ole
tiv
a,
22(1):179-190,
2017
totaling 6.7 million, resulting in a total for 2013 of approximately 40 million collective plans, or
approximately 75% of the market16. Some plans
that are contracted collectively are sponsored by companies, and thus relate to the population in-volved in the labor market, that is to say, the
pop-ulation of working age14,16.
Also, the increase in the supply of collective plans can be attributed to the legislation gov-erning the sector, which sets measures such as maximum increases in rates for individual plans – while this is not the case for collective plans, for which it was supposed that the market would be able to regulate increases of prices. Thus, the collective plans became more competitive and attractive, as well as offering a large number of benefits, for the great majority of the popula-tion involved in the market – of productive age, younger and with a lower risk of becoming ill. These movements have the effect of increasing the cost of individual plans, leading to reduction
of demand and supply12.
Although the proportion of plans has in-creased, the regional variations have persisted. The differences between urban and rural popu-lations were significant, as were also the differ-ences between the Brazilian Regions and States. Data from previous PNADs showed a difference between figures in Brazil’s Southern and South-eastern Regions and in its other regions. That difference persisted in this survey, which could be due to the higher concentration of wealth, jobs, and also the greater proportion of the
to-tal population in these regions10,17. The greatest
growth in percentages of coverage, however, was in the Center-West Region: from 24.5% in 2008
to 30.4% in 2013 – an increase of 24%14.
Another differential was the larger propor-tion of plans among people with higher levels of schooling. Schooling is regarded as a proxy for income, and has been indicated as a
determin-ing factor in access to health services2,18,19. Other
studies also indicate that schooling is strongly
associated with possession of a health plan7,20,21.
The PNS shows a segment that is not cov-ered by the administrative data of the ANS – the healthcare plans for state, municipal or military government workers. These are approximate-ly 6.1% of the population, or approximateapproximate-ly 12 million people, with the highest proportions in the Federal District, Goiás, Mato Grosso do Sul and Rio Grande do Sul, and also among peo-ple over the age of 40 and with higher levels of schooling. Thus, only data of the population base can be used to monitor the distribution of these
plans14. This difference in the registration base of
the ANS also explains the difference found in the related data of the PNS.
The PNS indicated that children and young people have lower percentages of coverage by health plans, which could be explained on the basis that they are healthier populations – so that families delay inclusion of their youngest in health plans. Also, the current legislation has cre-ated ten age groups and six bands for increases of health plan charges, requiring the costs of plans to be distributed between all groups and not con-centrated among the oldest – this is referred to as the principle of inter-generation solidarity. Un-der this arrangement, charges are increased for the earlier age groups: populations up to the age of 59 pay higher monthly charges than the risk for their age, while the elderly pay lower month-ly charges than the risk associated with their age
range22,23. This mechanism also stimulated entry
into health plans of people already in the labor market, in productive age groups – more usually enrolling in collective plans.
The PNS indicated a high participation of the elderly in health plans, which can be understood in terms of this age group’s greater health needs, due to their higher probability of becoming ill. As age increases the demand for plans tends to
increase, as people seek greater access to care15,19.
Studies in Japan show that per capita expendi-ture on health for people over the age of 75 is 7.5 times the level for young people between age
15 and 1924.European studies also indicate that
spending increases with age, to as much as a fac-tor of 10 for people older than 70 compared to the expenditure for the age groups between 5 and
1925. This shows the importance of establishing
inter-generation solidarity for coverage of
com-mon costs for the elderly23.
In other countries, factors such as white skin, schooling level, income, older age groups and people being in the labor market are also asso-ciated with possession of a plan, and also lower
levels of coverage among young people26-28. This
pattern is repeated in Brazilian studies11,29,30.
Self-evaluation of state of health is an indica-tor used internationally as an objective measure of potential for illness and use of services, and a powerful predictor of mortality. Thus it would seem to be an indication of greater use of services,
and higher spending31. There was a greater
la-M
alta D
bor market and having access to collective plans. These populations are healthier and have lower risk of becoming ill. Further, populations with plans have higher levels of schooling and income and, in general, have better access to health ser-vices, healthcare and health-promoting practices, and thus make a better self-assessment of their
own health12,29,30. The concentration among those
that have a better state of health also reflects the growth of collective plans, with people who are younger and have lower risk of becoming ill. The high cost of individual plans, and the rule
relat-ing to pre-existrelat-ing illness13, both constitute
dif-ficulties for entry of people who are already ill.
Conclusion
The increase of the percentage of the Brazilian population who have health plans reflects the im-provement in the supply of jobs and the growth of Brazil’s economy.
Population-based data information presents a great challenge in showing the characteristics of the sector, such as the regional and social-demo-graphic distribution of possession of health plans, and distribution by factors including age group, level of schooling, and income – and supports the public policies for regulation of the sector.
aúd
e C
ole
tiv
a,
22(1):179-190,
2017
Collaborations
DC Malta, SR Stopa, CA Pereira, CL Szwarcwald, M Oliveira and AC Reis participated in the study design, data analysis and interpretation, writing, review and final approval of the article, and are responsible for all aspects including warranty ac-curacy and integrity.
References
1. Brasil. Constituição da República Federativa do Brasil de 1988. Diário Oficial da União 1988; 5 out.
2. Malta DC, Cecílio LCO, Merhy EE, Jorge AO, Franco T, Costa MA. Perspectivas da regulação na saúde su-plementar diante dos modelos assistenciais. Cien Saude Colet 2004; 9(2):433-444.
3. Brasil. Lei nº 9.656, de 3 de junho de 1998. Regulamen-ta a Saúde SuplemenRegulamen-tar no Brasil e dá outras providên-cias. Diário Oficial da União 1998; 2 jun.
4. Brasil. Lei nº 9.961, de 28 de janeiro de 2000. Cria a Agência Nacional de Saúde Suplementar - ANS e dá outras providências. Diário Oficial da União 2000; 28 jan.
5. Santos FP, Merhy EE. A regulação pública da saúde no Estado brasileiro: uma revisão. Interface (Botucatu)
2006; 10(19):25-41.
6. Bahia L. As contradições entre o SUS universal e as transferências de recursos públicos para os planos e seguros privados de saúde. Cien Saude Colet 2008; 13(5):1385-1397.
7. Malta DC, Jorge AO. Modelos assistenciais na saúde suplementar: o caso de uma operadora de autogestão.
Cien Saude Colet 2008; 13(5):1535-1542.
8. Instituto Brasileiro de Geografia e Estatística (IBGE). Pesquisa Nacional por Amostra de Domicílios. Acesso e utilização de serviços de saúde 1998. Rio de Janeiro: IBGE; 2000.
9. Instituto Brasileiro de Geografia e Estatística (IBGE). Pesquisa Nacional por Amostra de Domicílios. Acesso e utilização de serviços de saúde 2003. Rio de Janeiro: IBGE; 2005.
10. Instituto Brasileiro de Geografia e Estatística (IBGE).
Pesquisa Nacional por Amostra de Domicílios. Um pano-rama da saúde no Brasil. Acesso e utilização de serviços, condições de saúde e fatores de risco e proteção à saúde 2008. Rio de Janeiro: IBGE; 2010.
11. Santos IS, Ugá MAD, Porto SM. O mix público-privado no Sistema de Saúde Brasileiro: financiamento, oferta e utilização de serviços de saúde. Cien Saude Colet 2008; 13(5):1431-1440
12. Santos FP, Malta DC, Merhy EE. A regulação na saúde suplementar: uma análise dos principais resultados al-cançados. Cien Saude Colet 2008; 13(5):1463-1475. 13. Szwarcwald CL, Malta DC, Pereira CA, Vieira MLFP,
Conde WL, Souza Júnior PRB, Damacena GN, Azeve-do LO, AzeveAzeve-do e Silva G, Theme Filha MM, Lopes CS, Romero DE, Almeida WS, Monteiro CA. Pesquisa Na-cional de Saúde no Brasil: concepção e metodologia de aplicação. Cien Saude Colet 2014; 19(2):333-342. 14. Instituto Brasileira de Geografia e Estatística (IBGE).
Acesso e Utilização dos Serviços de Saúde, Acidentes e Violências. Rio de Janeiro: IBGE; 2015.
15. Agência Nacional de Saúde Suplementar (ANS). Ca-derno de Informações. [acessado 2015 mar 13]. Dispo-nível em: http://www.ans.gov.br/portal/site/
16. Malta DC, Moura EC, Oliveira M, Santos FP. Usuários de planos de saúde: morbidade referida e uso de exa-mes preventivos, por inquérito telefônico, Brasil, 2008.
Cad Saude Publica 2011; 27(1):57-66.
17. Instituto Brasileiro de Geografia e Estatística (IBGE).
M
alta D
18. Brasil. Rede Interagencial de Informação em Saúde.
Indicadores Básicos para a Saúde no Brasil: conceitos e aplicações. Brasília: Organização Pan Americana de Saúde; 2008.
19. Malta DC, Jorge AO. O mercado de saúde suplemen-tar e análise dos dados das operadoras selecionadas. In: Agência Nacional de Saúde Suplementar, organizador.
Duas faces da mesma moeda: microrregulação e mode-los assistenciais na saúde suplementar. Rio de Janeiro: Agência Nacional de Saúde Suplementar; 2005. p. 37-60.
20. Lima-Costa MF. Estilos de vida e uso de serviços pre-ventivos de saúde entre adultos filiados ou não a plano privado de saúde (inquérito de saúde de Belo Horizon-te). Cien Saude Colet 2004; 9(4):857-864.
21. Bahia L, Costa AJ, Fernandes C, Luiz RR, Cavalcanti ML. Segmentação da demanda dos planos e seguros privados de saúde: uma análise das informações da PNAD/98. Cien Saude Colet 2002; 7(4):671-686. 22. Cechin J, Badia BD, Martins CB. Pacto
intergeracio-nal, seleção adversa e Financiamento dos planos de saúde. Saude em Debate 2009; 33(82):214-221. 23. Agência Nacional de Saúde (ANS). Resolução
Norma-tiva nº 63, de 22 de dezembro de 2003. Define os limites a serem observados para adoção de variação de preço por faixa etária nos planos privados de assistência à saúde contratados a partir de 1º de janeiro de 2004.
Diário Oficial da União 2003; 23 dez.
24. Fukui T, Wamoto Y. Policy options for financing the future health and long-term care costs in Japan. In: Ito T, Rose A, editors. Fiscal Policy and Management in East Asia. Chicago: University of Chicago Press; 2007. p. 415-442.
25. Westerhout E, Pelikaan F. Alternative scenarios for health, life expectancy and social expenditure: the in-fluence of living longer in better health on health care and pension expenditures and government finances in the EU. ENEPRI Research Report 2005; 8.
26. Ahluwalia JB, Bolen J, Garvin B. Health insurance cov-erage and use of selected preventive services by work-ing age women, BRFSS 2006. J Women’s Health 2007; 16(7):935-940.
27. Nelson KM, Chapko MK, Reiber G, Boylo EJ. The asso-ciation between health insurance coverage and diabetes care: data from the 2000 behavior risk factor surveil-lance system. Health Serv Res 2005; 40(2):361-372. 28. Hagdrup NA, Simoes EJ, Browson RC. Health care
cov-erage: traditional and preventive measures and asso-ciations with chronic disease risk factor. J Community Health 1997; 22:387-399.
29. Malta DC, Bernal RTI. Comparação dos fatores de ris-co e proteção de doenças crônicas na população ris-com e sem planos de saúde nas capitais brasileiras, 2011. Rev Bras Epidemiol 2014; 17(Supl. 1):241-255.
30. Lima-Costa MF, Guerra HL, Firmo JO, Vidigal PG, Uchoa E, Barreto SM. The Bambuí Health and Aging Study (BHAS):private health plan and medical care utilization by older adults. Cad Saude Publica 2002; 18(1):177-186.
31. Barros MBA, Zanchetta LM, Moura EC, Malta DC. Au-to-avaliação da saúde e fatores associados, Brasil, 2006.
Rev Saude Publica 2009; 43(Supl. 2):27-37.
Article submitted 24/09/2015 Approved 06/11/2015