Environmental
Health Indicators
For the
U.S. - Mexico
Border
Concept Document
U.S-Mexico Border
Field Office of the
ENVIRONMENTAL PUBLIC HEALTH
INDICATORS FOR THE U.S. – MEXICO
BORDER REGION
- CONCEPT DOCUMENT -
Prepared by:
Pierre Gosselin MD MPH, WHO/PAHO Collaborating Center on environmental and occupational health impact assessment and surveillance at CHUQ
Chris Furgal PhD, CHUQ Research Center
Alfonso Ruiz, DVM, MS, PhD, Chief, El Paso Field Office, PAHO
Adapted following presentation to members of the Environmental Health Working Group, El Paso, Texas
Acknowledgements
- Collaborators -
Dr. Augusto galvao MD, MSc, Program Coordinator HEP/HEK, PAHO/WHO
Dr. Carlos Castillo – Salgado, MD; MPH; Dr. PH; Director SHA, PAHO/WHO
Dr. Rosalba Ruiz MD, MPH - U.S. Coordinator of the U.S.- Mexico Border Prevention and Control Diabetes Project, PAHO/WHO
Dr. Antonio Barraza – Dirección General de Salud Ambiental Secretaría de Salud, México
Dr. Alfonso García Gutierrez – Director de Calidad de Aire, SEMARNAT – INE México
M.C. Magdalena Rojas – Dirección Monitoreo e Impacto, Secretaría de Salud, México
Dr. Arturo Sil Plata – Subdirector Red Hospitalaria, Dirección General de Epidemiología, Secretaría de Salud, México
Mandate received from PAHO, El Paso field office
(Summary from original in Spanish):
? Review pertinent documents as provided and prepare a draft version of a paper on
environmental health indicators in coordination with the Washington and El Paso officers for use in a work session.
? The paper should include three parts: first, the general definitions; second, the
identification of core indicators for environmental health applicable to the
USA/Mexico Border region; and third, a description of the specific measurement criteria.
? The draft paper is to be utilized for developing an agreement between the
Environmental Health Group members on conceptual definitions and indicators, means for data collection and recommendations for the implementation of binational pilot projects at the local level.
PREFACE
In the last twenty years, a particular socio-economic dynamic on the United States- Mexico border has been observed, characterized by an accelerated population growth in urban areas, an extensive industrial and agricultural development, an increase of ground transportation, migrations, poverty and growth of informal human settlements. All these factors have contributed to air, soil, and water pollution, without ignoring the influence of the various cultures that are conjugated in the border areas. The result of this complexity has been a modification of the pathologies that are observed in the border and of their own clinical manifestations.
Several efforts have been made in order to learn the effects of the environmental alterations on human health and to understand the associated morbid processes. Among them, the binational initiative of Border XXI Program joined the different sectors and institutions to exchange information that could be of interest in order to generate policies and define actions that lead to a healthy and productive environment. These concerns place the exchange of information as an important element for the definition of activities and binational programs.
The distribution of epidemiological and public health information is one of the technical cooperation priorities that has been assigned by the federal governments to the United States – Mexico Border Field Office of the Pan American Health Organization (PAHO). Within this priority, important initiatives have been developed that are focused on the collection of information for the analysis and orientation of the social and sanitary policies, as well as for the use of decision makers that determine the future of the population health along the border. Among them, it is worth to mention the Mortality Profiles, the Health Core Data of the Sister Cities, and the Survey of Environmental Health Resources. These initiatives of information are complementary to each other. In addition, the Border XXI Program, established a framework of sustainable collaborative work for health and environment protection as well as the proper management of natural resources of the two countries, seeking a balance among the social and economic factors and the protection of the environment in border communities. This challenge involves the exchange of epidemiological and environmental information for a better interpretation of the effects the environment has on the health of the individual and of the population. This data is obtained and driven by different institutions and sectors.
indicators that the document contains from the beginning, but that they may adopt the ones in which they are interested or they appertain to and have the capacity and the resources to approach.
The foregoing implies the development of a local participatory binational process, which is fundamental to involve the greatest possible number of institutions of the various sectors that obtain and maintain information on health and the environment. The Pan American Health Organization jointly with the Center of Disease Control and Prevention (CDC) and the Environmental Protection Agency (EPA) of the United States, SEMARNAT, of the Secretary of Environment and Natural Resources and the General Environmental Health Directorate (DGSA), the General Bureau of Epidemiology (DGE) of the Secretary Health of Mexico, are jointly committed to put in action this process and the necessary monitoring systems for a healthy and productive border.
ALFONSO RUIZ DVM, MS, Ph. D Chief of the Field Office
U.S.-Mexico border
Table of Contents
Page
1.0 Introduction: Environmental Public Health Indicators for the
U.S.-Mexico Border Region 1
2.0 Defining Environmental Health and Environmental Health Indicators 2
3.0 Frameworks for Indicator Identification and Selection 4
4.0 Indicators and Program Objectives 7
5.0 Defining the Audience(s) 12
6.0 Considering Scales 14
7.0 Criteria for Indicators: Selecting the right ones 14
8.0 Choosing a Set of Core Indicators 17
9.0 Core Environmental Public Health Indicators for the U.S-Mexico
Border Region 19
10.0 Results of the El Paso Workshop: A Draft List of Core Indicators 20
11.0 References 27
List of Tables
Table 1. Retained indicators following initial review and scoring
by participants at the El Paso Workshop, July 26- 27, 2001. 21
Table 2. Draft list of core environmental public health indicators
for the U.S. – Mexico Border region as developed at the El Paso
Workshop, July 26-27, 2001. 24
List of Figures
Figure 1. Examples of Commonly Used Frameworks for Indicator
Organization (adapted from Eyles and Furgal, 2000) 5
List of Appendices
Appendix A: Matrix of Environmental Public Health Indicators for first
round of scoring and review 30
Appendix B: Matrix of Environmental Public Health Indicators for second
round of scoring and review 33
Appendix C: List of participants at the El Paso Workshop,
1.0 Introduction: Environmental Public Health Indicators for the U.S.-Mexico Border Region
Following the La Paz Agreement in 1983, the U.S. – Mexico Border XXI Program was established to bring together various American and Mexican agencies and departments responsible for the region bordering these two countries. The Program was established to help guide activities in the region towards a goal of sustainable development through the protection of human health and the environment, and the appropriate management of natural resources in both countries. The mission of the Border XXI program is to
“achieve a clean environment, protect public health and natural resources, and encourage sustainable development along the U.S. – Mexico border”
(www.epa.gov/usmexicoborder / ef-about.htm).
This U.S. – Mexico border region is characterized by conditions impacting the health of border communities such as: rapid urbanization; increased industrial/manufacturing development and associated occupational risks; an increasing number of youth, working adults and children resulting from migration; a high rate of poverty; lack of sufficient drinking water supplies and inadequate drinking water quality; inadequate treatment and disposal of domestic and industrial wastewater, solid and hazardous industrial wastes; and improper handling and storage of pesticides. All of these situations are occurring in a region without the accompanying development of health and environmental infrastructure and capacities to effectively deal with these issues at the local and region levels
(www.yosemite1.epa.gov/oia/MexUSA.nsf/).
The Environmental Health Working Group of the Border XXI Program is charged with addressing those health issues linked to environmental factors in the region. The ultimate goal of this group is to address environmental health concerns in the region through: (1) improving the capacity of state, tribal, and local health and environmental agencies to assess the relationship between human health and the environment by conducting
surveillance, monitoring, and research; (2) supporting projects to improve the capacity of state, tribal and local health and environmental agencies to deliver environmental health intervention, prevention and education services; (3) increase the opportunity for all border stakeholders to participate in environmental health initiatives; (4) improve training opportunities for environmental health personnel, and (5) improve public awareness and understanding of environmental health problems by providing information and
educational opportunities (www.yosemite1.epa.gov/oia/MexUSA.nsf).
2.0 Defining Environmental Health and Environmental Health Indicators
As a result of the increasing knowledge of the links between environmental influences on human health, and the impacts of human activities on the environment, increasing
attention has been dedicated to tracking processes such as benchmarking and status reporting (i.e. State of the Environment, Health Status Report) by government agencies and others to provide information for evidence-based decision making. Many of these efforts have relied upon various indicators of the status of various components of the environment and measures of their effects on human health. Those relationships between human health and environmental influences, are central to the definition of environmental health.
The U.S. Department of Health and Human Services (2000) defines environmental health as:
“…those aspects of human disease, and injury that are determined or influenced by factors in the environment. This includes the study of both direct pathological effects of various chemical, physical, and biological agents, as well as the effects on health of the broad physical and social environment, which includes housing, urban development, land-use and transportation, industry and agriculture.”
This definition is very similar to that of the WHO Charter, which was adapted by the European Charter on Environment and Health, which defines environmental health as:
“…(environmental health) includes both direct pathological effects of chemicals, radiation and some biological agents, and the effects (often indirect) on health and well-being of the broad physical, psychological, social, and aesthetic environment, which includes housing, urban development, land use and transport.” (Johnson, 1997)
Some definitions have also included the processes or actions related to dealing with environmental health issues. These definitions go beyond simply defining the relationships and potential health effects of environmental determinants, to stress the implicit actions, and in some cases proactive measures, to protect public health from environmental stresses. The World Health Organization definition of Environmental Health Services (1989) states:
“Environmental health is comprised of those aspects of human health and disease that are determined by factors in the environment. It also refers to the theory and practice of assessing and controlling factors in the environmental that can
potentially affect health.”
In greater detail, the World Health Organization draft definition developed at WHO consultation in Sofia, Bulgaria (1993) states:
psychological factors in the environment. It also refers to the theory and practice of assessing, correcting, controlling, and preventing those factors in the
environment that can potentially affect adversely the health of present and future generations.”
This definition adds a proactive element to the definitions of environmental health in that it explicitly states the activities of “correction, control and prevention” in relation to human impacts of environmental determinants. As most of the means for such activities are usually out of the control of public health agencies, this also serves to highlight the essential role of close cooperation with environment, transport, natural resources and other agencies at the local, state or federal levels.
The Canadian Federal, Provincial and Territorial Advisory Committee (1996) identifies at least five key determinants of health:
? Living and working conditions ? Physical environment
? Personal health practices and coping skills ? Health services
? Biology and genetic endowment.
In our consideration of environmental health those determinants most relevant to links between public health and the surrounding environment should be considered. Within these relationships the potential measurements taken to track changes, assess status or set goals are endless. The nature of many relationships is complex, dynamic, and often not easily detected by simple means (e.g. many are significant, but not cause-effect direct relationships between environment and human health). To attempt to measure all factors in these relational chains would be too consuming with regards to time and funds. Therefore, measurements that are indicative of the relationships and impacts we are concerned about , or interested in, are chosen as “indicators” of the status of these
relationships and their impacts. Indicators provide clues to matters of larger significance or make perceptible a trend of phenomenon not immediately detectable and thus their significance extends beyond what is actually measured.
Briggs et al. (1996) defines environmental health indicators as:
“an expression of the link between environment and health, targeted at an issue of specific policy or management concerns and presented in a form which facilitates interpretation for effective decision making”.
Summary:
As it is more comprehensive in including industry and agriculture, and more specific through inclusion of disease and injury, we propose to use the definition of environmental health adopted by the U.S. Department of Health and Social Services (2000) with an addition for the notion of health and well-being, and the extension of the discipline aspects of the definition to include the prevention, correction and control of
environmental public health risks. The proposed adapted definition would read as follows:
“…those aspects of human health, disease, injury and well-being that are
determined or influenced by factors in the environment. This includes the study of both direct deleterious effects of various chemical, physical, and biological agents, as well as the effects on health of the broad physical and social environment, which includes housing, urban development, land-use and transportation, industry and agriculture.
Environmental health also refers to the professional practice of evaluating,
preventing, correcting or controlling environmental risks and promoting the benefits for communities and individuals.”
The definition for environmental health indicators proposed by Briggs et al. (1996) is more action oriented and appears to fit better the notion of health surveillance and is therefore adapted and recommended for use here. An environmental health indicator is:
“an expression of the probable link between environment and health, based on prior scientific knowledge, targeted at an issue of specific public policy or management concerns and presented in a form which facilitates interpretation for effective decision making”.
3.0 Frameworks for Indicator Identification and Selection
Implicit in the understanding that an indicator represents a link within a phenomenon of interest (e.g. the relationship between human health and the environment) is some conceptual interpretation of this phenomenon based on previous knowledge,
experimentation, or understanding. These models or frameworks of our comprehension of, for example, the link between water quality and human health, often represent the components in a linear fashion to more clearly articulate causal connections. With the understanding that the situation is often more complex in reality, the model provides a framework for the organization and development of indicators at various points along the chain (Kjellstrom and Corvalan, 1996).
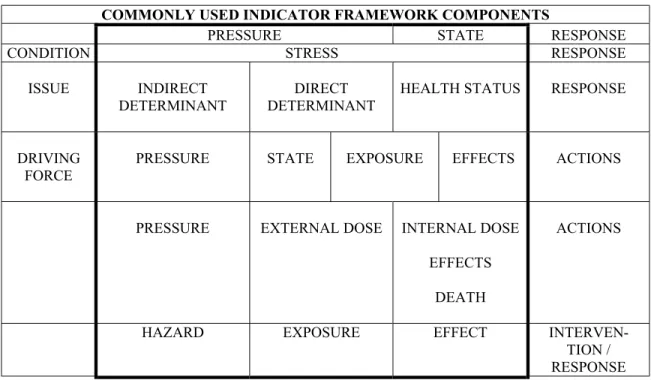
cause certain forms of stress on components within the system (e.g. pollution of organism tissues or compartments of air, soil or water), influencing their status (e.g. levels of substances in organisms, or environmental compartments) which then elicit various forms of response (e.g. organism mortality). From this basic model a number of others with varying levels of specificity in the chain describing links within the phenomenon have been derived and used for a variety of purposes (Figure 1).
COMMONLY USED INDICATOR FRAMEWORK COMPONENTS
PRESSURE STATE RESPONSE
CONDITION STRESS RESPONSE
ISSUE INDIRECT DETERMINANT
DIRECT DETERMINANT
HEALTH STATUS RESPONSE
DRIVING FORCE
PRESSURE STATE EXPOSURE EFFECTS ACTIONS
PRESSURE EXTERNAL DOSE INTERNAL DOSE
EFFECTS
DEATH
ACTIONS
HAZARD EXPOSURE EFFECT
INTERVEN-TION / RESPONSE
Figure 1. Examples of Commonly Used Frameworks for Indicator Organization (adapted from Eyles and Furgal, 2000)
* Bold outline indicates where most effort has been focused in indicator development and use in the past Sources: OECD (1976); Corvalan et al. (1996); Von Schrinding (1997); Friend and Rapport (1979); Environment Canada, WHO (1996), NRC (1999)
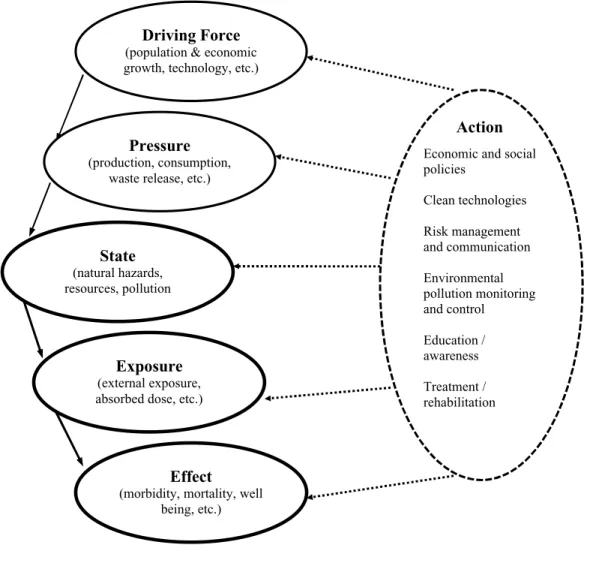
Figure 2. The Driving Forces, Pressure, State, Exposure, Effect, Action (DPSEEA) model of WHO (WHO, 1999:5)
These frameworks have been developed to serve the purpose of emphasizing the level of specificity or desired focus of a specific monitoring program, and thus the adaptation of the framework is dictated by the goals and objectives of the monitoring exercise. Whether the interest of the monitoring program is to look at the factors involved in greater detail leading to the pressures on a system (what Corvalan et al. (1996) and von Schrinding (2000) call “driving forces”), at the states or responses within the system (e.g. external dose, internal dose and effect at the organism, cellular or molecular level), or at actions taken to combat negative impacts (e.g. government emission control legislation) is determined by the program goals and its ultimate purpose. Therefore, depending upon the differences in the focus of two hypothetical programs, what one program defines as a “hazard”, may refer to another program’s “external dose”, or what one program terms a “pressure”, another may define as a “state”.
Driving Force
(population & economic growth, technology, etc.)
State
(natural hazards, resources, pollution
Pressure
(production, consumption, waste release, etc.)
Exposure
(external exposure, absorbed dose, etc.)
Effect
(morbidity, mortality, well being, etc.)
Economic and social policies
Clean technologies Risk management and communication Environmental pollution monitoring and control
Education / awareness Treatment / rehabilitation
The terminology and degree of detail (number of compartments explicitly identified within the phenomenon being studied) developed in the framework is dictated by the program goals and objectives. The number of “steps” or “compartments” in the
framework used, must be justified, and the terminology explicitly defined in order for the framework to serve its purpose as a helpful tool in identifying and selecting indicators to retain in a monitoring program. We must also remember that the biases present in the understanding and conceptualization of the phenomenon, and thus the construction of the model, are retained in the indicators derived from this understanding. In basic models such as those of the “Pressure – State – Response” form, these biases are included in the mechanistic and causative approach taken which has difficulties accounting for
exceptions to this form of understanding of the phenomenon, feedback interactions, cumulative impacts and non-linearities (Eyles and Furgal, 2000).
Summary:
Frameworks are tools to be adapted to fit the needs of their users. In the case of
environmental health, the cause-effect relationships are particularly complex in terms of the sources and diversity of contaminants, interactions with genetic and lifestyle
determinants, or other causes of disease/injury. The WHO-developed DPSEEA framework brings together environment and health representatives in action-oriented surveillance. It also offers flexibility to include action at the most appropriate and
effective levels of intervention in a given context. It is also very similar to the framework adapted by the environmental agencies involved in the Border Program. For these
reasons the DPSEEA framework is recommended for use here.
4.0 Indicators and Program Objectives
The purpose of indicators varies considerably with the phenomenon being studied, the relationships within that phenomenon, and the objectives of the program for which the indicators are being used. The International Joint Commission (1991) outlines five examples of common uses for environmental indicators. They are:
? Compliance Indicator: to assess current condition of the environment to judge its
adequacy;
? Change Indicator: to document trends or changes in condition over time (towards
or away from goals);
? Early Warning Indicator: to anticipate hazardous conditions before adverse
impacts occur, to prevent damage;
? Diagnostic Indicator: to identify causative agents, to specify appropriate action; ? Relational Indicator: to identify interdependence between indicators to make an
assessment process more cost-effective.
indicators retained in a monitoring program should be dictated by the specific goals of the program. As Briggs (WHO, 2000: 1.3) states:
“The fundamental assumption is that indicators are intended to serve a purpose. They must therefore be fit for their purpose. This implies that we know what purpose we want them for and who will use them in order to define and design them accordingly. To be useful, indicators must relate to an issue of current or future interest or concern. Different issues raise different questions and different users have different interests and needs. To provide this information the indicator must be interpretable. This means that we must know what differences or changes is the indicator meant for. In addition, indicators should be accurate, so that they provide an undistorted picture of the condition of interest. At the same time, they should be transparent – be readily understood by the users. Crucial for the design of good indicators is the “denominator”.
As many programs have multiple purposes, a balance between the various types of indicators is expected, so that there is some information that can be used, for example, to measure compliance with recognized standards, to track regular changes in
environmental health situations, to provide warning of potential future environmental health hazards, etc. The mission, goals and strategies to achieve the goals of the U.S. – Mexico Border XXI Environmental Health Working Group, which must be considered in selecting appropriate types of indicators for environmental health monitoring in this region, include:
Mission: to achieve a clean environment, protect public health and natural resources, and encourage sustainable development along the U.S. – Mexico Border.
Primary Goal: to promote sustainable development in the border region by seeking a balance among social and economic factors and protection of the environment in border communities and environmental areas.
Strategies to achieve goal: ensure public involvement, build capacity and decentralize environmental management, ensure inter-agency cooperation.
(USEPA, Border XXI Program homepage, 2000)
Further, more specific goals of the program are stated and include:
1. Improve public health in the border region
2. Increase efficient use and protection of water resources
3. Develop infrastructure for water treatment and solid waste treatment and disposal 4. Meet national air quality standards
5. Increase information exchange and cross border notification capacity
6. Increase communities abilities to response to environmental emergencies in the border region
7. Increase local technical capacity
(USEPA Border XXI web site, 2000)
The Mexican ministry of health has recently presented some environmental health indicators based on available data (Rauda, 2000); however it does not address their specific purpose in relationship to objectives. Currently, a review of organizational and government web sites provides limited information on Mexican specific goals and initiatives within the Border region. According to the United States Centres for Disease Control and Prevention, a group of US agencies (CSTE, CDC, ATSDR, EPA) are developing a core group of environmental health indicators that can be used by state and national agencies to track adverse health events related to the environment. The proposed uses for these indicators include: (1) Establishing surveillance of status or trends to (a) prevent known or suspected adverse public health events associated with environmental exposures, (b) detect new adverse health events associated with environmental exposures, and (c) provide efficient and consistent reporting mechanisms; (2) Enhance program and policy development, planning and evaluation by: (d) tracking program goals and
objectives, (e) supporting existing programs, and (f) guiding research initiatives; and finally (3) To build core capacity and relationships withy other agencies (CDC, January 2001).
Central to the goal of protecting public health in relation to environmental influences, we add to this list some basic objectives for consideration in order to further refine the overall goal of improving public health. They are:
? Protect “at risk” populations (e.g. tribal and colonia communities);
? Protect “at risk” individuals as defined by their susceptibility and exposure
patterns (children, women of child bearing age, elderly, those with high occupational exposures, farmers);
? Address priority public health issues with known relationship to an environmental
determinant (based on various criteria including burden of risk, rates of increase/incidence, emerging public health issue).
Further, environmental health objectives should be identified in a way that supports and allows for an incremental implementation of indicator collection over time. As Briggs (WHO, 1999) states, "the DPSEEA framework should be seen as an aid, not a straight-jacket; it needs to be adapted and modified according to circumstance". This approach, of using basic public health priorities, orients our efforts in indicator development
towards the State, Exposure, Effect and Action components of the DPSEEA framework. Through identifying short term (e.g. water quality), mid-term (e.g. air quality) and long term (e.g. occupational risks) priority issues, indicators can be identified and collected at the appropriate scales as the program develops and matures and capacity to conduct the work evolves.
ensure that appropriate indicators are identified and retained within the list of “core indicators”.
What also must be defined here is the objectives of the surveillance exercise which is conducted to generate data to help achieve the program goals and mission. The Canadian Federal/Provincial/Territorial Committee on Environmental and Occupational Health define health surveillance as:
“…the tracking and forecasting of any health event/outcome or health
determinant through the ongoing collection of high-quality data, the integration, analysis and interpretation of that data into surveillance products (reports, advisories, warning etc.), and the timely dissemination of those resultant surveillance products to those who need to know. Surveillance products are produced for a specific and predetermined public health purpose or policy
objective and to be classified as true health surveillance all of the above activities must be carried out. “
The primary activities in health surveillance are to detect, and monitor health-related indicators while the value of surveillance is in the analysis and interpretation of data which may trigger a response to a critical health issue. Important to also note in this definition is the inclusion of surveillance products (summary data, full status reports, data tables, etc.) and the timely dissemination of this material to influence the
decision-making process for public health services but maybe more importantly in the Border region, for development issues (land planning, regional priorities, budgets, human and institutional resources). In order to fulfill their objectives, the activities of the
Summary:
We suggest to further enhance the general objectives stated in the Border XXI Program in the form of public health driven objectives in the following traditional domains of
environmental health: WATER, AIR, FOOD, WASTES, NATURAL /
TECHNOLOGICAL RISKS AND MULTIPLE EXPOSURES, and RESOURCES (financial, human and institutional). This terminology is still very much in use in everyday environmental health practice. These domains of exposure have also been recently confirmed as occurring in approximately the same order as presented above, according to the most important contributors to the burden of disease from environmental sources, using DALYs (for Disability Adjusted Life Years which cover morbidity and mortality) as a common denominator (World Bank, 2000).
The preliminary suggestions below are based on our imperfect reading of the materials provided.
Overall Goal: Protect and promote public health in the U.S. – Mexico Border region as it pertains to environmental and occupational health.
We suggest initial implementation of the first 3 objectives below and gradual
implementation of the fourth according to availability of information and resources.
General Objectives (apply to each thematic category):
1. Assess exposures (including behaviours and perceptions)
2. Assess human chemical and biological exposure and levels of related diseases and populations at risk (mortality, morbidity, perceptions)
3. Identify priority groups for intervention (vulnerable, highly exposed) 4. Reduce exposure / diseases through:
? adapted information and support for several audiences ? protective and control measures
? preventative / corrective measures aimed at individual, community,
state/federal levels
? promotion of adapted behaviours and institutional responses
Preliminary Specific Objectives (by category)
WATER:
Identify at-risk / vulnerable sub-populations, geographic locations and individuals based on available data
Increase availability and access to drinkable water from [insert current level]% to [insert target level]% by [insert target date]
Decrease water related diseases and injuries
AIR:
Decrease # of days exceeding air quality standards from [insert current # here] to [insert target # here] by [insert target date here]
Decrease heat/cold related deaths
Decrease pollution related emergency consultations for asthma, bronchitis and cardio-pulmonary diseases
WASTES:
Toxic: assess exposures of at-risk groups (air – volatile organic compounds, POPs; waterborne/water table contaminations) *
(*consideration of hazardous wastes to include chemical and microbiological risks related to such things as tires as breeding sites for mosquitoes for vector-borne diseases – e.g. dengue)
FOOD:
Estimate the burden of disease from chemical and microbial food contamination Preliminary assessment of key factors in risk chains for microbiological food chain
contamination
NATURAL / TECHNOLOGICAL RISKS AND MULTIPLE EXPOSURES: Assess levels of risk to humans from exposure to natural and technological risks and
multiple exposures *
Assess/decrease poisonings by chemicals in children
Assess/decrease poisonings by pesticides in agricultural workers
Assess exposures (occupational and non-occupational) to heavy metals and POPs on a population basis and identify priority groups
* natural risks including such things as floods, hurricanes, earthquakes, etc.
* technological risks including such things as chemical spills, fires, explosions, etc.
RESOURCES (Financial, Human and Institutional):
Develop more specific, quantifiable objectives for: academic training, on the job training, tools such as information technologies, emergency response teams, expertise and support
Consider priority groups, locations, and needs for development.
Reinforce some specific basic environmental health services (e.g. PAHO Essential Functions, 2000; Environmental Program Framework, 1993)
5.0 Defining the Audience(s)
the ultimate recipients of the program achievements (e.g. the general public as a recipient of enhanced environmental health protection).
As most programs have multiple purposes, they will have multiple users and audiences for the indicators and information they generate. As the indicators must have true meaning to these audiences in order to be effective (e.g. the public health official must understand the importance of a specific indicator in order to use it in an argument for the need for a specific intervention effort) it is useful to explicitly identify them in the development of any monitoring and surveillance program, and whenever possible, involve them in the identification and selection of indicators. From our understanding of the current state of affairs in the Border region, there is a clear need to positively
influence political officials in order to receive their commitment to a second phase of the program for the longer term (i.e. 10 years). This situation usually requires a focus on:
? Indicators at macro scales
? Indicators that can show progress over short periods of time (2-3 years) to
encourage sustained funding
? Indicators that political officials can share with the general public.
As the experience of the last five years shows, such improvements have been possible (i.e. the water related investments and achievements have been remarkable, EPA, 2000).
Another principal use of these indicators would be to bring together the environment and public health practitioners and managers from border states in a more effective manner, through the development and implementation of joint projects. In the first phase of the program, funding and technological infrastructure problems seem to have impeded the full participation of Mexican practitioners and managers. Public health and
environmental practitioners require access to data and information in a timely manner, at both the macro and micro scales, to fulfill the daily responsibilities and provide support for more challenges tasks such as dealing with emergencies and investigations.
Summary:
We suggest two broad categories of audiences (and surveillance products) be considered for the objectives of the environment public health surveillance program for the U.S-Mexico Border region. These two groups are:
1. (Macro audience) – political officials and general publics in the U.S.-Mexico Border region;
2. (Micro audience) – environment and public health practitioners and managers in the U.S.-Mexico Border region.
6.0 Considering Scales and Comparability
Some basic things should be considered regarding scales when choosing indicators for environmental public health surveillance. To meet program goals, indicators of a variety of different scales will be used, however when aggregating indicators based on
geographic scale, one must remember potential loss of detail at smaller scales. Indicators developed with aggregated data (e.g. a specific indicator for health status at the municipal level) may hide inequalities at smaller scales included in the aggregate information (e.g. significant differences between groups of individuals in the municipality). Further, the way in which the information was originally collected (e.g. sample size of surveys) has implications on its ability to accurately represent a specific geographic region or be involved in a valuable aggregated indicator.
The ability to compare indicators between and across regions is often an explicit or implicit objective of surveillance and monitoring programs. Comparisons are made to illustrate progress on a relative scale, identify geographical areas requiring greater attention, and often to help orient future goals and objectives. However, the context (political, environmental, economic) in which the indicators are collected must be considered, respected and incorporated for comparisons to be relevant and of value to their purpose or intent. Adjusting indicators to account for such things as economic buying power (for economic indicators such as GDP and income) help to alleviate these problems. Similarly, where differences in standards between two regions exist,
individual standards should be retained in comparisons rather than conducting
comparisons based on standards of one region. Therefore, in the U.S. – Mexico Border region, we recommend identifying and utilizing local, regional and national standards and procedures of the two countries for components of environmental health (wastes, water, air, etc.) and adjusting, where possible, all economic based indicators for buying power, prior to comparisons between countries.
Summary:
We recommend that issues of scale and comparability be explicitly considered and discussed in the identification and selection of indicators in light of the objectives of the surveillance exercise and audiences involved, at the implementation stage. We
recommend that local, regional and national standards be retained in all cases for issues of comparison and economic based indicators be adjusted for economic buying power when possible. Further, we recommend including as a general objective of the program to:
? Compare indicators across various regions and areas in the U.S. – Mexico Border
region
7.0 Criteria for Indicators: Selecting the right ones
to identify and retain a manageable number that still allows the program to meet its set goals or influence / achieve its desired outcomes. The purpose of indicator selection and the fact that any such selection will appear, for other purposes incomplete, must be kept in mind. Any list of chosen indicators will also be somewhat temporary, reflecting our current state of knowledge and ability to act at this time. In order to guide indicator identification and selection, criteria must be chosen that ensure that the appropriate indicators are retained to meet the desired goals. The literature is rich in potential criteria and indicators for a variety of purposes. It is essential that each program develops its own set of criteria, however, some are common and should be included in most, if not all cases. We propose a rationale for filtering the candidate indicators in which we apply two categories of criteria (science-based and use-based; Eyles et al. 1996) which include consideration of practical program needs criteria such as those discussed by Rump (1996) (e.g. relevant to the program goals, relevant to regional culture and context, clearly understood by target audiences, etc.). The two categories of criteria proposed here are directed at ensuring that indicators of high scientific quality and those best suited to meet the specific needs and goals of the program are identified and retained.
Scientific Criteria
Scientific criteria are generic to the issue of scientific quality and according to Eyles et al. (1996) include:
1. Data availability and suitability: Because of cost and time limitations in many programs consideration must be given to the current availability of data and in considering data already available, the original intent or purpose of its collection must be thought of so as not to compromise the data in meeting other scientific criteria;
2. Indicator validity (assessed in a variety of forms):
? Face validity: the indicator is a reasonable measure as assessed by the
users;
? Construct validity: variables that claim to describe the same dimensions do
so;
? Predictive validity: the measure correctly predicts a situation which would
be caused by the phenomenon being measured;
? Convergent validity: several measures collected or structured in different
ways all move similarly;
? Content validity: the fit between the indicator and the object being
observed;
? Theoretical and empirical validity, as discussed by Hancock et al. (1999),
adds to this list, assessing whether the indicator measures an important health determinant or dimension;
3. Indicator representativeness: a measure of the indicators appropriateness to represent a specific dimension of concern within the phenomenon of interest; 4. Reliability: measured by consistency over a number of repetitions, to ensure the
5. Ability to disaggregate: disaggregating indicators are those that are able to be broken down into other variables telling us much more than the single measure it represents. The OECD (1976) identify disaggregation by ascribed groups (e.g. age, sex, race, region), well-being (e.g. years of education, employment status) and contextual (e.g. size of community, type of occupation) characteristics.
Use Based Criteria
The development and selection of use-based criteria depends on the goals of the indicator application or surveillance program and the context within which they are used (e.g. socio-economic and political environment of the U.S.-Mexico border region). Use-based criteria present in the literature vary from the general (e.g. are they feasible to collect ?) to the very specific (e.g. what is the valency of the indicator (potential to carry political and social ‘punch’)). As Eyles et al. (1996) state, as much clarity as possible is required in the relationship between the indicator and the purpose for which it is used. Some of the commonly reported use-based criteria include:
1. Feasibility (are they already collected and available and if not, how feasible is it to collect new information considering cost, ease and time for collection, capacity to gather data, etc.);
2. Resonance with audiences in relation to topics covered (importance of the indicator measurement to those affected as indicated by publics involved in selection process); 3. Manageability (a manageable number is needed to attain specified goals, but this
number must not be too cumbersome or unruly for surveillance system managers to comprehend and manage mentally);
4. Balance (a rough balance among all phenomenon of interest should be represented); 5. Catalyst for action (those that act as a catalyst to drive action of one form or another
are highly valued).
Various programs reported on in the literature have developed similar and more specific use based criteria, some include : indicator sensitivity, understandability by the press and policy makers, minimal environmental impact to collect, population applicability (applies to diverse population) etc. (Hancock et al., 1999; USEPA, 1994; IJC, 1991). It is
important to stress though that regardless of the criteria used to choose indicators, a close relationship between the criteria and the goals set for the use of the indicators is of utmost importance.
Summary:
Until now, most efforts on indicators in the Border region have focused on the science-based criteria with (apparently) less attention being paid to their use. We suggest to move towards a more use-driven selection process founded on the program public health objectives as suggested and the feasibility of indicators to meet these objectives in ways that are achievable in the U.S. – Mexico Border region. Use based criteria to be used in the indicator selection process should be explicitly discussed and agreed upon among involved and affected parties at the outset of the process. Those utilized must be specific to the context and needs of the regions involved and objectives of the program.
8.0 Choosing a Set of Core Indicators
Many authors have discussed the fact that differences in data collection practices and capacities across local, regional, national and international scales, as well as the lack of agreement, in many cases, on how to address environmental health issues and set priorities, and the jurisdictional differences to do so, makes the selection of a single, universally applicable set of indicators unrealistic and undesirable. Further, regional differences in many of the factors influencing good indicator development and selection need to be considered and respected in multi-regional monitoring programs. It is for these reasons and others that the CDC has proposed the development of “core” indicators for environmental and health surveillance programs along with the addition of “optional” indicator sets allowing regions to addresses specific differences and meet specific needs.
As defined by the CDC (2001):
Core indicators: are likely to be available at a state level and should be part of a basic environmental health program;
Optional indicators: states may choose to use them depending on individual needs, priorities, data availability, or which may be indicators with environmental components but which may already be under the jurisdiction of other programs in state health departments.
As an example, a two staged process for indicator identification and selection used by Gosselin et al. (1991) in their “Indicators for Sustainable Society” is presented here. A process was followed in which the first set of indicators were selected based on:
1. Previously published or selected by individuals in workshops or interviews; and 2. Acceptable comparative ability between countries and regions.
The second set was then selected based on:
1. High synthetic value (incorporation of the key elements of the problem as defined by the working group);
All indicators were then assessed on their scientific validity and reliability, and various other criteria deemed important by the group. The number retained was then reduced based on their score from criteria, internal coherence (avoid duplication and respect of key problem elements), external coherence, maximum reduction of number of indicators, and selection of a balance of indicators between phenomenon areas in the program.
Regardless of the specific process selected for choosing which indicators fall under the category “core” and “optional”, some priorities should be considered. Assuming they meet the scientific criteria deemed most critical, core indicators could be those that score higher on more overall criteria used in the selection process and are therefore closer to achieving numerous program goals. Core indicators could also be selected for their perceived greater central importance to the program as decided by program developers. They could be those that are more easily attainable across all regions involved in the program, are critical for central goals or such things as comparative purposes across regions involved.
Finally, once a proposed list of indicators (core and optional) are selected, a manageable number should be retained to allow the program to function without having to deal with unrealistic data collection and management expectations. Further, priorities for collection should be set based on environmental health program needs and priorities that allows the incremental implementation of indicator collection and analysis. The “program” should be one in which sets of indicators can be easily grouped into logical and useful themes and understandable lists (by core and optional, and chosen themes). The final number of indicators retained can be reduced by aggregating indicators into logical indices (e.g. Quality of Life), over meaningful geographic scales, and by using such things as “sentinel” events (which illustrate the status of various indicators) as tools of measurement (Eyles and Furgal, 2000). It is important to consider here the mental management of numbers of indicators used to describe specific environmental issues. Ideally, the minimal number needed to meet program goals should be retained however, this is difficult to determine (Eylenbosch and Noah, 1988). Miller (1956) suggests 7±2 as the “magic” number for mental management and comprehension. Therefore, it is
suggested that a small number of categories (5-9) with a small number of indicators in each (5-9) be retained and then a core set selected as a balance from all categories to be collected in all regions involved in the program.
Summary:
We propose to work from established lists of indicators already developed and available through other organizations and agencies (PAHO, USEPA, CDC, USDHHS, Briggs developed for WHO). The science based criteria are therefore prominent in choosing these lists and thus are well incorporated here. We therefore, stress more use-based criteria to drastically reduce the working lists of indicators and choose those most appropriate and carrying most weight for the specific needs of the U.S. – Mexico Border region. We propose to filter the indicators through the following use-based criteria:
practitioners and managers activities and responsibilities (including laws, regulations, needs and concerns);
? Resonance with political officials and the general public and their needs and
concerns.
Following the first iteration of review and selection, we suggest that priorities be established among chosen indicators through consideration for:
? Feasibility and manageability of data collection / integration for indicators in light
of existing and likely available financial and human resources / capacities;
? Ease of implementation over time (short term, mid-term and long term scales) ? Synergy and complementarity for Border XXI program and / or other Border
initiatives and national / federal surveillance systems.
Once completed, a final check of the core list of indicators should be done and adjustments made accordingly, considering:
? Face validity: does the list make sense ? is it likely to be what is needed for action ? is
it sustainable in the mid and long terms ?
? Reduce redundancy among indicators
? Strive for a balance among the different compartments of the DPSEEA framework ? Balance action based indicators among (a) providing service and access, (b) ensuring
the quality of the service, and (c) increase public knowledge of this service
Through the review process indicators will be ranked based on their subjective score on each criteria such that an overall ranking of all indicators per theme can be used to identify priority indicators to retain for a core list. This process will be guided and recorded through the use of a spreadsheets (Appendix A, Appendix B). We suggest that approximately 5 indicators for each of the 4 exposure categories be retained, for a total of around 20 core indicators; remaining indicators can then be classified as optional indicators and ranked for implementation.
9.0 Core Environmental Public Health Indicators for the U.S. - Mexico Border Region
understanding of these situations may be known (PAHO, Encuesta, 2001), a more detailed assessment would be helpful. A user needs assessment, similar to some recent reviews conducted in Canada (e.g. Federal/Provincial/Territorial CEOH, 2000) on such issues as access to data, availability of information, etc. is therefore recommended for this region to support the development and implementation of an appropriate surveillance program, including its training and tools component.
A pro forma selection of core indicators was then presented at the meeting in El Paso for illustration purposes only, based on the authors’ appreciation of criteria. The July 26-27 work session then followed a similar process (outlined below) to determine the final draft core group of indicators and suggest adaptations to the document.
10.0 Results of the El Paso Workshop: A Draft List of Core Indicators
A two-day workshop convened on July 26 and 27, 2001 at the El Paso field office of the Pan American Health Organization brought together Mexican and PAHO representatives (Appendix C) to review the initial draft of this document, the definitions and criteria herein, and follow a process for indicator ranking and selection. Suggested adaptations to the document have been included in the draft presented here. Indicators compiled from recognized organizations (PAHO, CDC, USEPA, USDHHS, Briggs developed for WHO) were used to form the basis for indicator selection and are presented in the matrix in Appendix A. Proceeding by each category (e.g. water, air, etc.) an initial review of definitions and indicators presented throughout this document and in Appendix A was held among the participants and adaptations to the definitions and lists were made where appropriate (e.g. to operationalize definitions for this program and to fill gaps among indicators for any one category or objective, or reorganize indicators in the appropriate category). All indicators were then scored by each participant based on the first 3 criteria (see below) and all indicators receiving scores of 8 and 9 from any one participant were retained and are presented in Table 1. During the scoring and ranking process, objective 3 was subdivided into its two basic components (high exposure and vulnerable
populations) and is therefore presented as such in Tables 1 and 2).
Criteria used to score initial list of indicators:
Catalyst for action in public health programs within Border XXI initiative
3-if related impact or consequences can lead to death directly or in the short term; 2-if related impact is potentially severe and/or a large population is impacted; 1-if related impact is likely reversible or benign.
Resonance with public health and environment practitioners and managers
3-if high burden of disease and high level of attributable risk; 2-for moderate;
1-for low.
Resonance with political officials and public needs and concerns
3-if perceived as very important in public mind; 2-if somewhat important;
2001.
OBJECTIVE 1.
ASSESS EXPOSURES AND RISK LEVELS (INCL. PERCEPTIONS AND BEHAVIOURS
OBJECTIVE 2.
ASSESS BIOLOGICAL EXPOSURES AND LEVELS OF RELATED DISEASES (MORTALITY, MORBIDITY, PERCEPTIONS)
WATER % access to drinking water (disinfected, connected, water quality
stds, simple access to public source, rural/urban)
% access to excreta disposal facilities (rural/urban, connected, individual)
Diarrhea mortality in children under 5 (Briggs)
Estimated deaths rates due to intestinal infectious diseases in children under 5 y (PAHO C10)
Outbreaks of waterborne disease (Briggs, CDC)
AIR Ambient air concentrations for criteria pollutants in each sister city (Border)
Number of exceedances (days) for each ambient air standard (Border)
Proportion of youth 15-19 of age who smoke (PAHO D 30)
Percentage of households using coal, wood or kerosene as main source of heating/cooking fuel (Briggs)
Unusual pattern of cardiovascular and respiratory events (with environmental contribution) (CDC)
Temperature attributed deaths (CDC)
Percentage of children under 18 with asthma and chronic bronchitis (EPA-C; D1)
FOOD Calories avail per capita PAHO-B1
% of fruits, vegetables, grains, dairy and processed food with detectable levels of pesticide residues EPA-C 81
Outbreak rate of foodborne illness (Briggs) 86
Incidence of diarrhoea morbidity in children < 5 from foodborne sources (modified from Briggs) 87
WASTE Number of chemical spills (transportation and fixed facility)
EPA 90
% urban pop with regular collection of solid waste PAHO E9
Incidence of chemical spill related injuries and poisonings EPA 91
MULTIPLE EXPOSURES Percentage of workers exposed to unsafe, unhealthy or hazardous working conditions (Briggs)
Concentrations of lead in blood for children 5 and under, and % with concentrations over 10 micrograms/dl (EPA-C; B1-2)
Concentrations of other heavy metals and POPs in blood for at-risk groups
Cancer incidence and mortality for children under 20 by type (EPA-C; D5a, D5b)
Estimated death rates due to tumors (selected sites according to high priority chemicals) (PAHO C20)
Pesticide-related poisoning and illness (CDC)
Incidence of occupational mortality (Briggs)
Number of reported poisonings per year in children under 5 (Briggs)
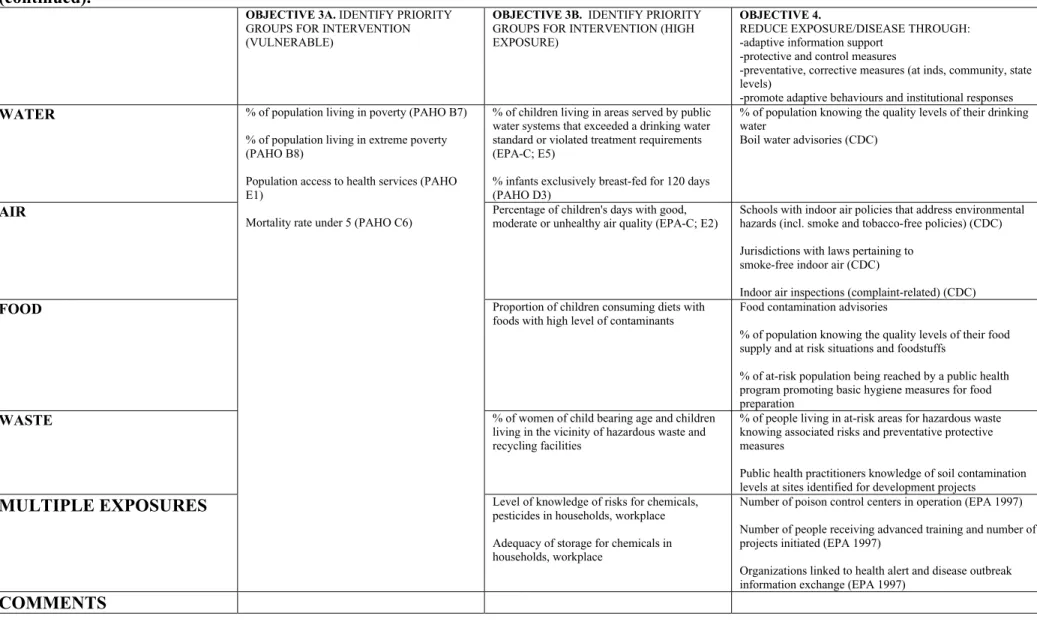
Table 1. Retained indicators following initial review and scoring by participants at the El Paso Workshop, July 26- 27, 2001 (continued).
OBJECTIVE 3A. IDENTIFY PRIORITY GROUPS FOR INTERVENTION (VULNERABLE)
OBJECTIVE 3B. IDENTIFY PRIORITY GROUPS FOR INTERVENTION (HIGH EXPOSURE)
OBJECTIVE 4.
REDUCE EXPOSURE/DISEASE THROUGH: -adaptive information support
-protective and control measures
-preventative, corrective measures (at inds, community, state levels)
-promote adaptive behaviours and institutional responses
WATER % of children living in areas served by public
water systems that exceeded a drinking water standard or violated treatment requirements (EPA-C; E5)
% infants exclusively breast-fed for 120 days (PAHO D3)
% of population knowing the quality levels of their drinking water
Boil water advisories (CDC)
AIR Percentage of children's days with good,
moderate or unhealthy air quality (EPA-C; E2)
Schools with indoor air policies that address environmental hazards (incl. smoke and tobacco-free policies) (CDC)
Jurisdictions with laws pertaining to smoke-free indoor air (CDC)
Indoor air inspections (complaint-related) (CDC)
FOOD Proportion of children consuming diets with
foods with high level of contaminants
Food contamination advisories
% of population knowing the quality levels of their food supply and at risk situations and foodstuffs
% of at-risk population being reached by a public health program promoting basic hygiene measures for food preparation
WASTE % of women of child bearing age and children
living in the vicinity of hazardous waste and recycling facilities
% of people living in at-risk areas for hazardous waste knowing associated risks and preventative protective measures
Public health practitioners knowledge of soil contamination levels at sites identified for development projects
MULTIPLE EXPOSURES
% of population living in poverty (PAHO B7)
% of population living in extreme poverty (PAHO B8)
Population access to health services (PAHO E1)
Mortality rate under 5 (PAHO C6)
Level of knowledge of risks for chemicals, pesticides in households, workplace
Adequacy of storage for chemicals in households, workplace
Number of poison control centers in operation (EPA 1997)
Number of people receiving advanced training and number of projects initiated (EPA 1997)
Organizations linked to health alert and disease outbreak information exchange (EPA 1997)
These indicators were then entered into the matrix presented in Appendix B and
subjected to the same scoring system based on a second list of 3 criteria (see below). A sum of all participants’ scores for each individual indicator was then calculated and the top 2 indicators (receiving greatest cumulative total) for each objective (e.g. Objective 1 – assess exposures and risk levels) in each environmental health category (e.g. air) were then retained for the final draft core list of indicators. Adjustments were then made to this list based on a final assessment of indicator coverage, balance etc. as outlined in the box on page 23. This core list of approximately 50 indicators is presented in Table 2. Through the development of Table 2, participants expressed a specific need to address the issue of occupational exposures and risks in the U.S.-Mexico Border region and thus appropriate indicators were reorganized into this newly identified category as presented in Table 2.
Criteria used to score indicators retained in Table 1 (following first round review):
Feasibility and manageability of collection and integration for U.S. – Mexico Border region
3-if already collected;
2-if data collection needs major improvement or if special survey needed; 1-if also needs lab data and/or specific epidemiologic investigation.
Ease of implementation over time
3-if can be implemented in the short term; 2-if can be implemented in mid-term (2-3 years);
1-if requires long-term for implementation (more than 3 years).
Synergy and Complementarity for Border XXI Program and/or other Border initiatives and national / federal surveillance systems
3-if strongly supports the achievement of three or more objectives; 2-if it helps to achieve one to two objectives;
Paso Workshop, July 26-27, 2001.
OBJECTIVE 1.
ASSESS EXPOSURES AND RISK LEVELS (INCL. PERCEPTIONS AND BEHAVIOURS)
OBJECTIVE 2. ASSESS BIOLOGICAL EXPOSURES AND LEVELS OF RELATED DISEASES (MORTALITY, MORBIDITY, PERCEPTIONS)
OBJECTIVE 3A.
IDENTIFY PRIORITY GROUPS FOR INTERVENTION (VULNERABLE)
OBJECTIVE 3B.
IDENTIFY PRIORITY GROUPS FOR INTERVENTION (HIGH EXPOSURE)
WATER Percentage of urban population with potable water through house connections (PAHO E2)
Access to basic sanitation (Briggs
Diarrhea mortality in children under 5 (Briggs)
Diarrhea morbidity in children under 5 (Briggs)
Degree to which drinking water systems comply to guidelines (CDC)
% of children living in areas served by public water systems that exceeded a drinking water standard or violated treatment requirements (EPA-C; E5)
AIR Number of exceedances days for each ambient air standard (Border)
Proportion of youth 15-19 of age who smoke (PAHO D 30)
Ambient air concentrations for criteria pollutants in each sister city (Border)
Percentage of households using coal, wood or kerosene as main source of heating/cooking fuel (Briggs)
Incidence of morbidity due to acute respiratory infections in children under 5 (Briggs)
Estimated death rates due to acute respiratory infections in children under 5 (PAHO C11)
Percentage of children living in counties in which air quality standards were exceeded (EPA-C; E1)
Percentage of homes with children under 7 where someone smokes regularly (EPA-C; E4)
FOOD Level of consumption for raw milk
Level of consumption of traditionally preserved food
# of outbreaks of foodborne illness
(Briggs) 86 Proportion of children consuming diets with foods with high level of contaminants
WASTE Number of chemical spills
(transportation and fixed facility) EPA 90
Quantities of hazardous waste exported to Mexico for recycling EPA-Env 97
Incidence of chemical spill related injuries and poisonings EPA 91
Blood/urine concentration levels (95th percentile) for heavy metals in the vicinity of recycling and / or hazardous waste facilities modified from EPA 92
% of women of child bearing age and children living in the vicinity of hazardous waste and recycling facilities
% of population living in noxious fauna and pest infested dwellings
MULTIPLE EXPOSURES
Adequacy of storage for chemicals in
households Number of reported poisonings per year in children under 5 (Briggs)
Estimated death rates due to tumors (selected sites) (PAHO C20)
Incidence of birth defects
Population access to health services (PAHO E1)
Mortality rate under 5 (PAHO C6)
% of population living in extreme poverty (PAHO B8)
Birthweight
Adequacy of storage for chemicals in
workplace or hazardous working conditions may exist
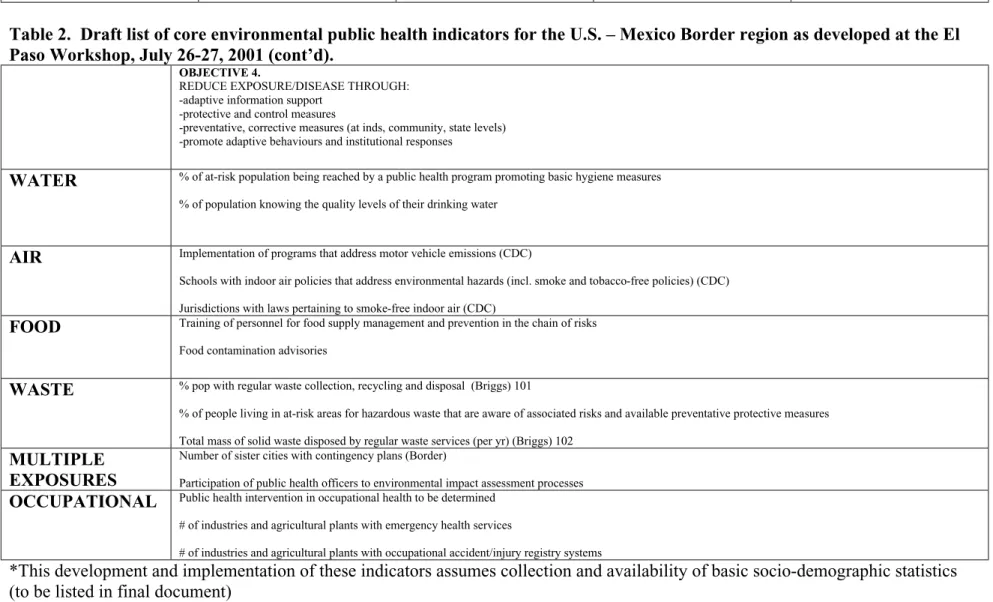
Table 2. Draft list of core environmental public health indicators for the U.S. – Mexico Border region as developed at the El Paso Workshop, July 26-27, 2001 (cont’d).
OBJECTIVE 4.
REDUCE EXPOSURE/DISEASE THROUGH: -adaptive information support
-protective and control measures
-preventative, corrective measures (at inds, community, state levels) -promote adaptive behaviours and institutional responses
WATER % of at-risk population being reached by a public health program promoting basic hygiene measures % of population knowing the quality levels of their drinking water
AIR Implementation of programs that address motor vehicle emissions (CDC)
Schools with indoor air policies that address environmental hazards (incl. smoke and tobacco-free policies) (CDC)
Jurisdictions with laws pertaining to smoke-free indoor air (CDC)
FOOD Training of personnel for food supply management and prevention in the chain of risks Food contamination advisories
WASTE % pop with regular waste collection, recycling and disposal (Briggs) 101
% of people living in at-risk areas for hazardous waste that are aware of associated risks and available preventative protective measures
Total mass of solid waste disposed by regular waste services (per yr) (Briggs) 102
MULTIPLE EXPOSURES
Number of sister cities with contingency plans (Border)
Participation of public health officers to environmental impact assessment processes
OCCUPATIONAL Public health intervention in occupational health to be determined # of industries and agricultural plants with emergency health services
# of industries and agricultural plants with occupational accident/injury registry systems
*This development and implementation of these indicators assumes collection and availability of basic socio-demographic statistics (to be listed in final document)
Finally, some recommendations for implementation were made by the participants at the El Paso workshop. They include:
? The program must require “buy-in” for all components of the surveillance /
monitoring program among participating communities. If this is not possible initially, the commitment to pursue all appropriate and feasible components must be sought with an interest to include all program components when it is possible in the future. Therefore, no community can participate solely for the interest in one aspect of the program (e.g. water infrastructure).
? In order to ensure data quality and reliability there was an identified need for a
QA/QC (quality assurance / quality control) program for laboratory and evaluation services. This requires the appropriate financial and human resources.
? The following time schedule should be used to guide the development and
implementation of the program (see below). There is a recognized need to proceed slowly in the initial stages to ensure data quality and to gradually implement all objectives and indicators over time.
11.0 References
Briggs, D., Corvalan, C., and M. Nurminen. 1996. Linkage methods for environment and health analysis. UNEP/US EPA/WHO, Geneva, Switzerland.
Centres for Disease Control and Prevention (CDC). 2001. Environmental Public Health Indicators. January 2001, draft.
Corvalán, C., D. Briggs and T. Kjellstrom. 1996. “Development of environmental health indicators”, in Linkage methods for environment and health analysis. General guidelines. (D. Briggs, C. Corvalán and M. Nurminen, eds.). Geneva: UNEP, USEPA and WHO, pp.19-53.
Eylenbosch, W.J. and N.D. Noah (Eds.). 1988. Surveillance in Health and Disease. Oxford University Press, New York, NY. 286 pp.
Eyles, J., and Furgal, C. 2000. Indicators in environmental health: Identifying and selecting common sets. Paper prepared for the International Joint Commission
Conference “Consensus Conference on Environmental Health Surveillance: Agreeing on basic sets of indicators and their future use”, Quebec City, October 10-12, 2000.