Descriptive study of the Specialized Care
of the Spanish Health System
Karen Nombela-MonterrosoI, Víctor M González-ChordáI, Pablo RomanI,II
I Universidad Jaume I. Departamento de Enfermería. Castellón, España
II Universidad de Almería. Departamento de Enfermería, Fisioterapia y Medicina. Almería, España
ABSTRACT
OBJECTIVE: he objective of this study is to analyze the trend of the Key Indicators of the National Health System of Spain and its autonomous communities, related to Specialized Care, from the publication of the Law of Cohesion and Quality.
METHODS: his is an ecological study of temporary series of Spain and its autonomous communities from 2003 to 2014. We have analyzed 10 indicators related to Specialized Care (percentage of expenditure, professionals, waiting lists, surgical activity, average duration, infections, and mortality) using the Prais-Winsten regression method. We have obtained data from the health information system of the Spanish Ministry of Health, Social Services, and Equality. RESULTS: Specialized care expenditure (APC = 0.059, 95%CI 0.041–0.074), number of medical professionals (APC = 0.0006, 95%CI 0.0003–0.0009) and nursing professionals (APC = 0.001, 95%CI 0.0005–0.0016), hospital infections (APC = 0.0003, 95%CI 0.0002–0.0004), and in-hospital mortality (APC = 0.0008, 95%CI 0.0006–0.001) had an increasing trend in Spain. Average duration presented a decreasing trend (APC = -0.0017, 95%CI -0.002– -0.0014). he trend of waiting lists (specialized appointment and non-urgent surgical interventions) was static. he trend of these indicators varied in the Autonomous Communities.
CONCLUSIONS: We have observed a non-compliance with the principles of equity and quality of the services ofered. Increased aging, technological development, and inadequate strategies taken to reduce health costs may be the main causes.
DESCRIPTORS: Health Services. Tertiary Healthcare. Quality Indicators, Health Care, trends. Health Care Quality, Access, and Evaluation. Ecological Studies.
Correspondence:
Pablo Román López
Edificio de Ciencias de la Salud Universidad de Almería Ctra. Sacramento s/n
04120 La Cañada de San Urbano Almería, España
E-mail: [email protected]
Received: Sep 29, 2016
Approved: Feb 2, 2017
How to cite: Nombela-Monterroso K, González-Chordá VM, Roman P. Descriptive study of the Specialized Care of the Spanish Health System. Rev Saude Publica. 2018;52:5.
Copyright: This is an open-access article distributed under the terms of the Creative Commons Attribution License, which permits unrestricted use, distribution, and reproduction in any medium, provided that the original author and source are credited.
INTRODUCTION
A health system aims to improve the health status of its population with curative, preventive, and rehabilitative care and it is inluenced by the political, social, cultural,
and economic context of the country in which it is developed1. here are diferent models
of health systems, among them, the National Health System (SNS), currently existing in
Spain related to the General Health Law of 19862. Its main characteristics are the right of
every citizen to health protection, public inancing, and provision of services that ensure
the quality of care, among others1–3.
On the other hand, among the principles and criteria of this law, we can find the decentralization of health in Autonomous Communities (AC), granting to each one the
responsibility of meeting the health of its citizens3. he decentralization process, inalized in
2001, had the objective of adapting the health management to the territorial and demographic
characteristics of each AC4. In 2003, the Law of Cohesion and Quality of the SNS (LCC-SNS)5
was published to ensure citizen participation, quality, and equity of the health care throughout the country. his law understands equity as the right to health protection in conditions of
efective equality throughout the territory that allows the free movement of all citizens1.
Decentralization processes are justiied by advantages such as the adequacy of services to the needs of each territory, the approximation of institutions to citizens or the development of alternative management models, and a source of learning. hirteen years after the publication of the LCC-SNS, the lack of health equity is one of the main problems deriving from decentralization, especially regarding expenditure and inancing, health status of
citizens, access to health care, and use of resources6.
he LCC-SNS revealed the importance of professionals in the quality of the system and research in the development and efectiveness of health services. It also highlighted the need to address the most prevalent health problems with the elaboration of strategic plans that determine minimum care standards and basic care models, while ensuring the sustainability
of the SNS1,5,7. he Royal Decree-Law 16/2012, of urgent measures to ensure the sustainability
of the SNS and to improve the quality and safety of its services8, was published to address the
serious economic situation and the increase in health expenditure, although its application
caused economic austerity with signiicant repercussions in the SNS9.
On the other hand, the LCC-SNS entrusts to the Ministry of Health the creation of a Health Information System to ensure the availability of information and communication between
the Administration of the Government and the AC7.
In this system, we can ind the “Key Indicators of the SNS”, which provide, in an integrated and systematic way, data on health expenditure, use of resources, accessibility to services, quality of care, and level of health of the population. his allows us to objectify a determined health situation, evaluate its behavior over time, and know if the proposed objectives and
the expected results are achieved to establish improvement actions10.
he objective of this work was to analyze the evolution of the Key Indicators of the SNS of Spain and its AC, related to Specialized Care (SC) after the Law of Cohesion and Quality.
METHODS
his is an ecological study of time series that analyzed the trend of the Key Indicators of the SNS of Spain and its AC, using the Health Information System of the Ministry of Health,
Social Services, and Equality related to SC11.
We included data from the indicators since 2003, which is when the LCC-SNS came into
force, until 2014, the last year with information available in the Health Information System11
for the selected indicators.
Trend estimation was based on the calculation of annual percentage change (APC) and its 95% conidence intervals (95%CI), using the Prais-Wisnten regression method for the analysis
of time series, which allows us to obtain an overall trend for a given period12. he analysis was
performed on all indicators for the SNS and each AC using the program Stata 14.0 (2015).
RESULTS
he percentage of expenditure dedicated to SC in Spain increased by 9.5 points between 2003 and 2014, from 46.3% to 55.8%, with an increasing trend (APC = 0.059, 95%CI 0.041–0.074). We observed an increasing trend in expenditure dedicated to this level of care in thirteen AC, while the trend was static in four AC (Cantabria, Aragon, Balearic Islands, and Madrid). Catalonia was the AC with the greatest increase in SC expenditure (APC = 1.367, 95%CI 0.319–5.731). We observed no decrease of the indicator in any AC, although information for this indicator for Ceuta and Melilla was not available.
he number of nursing and medical professionals per 1,000 inhabitants in Spain showed an increasing trend for nursing (APC = 0.001, 95%CI 0.0005–0.0016) and medical professionals (APC = 0.0006, IC95% 0.0003–0.0009). Melilla presented a static trend in both indicators and Ceuta had a decreasing trend in the number of physicians (APC = -0.0013, 95%CI -0.0013– -0.0001) (Table 1).
he rate of patients on waiting lists for specialized appointments (APC = 0.001, 95%CI -0.006–0.008) and the number of patients waiting for non-urgent surgical interventions (APC = 0.001, 95%CI -0.001–0.003) showed a static trend in both cases for Spain. he analysis of the evolution of these indicators from the AC could not be performed because the data were not available.
Working operating rooms reached a total of 9.4 per 100,000 inhabitants in Spain in 2014, with an increasing trend (APC = 0.002, 95%CI 0.001–0.003). Navarre (APC = -0.0008, 95%CI -0.001– -0.0001), Ceuta (APC = -0.003, 95%CI -0.004– -0.001), and Melilla (APC = -0.005, 95%CI -0.007– -0.005) showed a decreasing trend, while 11 AC had an increasing trend and ive remained static (Valencia, Castile and León, Canary Islands, Balearic Islands, and Cantabria).
Box. List of selected indicators.
Indicators Formula
Percentage of expenditure on specialized
care services services / Total current public health expenditure) x 100(Public health expenditure in hospital and specialized Nursing staff in specialized care per 1,000
inhabitants (Number of nurses / Population) x 1,000
Specialized medical staff per 1,000
inhabitants (Number of physicians / Population) x 1,000
Patients waiting for specialized care
appointments (Number of patients pending an initial appointment in Specialized Care / Population) x 1,000 Working operating rooms per 100,000
inhabitants (Number of working operating rooms / Population) x 100,000
Surgical interventions per 1,000 inhabitants (Total number of surgeries performed in one year / Population in that year) x 1.000
Patients waiting for non-urgent surgical
interventions per 1,000 inhabitants (Number of patients pending a non-urgent surgical intervention / Population) x 1,000 Average duration Average days of stay of the valid total discharges
Rate of hospital infection (Number of hospital discharges with nosocomial infection diagnosis in one year / Total discharges in that year) x 100
Global in-hospital mortality per 100 hospital discharges
Surgical interventions in Spain showed an increasing trend in the period studied, going from 95.2 to 107.6 interventions per 1,000 inhabitants (APC = 0.292, 95%CI 0.047–1.589). his rate kept an increasing trend in 10 AC and a static trend in six AC (Balearic Islands, Murcia, La Mancha, Andalusia, Navarre, and Melilla). his indicator showed a decreasing trend in the Canary Islands (APC = -0.006, 95%CI -0.008– -0.001), Ceuta (APC = -0.009, 95%CI -0.01– -0.008), and Cantabria (APC = -0.009, 95%CI -0.01– -0.009).
Table 1. Nursing and medical staff in specialized care per 1,000 inhabitants. Spain, 2003–2014.
AC 2003 2014 APC 95%CI Trend
Basque Country Nursing 2.46 4.42 0.0055 0.0031–0.0082 Increasing
b
Medical 1.37 2.213 0.002 0.001–0.003 Increasinga
Asturias Nursing 2.76 3.61 0.0018 0.0012–0.0025 Increasing
b
Medical 1.75 2.15 0.0009 0.0004–0.0014 Increasinga
Aragon Nursing 3.29 4.3 0.0022 0.0015–0.0029 Increasing
b
Medical 1.96 2.15 0.0004 < 0.0001–0.012 Static
Galicia Nursing 2.62 3.16 0.0012 0.0002–0.0023 Increasing
a
Medical 1.52 1.76 0.0005 0.0001–0.0009 Increasinga
La Mancha Nursing 2.40 2.79 0.0009 -0.0002–0.0022 Static
Medical 1.44 1.74 0.0007 -0.0001–0.001 Static
Castile and León Nursing 2.68 3.14 0.001 0.0003–0.0018 Increasing
a
Medical 1.48 1.86 0.0009 0.0006–0.0012 Increasingb
Catalonia Nursing 2.68 3.16 0.0011 0.0004–0.0018 Increasing
a
Medical 1.80 1.84 > -0.0001 -0.006–0.0001 Static
Madrid Nursing 2.86 3.32 0.001 0.0002–0.0019 Increasing
Medical 1.55 2 0.011 0.007–0.001 Increasingb
Murcia Nursing 2.49 2.93 0.001 0.0001–0.002 Increasing
a
Medical 1.43 1.75 0.0008 0.0004–0.0011 Increasingb
Spain Nursing 2.67 3.14 0.001 0.0005–0.0016 Increasing
a
Medical 1.54 1.81 0.0006 0.0003–0.0009 Increasinga
Canary Islands Nursing 2.64 3.07 0.0009 0.0004–0.0014 Increasing
a
Medical 1.55 1.78 0.0005 0.0004–0.0006 Increasinga
Balearic Islands Nursing 3.23 3.6 0.0006 -0.0003–0.0017 Static
Medical 1.60 1.87 0.0066 0.0001–0.001 Increasinga
Navarre Nursing 4.03 4.22 0.0005 -0.001–0.0024 Static
Medical 2.07 2.39 0.0007 0.0001–0.0013 Increasinga
Andalusia Nursing 2.46 2.61 0.0005 -0.0001–0.001 Static
Medical 1.30 1.53 0.0005 0.0003–0.0007 Increasingb
Extremadura Nursing 2.62 2.92 0.0006 0.0003–0.0009 Increasing
Medical 1.45 1.75 0.0006 0.0004–0.0009 Increasingb
La Rioja Nursing 2.88 3.14 0.0003 -0.0005–0.001 Static
Medical 1.44 1.68 0.0005 < 0.0001–0.0008 Increasinga
Valencia Nursing 2.54 2.64 0.0004 0.0002–0.0006 Increasing
b
Medical 1.48 1.648 0.006 < 0.001–0.011 Increasinga
Cantabria Nursing 3.12 3.23 0.0002 -0.0003–0.0007 Static
Medical 1.61 1.76 0.0002 -0.0002–0.009 Static
Melilla Nursing 2.72 2.33 -0.0007 -0.0016–0.0003 Static
Medical 1.32 1.26 -0.0001 -0.0004–0.0002 Static
Ceuta Nursing 2.93 2.53 -0.0009 -0.0019–0.0001 Static
Medical 1.76 1.47 -0.0007 -0.0013– -0.0001 Decreasinga
AC: autonomous community; APC: annual percent change a Significance level p < 0.05.
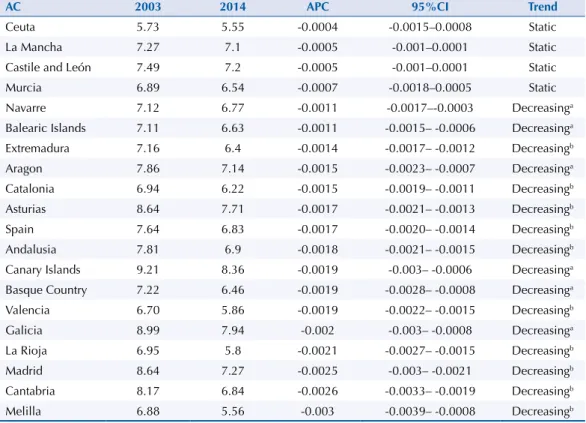
he average stay of patients in 2014 (Table 2) was 7.6 days in Spain, with a decreasing trend (APC = -0.0017, 95%CI -0.002– -0.001). his indicator has declined in recent years in all AC, although the trend can be considered as static in four of them.
We observed an increase of 0.16 points in the rate of hospital infections in Spain, going from 1.2 in 2003 to 1.3 in 2013, with an increasing trend (APC = 0.0003, 95%CI 0.0002–0.0004) (Table 3).
he increase in in-hospital mortality in Spain was 0.3 points, going from 3.9 to 4.2 per 100 hospital discharges in the period studied, with an increasing trend (APC = 0.0008, 95%CI 0.0006–0.0011) (Table 4).
DISCUSSION
he data show an increasing trend in the indicators of expenditure on SC services, nursing and medical staf in SC per 1,000 inhabitants, working operating rooms per 1,000 inhabitants, surgical interventions per 1,000 inhabitants, rate of hospital infections, and in-hospital mortality for every 100 hospital discharges. Nevertheless, we observed a decreasing trend in the indicator of average duration. Similarly, we found a static trend in the indicators of patients waiting for specialized care appointments and patients waiting for non-urgent surgical interventions per 1,000 inhabitants.
Health expenditure on SC has been increasing in most Autonomous Communities. However, high health expenditure to address these problems is not a suicient condition to ensure good public health or good quality of the services. Regardless of a greater or lesser expenditure,
the services provided need to have greater eiciency13.
his increase in health expenditure on SC can be related to the demographic change
and technological development14, although it clearly contradicts the principles of health
promotion and disease prevention of the General Health Law2. A good strategy to foster
Table 2. Indicator: average duration in descending order. Spain, 2003–2014.
AC 2003 2014 APC 95%CI Trend
Ceuta 5.73 5.55 -0.0004 -0.0015–0.0008 Static
La Mancha 7.27 7.1 -0.0005 -0.001–0.0001 Static
Castile and León 7.49 7.2 -0.0005 -0.001–0.0001 Static
Murcia 6.89 6.54 -0.0007 -0.0018–0.0005 Static
Navarre 7.12 6.77 -0.0011 -0.0017–-0.0003 Decreasinga
Balearic Islands 7.11 6.63 -0.0011 -0.0015– -0.0006 Decreasinga
Extremadura 7.16 6.4 -0.0014 -0.0017– -0.0012 Decreasingb
Aragon 7.86 7.14 -0.0015 -0.0023– -0.0007 Decreasinga
Catalonia 6.94 6.22 -0.0015 -0.0019– -0.0011 Decreasingb
Asturias 8.64 7.71 -0.0017 -0.0021– -0.0013 Decreasingb
Spain 7.64 6.83 -0.0017 -0.0020– -0.0014 Decreasingb
Andalusia 7.81 6.9 -0.0018 -0.0021– -0.0015 Decreasingb
Canary Islands 9.21 8.36 -0.0019 -0.003– -0.0006 Decreasinga
Basque Country 7.22 6.46 -0.0019 -0.0028– -0.0008 Decreasinga
Valencia 6.70 5.86 -0.0019 -0.0022– -0.0015 Decreasingb
Galicia 8.99 7.94 -0.002 -0.003– -0.0008 Decreasinga
La Rioja 6.95 5.8 -0.0021 -0.0027– -0.0015 Decreasingb
Madrid 8.64 7.27 -0.0025 -0.003– -0.0021 Decreasingb
Cantabria 8.17 6.84 -0.0026 -0.0033– -0.0019 Decreasingb
Melilla 6.88 5.56 -0.003 -0.0039– -0.0008 Decreasingb
AC: autonomous community; APC: annual percent change a Significance level p < 0.05.
Table 3. Indicator: hospital infection rate in descending order. Spain, 2003–2014.
AC 2003 2014 APC 95%CI Trend
Canary Islands 1.2 1.7 0.0012 0.0003–0.0014 Increasinga
Balearic Islands 1.0 1.5 0.0011 0.0008–0.0014 Increasingb
Galicia 1.1 1.3 0.0008 -0.001–0.0016 Increasinga
Andalusia 1.1 1.5 0.0009 0.0006–0.0013 Increasingb
Valencia 0.6 0.8 0.0006 0.0004–0.0008 Increasingb
Murcia 0.8 0.9 0.0003 0.0001–0.0006 Increasinga
Spain 1.2 1.2 0.0003 0.0002–0.0004 Increasingb
Asturias 1.4 1.4 0.0002 -0.001–0.0015 Static
Catalonia 1.2 1.2 0.0001 -0.0046–0.0009 Static
La Mancha 1.1 1.1 0.0001 -0.0002–0.0004 Static
Basque Country 1.1 1.2 0.0001 -0.0002–0.0004 Static
Madrid 1.4 1.4 < 0.0001 -0.0003–0.0004 Static
Navarre 0.8 0.7 < 0.0001 -0.0003–0.0003 Static
La Rioja 1.2 1.0 -0.0002 -0.0008–0.0004 Static
Ceuta 1.1 0.8 -0.0003 -0.0011–0.0006 Static
Cantabria 2.1 1.9 -0.0004 -0.0008– > -0.0001 Decreasinga
Extremadura 1.0 0.8 -0.0005 -0.0007– -0.0002 Decreasingb
Aragon 1.5 1.2 -0.0006 -0.0008– -0.0004 Decreasingb
Castile and León 1.6 1.3 -0.0006 -0.0838– -0.0399 Decreasingb
Melilla 1.3 0.5 -0.0016 -0.0019– -0.0014 Decreasingb
AC: autonomous community; APC: annual percent change a Significance level p < 0.05.
b Significance level p < 0.001.
Table 4. Indicator: global in-hospital mortality per 100 hospital discharges in descending order. Spain, 2003–2014.
AC 2003 2014 APC 95%CI Trend
La Mancha 4.2 4.7 0.0037 < 0.0001–0.0067 Increasinga
Extremadura 3.8 4.8 0.0029 0.0019–0.0039 Increasingb
Navarre 3.2 4.6 0.0026 0.0008–0.0048 Increasinga
Galicia 4.5 5.3 0.0025 0.0019–0.0031 Increasingb
Canary Islands 3.7 4.8 0.0023 0.0015–0.0033 Increasingb
Andalusia 4.1 4.7 0.0021 0.0018–0.0024 Increasingb
Castile and León 4.1 5.0 0.0018 0.0012–0.0023 Increasingb
Ceuta 3.4 3.7 0.0009 < 0.0001–0.0018 Increasinga
Spain 3.9 4.2 0.0008 0.0006–0.0011 Increasingb
Asturias 4.5 5.2 0.0008 -0.0003–0.0621 Static
Basque Country 3.9 4.0 0.0008 -0.0003–0.0002 Static
Balearic Islands 3.2 3.5 0.0007 0.0003–0.001 Increasinga
Murcia 3.5 3.6 0.0005 -0.0003–0.0015 Static
Valencia 3.9 4.0 0.0004 0.0001–0.0008 Increasinga
Aragon 4.2 4.4 0.0001 -0.0002–0.0005 Static
Catalonia 3.6 3.2 -0.0004 -0.0008–0.0001 Static
Melilla 3.8 4.0 -0.0005 -0.0012–0.0003 Static
Cantabria 5.1 4.7 -0.0006 -0.0012–0.0001 Static
Madrid 4.0 3.9 -0.0006 -0.0064– -0.0002 Decreasinga
La Rioja 3.7 3.3 -0.0007 -0.0012– -0.0002 Decreasinga
AC: autonomous community; APC: annual percent change a Significance level p < 0.05.
healthy living habits and prevent disease is the development of primary care15. his would
avoid unnecessary demand for SC. We observed an increase of 9.5 points in health expenditure on SC between 2003 and 2014 when compared to primary care expenditure, which went
from 13.9% in 2003 to 13.4% in 201411, with a decrease of 0.5 percentage points. hus, it seems
appropriate to analyze whether the increase in the frequency and resources at the SC level presupposes a decrease of resources destined to primary care. his could strengthen the role
of primary care in the SNS to reorient the current centrist hospital approach of the SNS16.
On the other hand, there are many factors that can inluence the increase of these costs, such as the use of resources and clinical variability, the low integration between care levels, the adoption of new technologies, or the increase in aging and less health habits that
require greater care13,17,18. All these factors imply a challenge for the SNS, as the need to put
into operation new health management strategies is evident. Competency management can be one of these strategies, with a greater involvement of professionals, citizens, and administrations to address this problem, since it ensures the sustainability of the health
system in relation to the costs related and adapted to the needs of society19.
he increase in SC expenditure contrasts with key indicators that assess the quality of care, such as the increase in the rate of hospital infections and in-hospital mortality. hese aspects could be related to the inadequate prevention of nosocomial infections, the high workload of professionals, the increase in the number of older patients whose health condition is more severe, or the increase in the multiresistance of some microorganisms. More studies are needed to discern these causes, especially to determine if these infections could be avoided and to
establish measures such as increasing the competence of professionals for their prevention20–23.
Another indicator that measures the situation of the SC and that contrasts with those mentioned previously is the average duration, used to determine the level of hospital eiciency. We veriied a decrease of this indicator in all AC, except Ceuta, La Mancha, Castile and León, and Murcia which show a static trend. his decrease can be justiied by advances
in the diagnosis and treatment of diseases and technological innovations24. he SC improves
when the hospital stay is prolonged, which is a worldwide concern for the negative efects that it entails, such as: increased costs, saturation of services, and decreased quality of care
regarding the risks of adverse events25. However, the rate of nosocomial infections and the
rate of in-hospital mortality in Spain kept increasing trends in the period.
Despite showing an increasing trend in Spain and some AC in the temporary series, the number of professionals in both groups decreased in Spain and in most of the AC in 2012, and it gradually recovered in some cases. his likely comes from the onset of the economic crisis and the consequences of the cuts, which afected each area with diferent intensity and pace of application, increasing inequality and calling into question the cohesion of the public
health system26. In addition, the nurse-patient rate is low when compared to the average of
the countries of the Organization for Economic Co-operation and Development (OECD)27
(5.2 per 1,000 inhabitants compared with the 8.8 recommended by the organization). Spain is the country number 28 of 34, of all OECD countries. However, the physician-patient rate (3.8) is above that recommended by the OECD (3.2).
According to Price Waterhouse Coopers28, not every strategy is valid to ensure the
sustainability of a health system in a context of economic crisis. Measures aimed at reducing expenditure, rather than improving eiciency, should not be adopted without a long-term view of the consequences that may be incurred. Economic cuts and ineicient management increasingly afect professionals and consequently the quality of care, forgetting that the goal
of the SNS is to improve the well-being and satisfaction of users19,29,30.
in SC and it manifests the problems of sustainability and the possibility of improving resource
management31,32. More attention should be given to how money is spent before choosing to
increase the funding of a service. However, the data removed by the AC are missing. herefore,
we cannot relate if this increase is because of those AC that did not increase their resources26.
On the other hand, we need to consider a series of limitations, such as the lack of data
from the AC for some indicators ( for example, surgical waiting lists)26, which require us to
consider this analysis with caution and see it as approximate. Research studies need to be developed with correlated methodological projects that allow the further study on the causes that have led to the decrease of most of the indicators of SC during the studied period. his would allow the establishment of measures to meet the needs of the population, taking into account the criteria of quality of care, equity, and cost-beneit of interventions. A study of interrupted time series of the indicators of the SNS would allow the analysis of the impact of the Royal Decree-Law 16/2012, on urgent measures, to ensure the sustainability of the
SNS and improve the quality and safety of its care8.
he analysis of the evolution of the Key Indicators of the National Health System of SC shows how the principles are not being complied with for the equity and quality of care ofered. he main causes may be increased aging, technological development, and inadequate strategies being taken to reduce health costs without bearing in mind the consequences that can be produced in the medium and long term. Despite the increase in health expenditure on SC, we observed a worsening in key health quality indicators.
REFERENCES
1. Macia Soler ML, Moncho Vasallo J. Sistema Nacional de Salud Español: características y análisis.
Enferm Global. 2007 [cited 2016 Jun 20];6(10):1-14. Available from: http://revistas.um.es/
eglobal/article/view/256/260
2. Jefatura del Estado (ESP). Ley 14/1986, de 25 de abril 1986, General de Sanidad. Bol Oficial
Estado. 29 abr 1986 [cited 2016 Jun 20]. Available from: https://www.boe.es/buscar/pdf/1986/
BOE-A-1986-10499-consolidado.pdf
3. Ministerio de Sanidad, Servicios Sociales e Igualdad (ESP). Sistema Nacional de Salud España 2012. Madrid; 2012 [cited 2016 Jun 21]. Available from: https://www.msssi.gob.es/organizacion/ sns/docs/sns2012/SNS012__Espanol.pdf
4. Sevilla F. La universalidad de la atención sanitaria. Sistema Nacional de Salud y Seguridad Social. Madrid: Ministerio de Trabajo y Asuntos Sociales; 2006 [cited 2016 Jun 21]. Available from: http://www.seg-social.es/prdi00/groups/public/documents/binario/51587.pdf
5. Jefatura del Estado (ESP). Ley 6/2003, de 28 mayo de 2003, de cohesión y calidad del Sistema Nacional de Salud. Bol Oficial Estado. 29 mayo 2003 [cited 2016 Jun 20]. Available from: https://www.boe.es/buscar/pdf/2003/BOE-A-2003-10715-consolidado.pdf
6. Antón Pérez JI, Muñoz de Bustillo Llorente R, Fernández Macías E, Rivera Navarro J. Evaluación del proceso de descentralización del Sistema Nacional de Salud desde la perspectiva de los ciudadanos. Salamanca: Universidad de Salamanca; 2011 [cited 2016 Jun 21]. Available from: http://www. academia.edu/2865536/Evaluaci%C3%B3n_del_proceso_de_descentralizaci%C3%B3n_del_ sistemas_nacional_de_salud_desde_la_perspectiva_de_los_ciudadanos
7. . Sánchez Fernández A. La ley de cohesión y calidad del Sistema Nacional de Salud: nuevo intento de coordinación. Rev Adm Sanit. 2007;5(3):427-33.
8. Jefatura del Estado (ESP). Real Decreto-ley 16/2012, de 20 de abril, de medidas urgentes para garantizar la sostenibilidad del Sistema Nacional de Salud y mejorar la calidad y seguridad.
Bol Oficial Estado. 24 abr 2012 [cited 2016 Jun 20]. Available from: https://www.boe.es/buscar/
pdf/2012/BOE-A-2012-5403-consolidado.pdf
9. Repullo JR. Cambios de regulación y de gobierno de la sanidad. Informe SESPAS 2014. Gac
Sanit. 2014;28 Suppl 1:62-8. https://doi.org/10.1016/j.gaceta.2014.03.008
11. Ministerio de Sanidad, Servicios Sociales e Igualdad (ESP), Subdirección General de Información Sanitaria e Innovación. Indicadores Clave del Sistema Nacional de Salud (INCLASNS). Madrid; s.d. [cited 2016 Jun 21]. Available from: http://inclasns.msssi.es/main.html
12. Antunes JLF, Cardoso MRA. Uso da análise de séries temporais em estudos epidemiológicos.
Epidemiol Serv Salud. 2015;24(3):565-76. https://doi.org/10.5123/S1679-49742015000300024
13. García Goñi M. Análisis descriptivo del gasto sanitario español: evolución, desglose, comparativa internacional y relación con la renta. Madrid: Instituto de Estudios Fiscales de la Universidad Complutense de Madrid; 2006 [cited 2016 Jun 25]. Available from: http://www.ief. es/documentos/recursos/publicaciones/papeles_trabajo/2006_24.pdf
14. Ahn N, Alonso Menseguer J, Herce San Miguel JA. Gasto sanitario y envejecimiento de la población en España. Madrid: Fundación BBVA; 2003 [cited 2016 Jun 26]. (Documentos de Trabajo, 7). Available from: http://www.fbbva.es/TLFU/dat/DT_2003_07.pdf
15. Julio V, Vacarezza M, Álvarez C, Sosa A. Niveles de atención, de prevención y atención primaria de la salud. Arch Med Interna. 2011 [cited 2016 Jun 27];33(1):11-4. Available from: http://www. scielo.edu.uy/pdf/ami/v33n1/v33n1a03.pdf
16. Simó Miñana J. El gasto sanitario en España, 2002-2008: ¿empieza el rescate presupuestario de la atención primaria? Aten Primaria. 2011;44(1):20-9. https://doi.org/10.1016/j.aprim.2011.01.005
17. Clavero Barranquero A, González Álvarez ML. El envejecimiento como causa del incremento de gasto sanitario andaluz. Perspectiva de futuro. In: Anales de economía aplicada. Almeria: Asociación Española de Economía Aplicada; 2003 [cited 2016 Jun 27]. Available from: https:// dialnet.unirioja.es/servlet/articulo?codigo=848145
18. ManuelCordero J, Nuño-Solinís R, Orueta JF, Polo C, Río-Cámara M, Alonso-Morán E.
Evaluación de la eficiencia técnica de la atención primaria pública en el País Vasco, 2010-2013.
Gac Sanit. 2016;30(2):104-9. https://doi.org/10.1016/j.gaceta.2015.11.002
19. Escuela Andaluza de Salud Pública. Junta de Andalucía (sede Web). Campus Universitario de Cartuja, Granada; 2016 [cited 2016 Jul 2]. Available from: http://www.easp.es/wp-content/ uploads/documentos/EASP_El%20futuro%20de%20los%20hospitales.pdf
20. Organización Mundial de la Salud. Informe sobre la salud en el mundo: la financiación de los sistemas de salud: el camino hacia la cobertura universal. Ginebra: OMS; 2010 [cited 2016 Jun 30]. Capítulo 4, Más salud por el dinero; p.67-94. Available from: http://www.who.int/ whr/2010/10_chap04_es.pdf
21. Monge Jodrá V, Figuerola Tejerina MA, Pita López MJ, Gallego Berciano P, Robustillo Rodela A. Foro Sanidad y Derecho. Infecciones aasociadas a la asistencia hospitalaria (HAIS). In; Infección hospitalaria. ¿Negligencia o complicación?; Sésion 11 de abril de 2013. Madrid: Hospital Universitario La Paz; 2013 [cited 2016 Jun 30]. Available from: http://www.madrid.org/cs/Satellit e?blobcol=urldata&blobheader=application%2Fpdf&blobkey=id&blobtable=MungoBlobs&blob where=1352813965091&ssbinary=true
22. Zapatero Gavira A, Barba Martín R, Canora Lebrato JJ, Losa García JE, Plaza Canteli S, Marco Martínez J, et al. Mortalidad en los servicios de medicina interna. Med Clin. 2010;134(1):6-12. https://doi.org/10.1016/j.medcli.2009.04.050
23. López-Aguilera S, Goñi-Yeste M, Barrado L, González-Rodríguez-Salinas MC, Ortero JR, Chaves F. Colonización nasal por Staphylococcus aureus en estudiantes de medicina: importancia en la transmisión hospitalaria. Enferm Infecc Microbiol Clin. 2013;31(8):500-5. https://doi.org/10.1016/j.eimc.2012.12.0055
24. Angulo-Pueyo E, Martínez-Lizaga N, Ridao-López M, García-Armesto S, Bernal-Delgado E. Evolución de las hospitalizaciones potencialmente evitables por condiciones crónicas en España. Gac Sanit. 2016;30(1):52-4. https://doi.org/10.1016/j.gaceta.2015.10.008
25. Ceballos-Acevedo TM, Velásquez-Restrepo PA, Jaén-Posada JS. Duración de la estancia media hospitalaria: metodologías para su intervención. Gerenc Polit. Salud. 2014;13(27):274-95. https://doi.org/10.11144/Javeriana.rgyps13-27.dehm
26. Federación de Asociaciones para la Defensa de la Sanidad Pública. Los servicios sanitarios de las CCAA. Madrid; 2013 [cited 2016 Dec 9]. (Informe, 10). Available from: http://www.isfie.org/ documentos/sccaa.pdf
28. Price Waterhouse Coopers. Diez temas candentes de la Sanidad Española para 2013: para que la crisis económica no se transforme en una crisis de salud pública. Madrid: PWC; 2012 [cited 2016 Jun 27]. Available from: https://www.pwc.es/es/publicaciones/sector-publico/assets/diez-temas-candentes-sanidad-2013.pdf
29. Llop-Gironés A, Tarafa G, Benach J. Personal de enfermería, condiciones de trabajo y su impacto en la salud. Gac Sanit. 2015;29(2):155-6. https://doi.org/10.1016/j.gaceta.2014.10.005
30. Legido-Quigley H, Karanikolos M, Hernandez-Plaza S, Freitas C, Bernardo L, Padilla B, et al. Effects of the financial crisis and Troika austerity measures on health and health care access in Portugal. Health Policy. 2016;120(7):833-9. https://doi.org/10.1016/j.healthpol.2016.04.009 31. Puig-Junoy J. ¿Más recursos para la salud? Barcelona: Elsevier-Masson; 2004.
32. Urbanos-Garrido R. La desigualdad en el acceso a las prestaciones sanitarias: propuestas para lograr la equidad. Gac Sanit. 2016;30 Suppl 1:25-30.
https://doi.org/10.1016/j.gaceta.2016.01.012
Authors’ Contribution: Design and planning of the study: PR, VMGC. Collection, analysis, and interpretation of the data: KNM, VMGC. Preparation of the registry of the study: KNM, PR, VMGC. Approval of the inal version: KNM, PR, VMGC. Public responsibility for the content of the article: KNM, PR, VMGC.