304
Rev Bras Med Esporte _ Vol. 10, Nº 4 – Jul/Ago, 2004 1. Biomechanics Laboratory – EEFD/UFRJ.Received in 3/9/03. 2nd version received in 1/5/04. Approved in 6/5/04. Correspondence to: Rua Maranhão, 305, casa 5 – 20720-230 – Rio de Janeiro, RJ. E-mail: [email protected]; [email protected]
Temporal behavior of motor units action potential
velocity under muscle fatigue conditions
Marco Antonio Cavalcanti Garcia1, José Magalhães1 and Luís Aureliano Imbiriba1
O
RIGINALA
RTICLEKey words: Electromyography. Muscle fatigue. Motor unit action potential veloc-ity.
ENGLISH VERSION
ABSTRACT
Muscle fatigue, which is defined as the failure to maintain a re-quired or expected force, has been investigated in both clinical and sports applications. On the investigation of muscle fatigue effects related to muscular control, surface electromyography (SEMG) has been the most common electrodiagnostic method, because some different parameters can be extracted from the EMG signal. Among the parameters, motor units action potential conduction velocity (MUAPCV) has been one of the most important, in spite of being usually detected through indwelling electrodes. Thus, the aim of this work was to estimate MUAPCV through SEMG, detecting its temporal behavior during isometric contractions until exhaustion. Eighteen students from EEFD/UFRJ (9 men and 9 women – mean age 25.6 ± 6.8 years), right handed, consented to participate on this study. The EMG signals were collected from the right biceps braquii muscle through surface electrodes on 3 different levels of isometric contractions (25%, 50 e 75% of maximum load (ML)), which were divided into 3 periods that would define the beginning (P1), the middle (P2), and the end (P3) of the contraction. MUA-PCV presented a temporal reduction with fatigue installation, show-ing a statistical difference among periods (p < 0.0001), comparshow-ing all the 3 loads. However, it was observed an abrupt decrease of MUAPCV at P3, mainly for 50 and 75% of ML. The results point out that MUAPCV must be quite sensible to pH reduction and chang-es on ionic concentrations, defined by blood supply decreaschang-es. Fur-thermore, the adaptations introduced on SEMG to MUAPCV esti-mation were considered satisfactory, reinforcing this method on electrodiagnostic evaluations.
INTRODUCTION
Muscle fatigue, which is defined as the failure to maintain a re-quired or expected force(1-3), has been investigated in both clinical
and sports applications. To understand the mechanisms involving the muscle contraction and regulation under fatigue conditions is very important as it is unchained by a series of factors such as the type of muscle involved, contraction duration, overload level and type of task performed(3,4).
In the investigation of the fatigue effects on the control stan-dards of the muscle contraction, the electromyography (EMG) has been the most employed electrodiagnostic technique and among the information extracted from the myoelectric signal, the ampli-tude temporal behavior is obtained by its average square root (RMS value) and in the frequency domain, the average frequencies (AF) and median (MF) are obtained with emphasis for the second one in function of its statistic characteristics(5). Besides these variables,
the muscular fibres action potential propagation velocity (MFAPCV) has also allowed the performance of several observations with regard to changes on the sarcolemma permeability in function of
the metabolites accumulation and consequently on its properties in relation to the MUAP propagation(2,6).
In the investigation of the MFAPCV behavior, needle electrodes are introduced into the muscle, an invasive methods that brings higher precision to the monitoring of alteration as result of the fa-tigue process(7-10). However, despite the fact that the invasive
meth-od brings higher methmeth-odological quality to procedure and higher reliability of information collected, needle electrodes also bring high-er discomfort to patients or athletes when applied, highhigh-er costs and the requirement of tests of higher complexity. With the objec-tive of solving such problems, different proposals are presented in literature for the estimation of the motor units action potential con-duction velocity (MUAPCV) through surface electromyography (SEMG), where surface electrodes adapted for such purpose are used(6,11,12). However, it is suggested that these electrodes, defined
from a large number of small bars composed of silver and which dimensions may reach 1 mm of thickness and 5 mm of length, be series-configured and incrusted in plates specially constructed for this task(5).
The main justification with regard to the use of this special type of electrode is defined by a lower noise receiving and a better EMG signal spatial resolution(5,11).
So, the use of regularly commercialized electrodes constructed and adapted for this type of measure is required, what, still, pre-sents high cost, impairing the access to the use of this technique. Despite the non-invasive feature, the SEMG requires a higher computational processing for the estimation of the MFAPCV, once the electrodes will be receiving the algebraic sum of the muscle fibres action potential, thus representing the EMG raw signal(13).
Still, it has been demonstrated through the utilization of electrodes configured for this purpose as previously discussed, the effective-ness on the MUAPCV estimation through SEMG in different appli-cation conditions, except for those that demand dynamic contrac-tions(11).
In this context, the objective of this work was to estimate the motor units action potential conduction velocity (MUAPCV), deter-mining its temporal behavior under different muscle contraction levels until fatigue by means of the application of this technique, in other words, through simple adhesive surface electrodes.
MATERIAL AND METHODS
Eighteen students from the EEFD/UFRJ graduation course vol-unteered for the composition of the sample, being nine males and nine females (25.6 ± 6.8 years of age), right handed with no lesion history of the upper limbs muscle-skeletal system. All volunteers received orientation about procedures to be adopted and signed a consent form to participate in this study (project registered under number 125/03), approved and submitted to the Ethics Commit-tee – HUCFF/UFRJ.
NA-Rev Bras Med Esporte _ Vol. 10, Nº 4 – Jul/Ago, 2004
305
TIONAL INSTRUMENTS, USA) with 12 bits and dynamic range of± 5 V. For signals receiving, a system with cables with amplifier developed in the EEFD/UFRJ Biomechanics Laboratory was used, with frequency range limited between 10 and 500 Hz and total gain of 1000, according to norms of the European Recommenda-tions for Surface Electromyography(5). The signals acquisition and
processing programs as well as the programs developed for the performance of power tests were elaborated in LabVIEW (NATION-AL INSTRUMENTS, USA). Ag-AgCl surface electrodes (Meditrace®
200 – KENDALL, Canada) were used for the acquisition of the EMG signals. The sampling frequency adopted was 2 kHz.
For the performance of the fatigue tests, a mechanical device for the support of the right upper limb was developed and a dyna-mometry system with individual adjustment of height and distance in relation to the right shoulder articulation was used (figure 1). During the performance of the tests, each volunteer remained sit-ting with hip and knee articulation inflected at approximately 90o
and the upper limb positioned according to figure 1.
The experimental protocol was composed of a maximal load test (ML) with duration of 5 s that preceded the signals collecting stage. The percentile loads employed during the fatigue tests were cal-culated from the maximal load reached as follows: 25%, 50% and 75% of the ML. The tests were performed in 3 different days with minimal interval of 48 h. Each test consisted of isometric contrac-tions maintained until exhaustion by means of visual feedback with the aid of a computer monitor (figure 1) for each load employed in random order. The computer monitor remained at a distance of approximately 75 cm from the volunteer, being only adjusted verti-cally.
Before the application of the electrodes, the area was trichoto-mized with razor blade and cleaned with neutral soap. The elec-trodes were applied on the ventral region of the right biceps braquii muscle, according to protocol suggested by Hermens et al.(5).
How-ever, for the calculation of MUAPCV, the protocol was modified for the application of a third electrode. The distance between the ac-romium and the cubital tunnel was measured and the first elec-trode applied at 1/3 from this last one. The other two elecelec-trodes were applied on the line projection between the anatomical points used as reference (figure 2). The reference electrode was applied on the humerus medial epicondylis.
Fig. 1 – Position adopted by subjects during the EMG signal collecting stage. The target load mark and the force level tracing are given in the computer monitor.
Cable
Dynamometer
The acquisition of the power signals and EMG was defined from the beginning of the contraction and interrupted when the force could no longer be maintained in approximately 30% of the prees-tablished load.
Fig. 2 – Simplified scheme of the surface electrodes disposition on the ventral region of the right biceps braquial muscle.
(dois canais)
Acromium
Channel 1
Channel 2
Two-way differential amplifier
Cubital cavity Electrode applied at
1/3 of the distance between points from
the cubital cavity Distance
of 3 cm
For the estimation of the MUAPCV through surface electrodes, the method suggested by Nishizono et al.(11) was used. From the
crossed correlation test between both signals received (channels 1 and 2), obtained from windows of length L, arbitrarily defined as equal to 2000 samples and equivalent to 1 second of signal and identifying the crossed correlation vector element index that present the maximal value of ICmax, it is possible to calculate MUAPCV through equation 1.
MUAPCV = D x SR (1)
VCPAUM = (ICmáx – W) x TA Where,
D is the distance between the electrodes, equal to 3 cm; SR is the sampling rate, equal to 2000 samples/s; W is the window of 2000 samples.
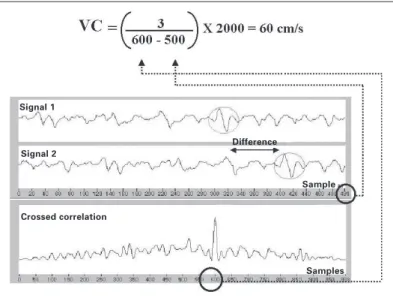
For a better understanding of the procedure adopted, the esti-mation of MUAPCV is presented below (figure 3) through simulat-ed signals and window W of size equal to 500 samples.
306
Rev Bras Med Esporte _ Vol. 10, Nº 4 – Jul/Ago, 2004 contraction, in other words, to the maintenance of the force up to15% below the target load (figure 4). Thus, each test resulted in 3 periods that best represented the initial (P1), intermediate (P2) and final (P3) behaviors of all experiment (figure 4). For the selection of the periods, the following method was adopted: P1 was defined as the 5 initial seconds; P2 defined as the 2 seconds anterior and posterior to the median, also included, from the valid period of the temporal series and P3 defined as the 5 final seconds. Later, the average of each period was calculated and only three reference values of the MUAPCV were verified for each subject for each one of the loads analyzed. In the analysis of data, comparisons between periods (initial (P1), intermediate (P2) and final (P3)) and between loads (25%, 50% and 75% of the ML) were performed through the application of the two-way ANOVA for repeated measures and Tukey’s post-hoc test with significant level (α) equal to 0.05. The analysis of data was performed through the statistical package STATISTICA® 6.0 (StatSoft, USA).
RESULTS
Table 1 presents the average times spent in each load applied in the fatigue tests, reflecting the effort intensity.
Fig. 3 – The difference presented by signals 1 and 2 collected by the pairs of electrodes and of sizes equal to 500 samples (L) is of approximately 100 samples. As the sum of both windows totalizes 1000 samples and the difference is equal to 100, the highest correlation value approximates of the sample of number 600, thus being possible to estimate MUAPCV through the equation 1. The distance between electrodes, adopted for the calculation was of 3 cm and the sampling frequency of 2000 Hz.
Signal 1
Signal 2
Crossed correlation
Difference
Sample
Samples
Fig. 4 – Example of temporal behavior of variables MUAPCV (m/s) and force (kg) of one of the subjects from the sample in periods selected (P1, P2 and P3) from the median during the maintenance of a contraction at 75% of the ML. The periods emphasized of the MUAPCV represent those periods extracted for the statistical analysis. It is observed that the periods were extracted from the signal collected from the force maintained up to 15% below ML (broken line).
MUAPCV (m/s)
Force (kg)
Time (s)
Median of the temporal series
15% below load established
MUAPCV FORCE
TABLE 1
Average results and standard deviation of times spent in the maintenance of contractions in each one of the loads applied
Percentile loads 25% of the ML 50% of the ML 75% of the ML
CMT (average ± SD) 213 s (± 113 s) 91 s (± 55 s) 56 s (± 33 s)
ML = Maximal load; CMT = contraction maintenance time.
When we compare periods P1, P2 and P3 between the different CVM percentile levels, no significant difference was observed for factor “load” (F(2.51) = 0.804; p = 0.45), but observed between peri-ods (F(2.102) = 34.36; p < 0.0001) as well as a significant interaction between these two factors (F(4.102) = 2.63; p = 0.03). The Tukey’s post-hoc analysis showed that when the period P3 was compared between loads, a significant difference between 25% and 50% (p = 0.04) and 25% and 75% (p = 0.01) of the ML was observed, resulting in significant drop of the MUAPCV at the final phases in these loads. This kind of behavior is corroborated by some results found in literature(3,12,15). Some of these works support the idea
that the drop rate of the MUAPCV is determined by the load level (LL) applied and by the contraction maintenance time (CMT) (table 1); important variables in control conditions of the muscle fiber membrane permeability that will influence the propagation of the action potentials(3,16), as already discussed. On the other hand, when
loads of 50% and 75% of the ML were compared in this same period (P3), no significant difference was observed (p > 0.05) (fig-ure 5).
Fig. 5 – Average behavior of the MUAPCV (m/s) between periods (P1, P2 and P3) and between loads (25%, 50% and 75% of the ML) employed during tests.
MUAPCV (m/s)
PERIODS
P1 (INITIAL) P2 (INTERMEDIATE) P3 (FINAL)
DISCUSSION
Rev Bras Med Esporte _ Vol. 10, Nº 4 – Jul/Ago, 2004
307
protocol of the electrodes application, mainly respecting thedis-tance between them.
The decreasing temporal behavior between periods P1, P2 and P3 may be attributed to changes as result of a change on the intra-cellular pH due to the growth of ions H+, what would influence the
functioning of the Na+-K+ pumps and consequently the membrane
permeability of the muscular cell. This process would cause, in turn, an unbalance on the concentration of these ions, leading to a decrease on the MUAPCV(3,16). The literature also emphasize that
the variable CMT would contribute for the installation of the fa-tigue, mainly after half of the total time spent in the task(15), what
could justify the MUAPCV behavior in periods P1 and P2 isolated, where no significant differences were observed between loads (figure 5). In this case, it is supposed that the variable TCM, con-sidering periods P1 and P2, would have been sufficient to modify, only partly and therefore, not significantly, the permeability proper-ties of the muscular fiber membrane.
With regard to the MUAPCV behavior at 50 and 75% of the ML, the results point to a worsening in the condition resulting of pH alterations previously discussed in function of the increase on NC, narrowing the blood flow even more and, therefore, the control of the metabolites growth(17,18). The literature also reinforces the
hy-pothesis that these cascade-type alterations would cause changes on the coupling process between myofilaments due to the inca-pacity of the sarcoplasmic reticule to release ions Ca2+ inside the
muscular fiber, also involving the contractile mechanics, leading to a drop on the force production capacity(17,19).
Another hypothesis establishes that the higher the NC and CMT are, the lower the blood perfusion capacity will be that, up to ap-proximately 30% of the ML is still sufficient to avoid the rapid emergence of an ischemic situation in the tissue. Thus, it still would be possible to establish a balance, even not prolonged, at the intra-cellular pH level(15,20). This theory meets what is observed at 25%
of the ML, where no significant difference was found between periods, presenting no significant temporal drop in MUAPCV. On the other hand, Farina et al.(11), when estimated the MUAPCV of
the anterior tibia muscle, found temporal decline of this variable with the maintenance of the isometric contractions in loads of 25%
of the ML. Thus, it is suggested that the difference would lie on the fact that, despite the utilization of the verbal stimulus, part of the volunteers did not reach CMTs above values reached by some of the volunteers (above 3 minutes and a half), result also reflected in high standard deviation, equal to 113 seconds. It is believed that the high variability in the CMT at 25% of the ML may have oc-curred in function of the position suggested for the performance of tests that, for some volunteers, was defined as uncomfortable and, therefore, interrupted the test for not reaching an exhaustion condition, but rather for the discomfort with regard to the position adopted (figure 1).
Other variable considered as important but not evaluated is the motivation. It is important in the performance of different tasks, especially in long-duration tests and the hypothesis that it has in-fluenced the results found at 25% of the ML is not rejected. Stud-ies involving motivational aspects have been conducted with the objective of better understanding the mechanisms that act on en-durance tasks, similar to those discussed in the present work(2,3).
CONCLUSION
Some works have reported the importance of the MUAPCV as indicative of muscular fatigue when peripheral mechanisms are involved(11) and that it is possible to be measured through surface
electrodes especially developed for this task. In the present work, an adaptation in the use of simple adhesive surface electrodes for the estimation of the MUAPCV was presented. These electrodes demonstrated to be of easy handling, low cost and the results ob-tained in the MUAPCV calculation were in agreement with those found in literature(2,14,21,22). We are convinced that this
methodolo-gy is practical and simple in the evaluation of this variable, impor-tant in the diagnosis and follow-up of pathological or non-patholog-ical processes, which lead muscle to the fatigue condition.
All the authors declared there is not any potential conflict of inter-ests regarding this article.
REFERENCES
1. Dimitrova NA, Dimitrov GV. Interpretation of EMG changes with fatigue: facts, pitfalls, and fallacies. J Electromyogr Kinesiol 2003;13:13-36.
2. Mccomas AJ. Fatigue. In: Skeletal Muscle – Form and function. Human Kinet-ics, 1996.
3. Enoka RM, Stuart DG. Neurobiology of muscle fatigue. J Appl Physiol 1992;72: 1631-48.
4. Latash ML. Fatigue. In: Neurophysiological basis of movement. Human Kinet-ics, 1998.
5. Hermens HJ, Freriks B, Merletti R, Stegeman D, Blok J, Rau G, et al. European Recommendations for Surface Electromyography – SENIAM, n. 8, 1999. 6. Broman H, Bilotto G, De Luca CJ. Myoelectric signal conduction velocity and
spectral parameters: influence of force and time. J Appl Physiol 1985;58:1428-37. 7. Zennaro D, Läubli T, Krebs D, Klipstein A, Krueger H. Continuous, intermitted and sporadic motor unit activity in the trapezius muscle during prolonged com-puter work. J Electromyogr Kinesiol 2003;13:113-24.
8. Zijdewind I, Zwarts MJ, Kernell D. Fatigue-associated changes in the electromyo-gram of the human first dorsal interosseous muscle. Muscle Nerve 1999;22: 1432-6.
9. Gantchev N, Kossev A, Gydikov A, Gerasimenko Y. Relation between the motor units recruitment threshold and their potentials propagation velocity at isomet-ric activity. Electromyogr Clin Neurophysiol 1992;32:221-8.
10. Tokunaga T. Muscle fiber conduction velocity and frequency parameters of sur-face EMG during fatigue of the human masseter muscle. 1. Muscle fiber con-duction velocity. Nippon Hotetsu Shika Gakkai Zasshi 1989;33:696-709. 11. Farina D, Arendt-Nielsen L, Merletti R, Graven-Nielsen T. Assessment of single
motor unit conduction velocity during sustained contractions of the tibialis ante-rior muscle with advanced spike triggered averaging. J Neurosci Methods 2002; 115:1-12.
12. Lowery M, Nolan P, O’Malley MJ. Electromyogram median frequency, spectral compression and muscle fibre conduction velocity during sustained sub-maxi-mal contraction of brachioradialis muscle. J Electromyogr Kinesiol 2002;12:111-8.
13. Masuda T, Sadoyama T, Shiraishi M. Dependence of average muscle fibre con-duction velocity on voluntary contraction force. J Electromyogr Kinesiol 1996;6: 267-76.
14. Nishizono H, Saito Y, Miyashita M. The estimation of conduction velocity in hu-man skeletal muscle in situ with surface electrodes. Electroenceph Clin Neuro-physiol 1979;46:659-64.
15. Christova P, Kossev A, Kristev I, Chichov V. Surface EMG recorded by branched electrodes during sustained muscle activity. J Electromyogr Kinesiol 1999;9:263-76.
16. Fitts RH. Cellular mechanisms of muscle fatigue. Physiol Rev 1994;74:49-74. 17. V∅llestad NK. Measurement of human fatigue. J Neurosci Methods 1997;74:
219-27.
18. Brody LR, Pollock MT, Roy SH, De Luca CJ, Celli B. pH-induced effects on me-dian frequency and conduction velocity of the myoelectric signal. J Appl Physiol 1991;71:1878-85.
19. Murthy G, Hargens AR, Lehman S, Rempel DM. Ischemia causes muscle fa-tigue. J Orthop Res 2001;19;436-40.
20. Seals DR, Enoka RM. Sympathetic activation is associated with increases in EMG during fatiguing exercise. J Appl Physiol 1989;66:88-95.
21. Winter DA. Biomechanics and motor control of human movement. 2nd ed. Ed:
John Wiley & Sons, Inc., 1990.