2 3 2 2 3 22 3 2 2 3 2
2 3 2 Rev Saúde Pública 2003;37(2):232-6
www.fsp.usp.br/rsp
Microbiological quality of drinking water of
urban and rural communities, Brazil
Qualidade microbiológica de água potável de
comunidades urbanas e rurais, Paraná
Giovani Nogueira, Celso V Nakamura, Maria CB Tognim, Benício A Abreu Filho and Benedito P Dias Filho
Departamento de Análises Clínicas da Universidade Estadual de Maringá. Maringá, PR, Brasil
Correspondence to:
Benedito Prado Dias Filho Av. Colombo, 5790
87020-900 Maringá, PR, Brasil E-mail: [email protected]
Supported by grants from the Conselho Nacional de Desenvolvimento Científico e Tecnológico (CNPq- Process n. 350022/2001).
Received in 9/10/2001. Reviewed in 7/10/2002. Approved in 29/11/2002.
Keywords
Water analysis. Water pollution. Water quality control. Water microbiological characteristics. Enterobacteriaceae. Rural zones. Urban zones.
Descritores
Análise da água. Poluição da água. Controle da qualidade da água. Características microbiológicas da água. Enterobacteriaceae. Zonas rurais. Zonas urbanas.
Abstract
Objective
To evaluate the microbiological quality of treated and untreated water samples came from urban and rural communities and to examine the relationship between coliforms occurrence and average water temperature, and a comparison of the rainfall levels.
Methods
A sample of 3,073 untreated and treated (chlorinated) water from taps (1,594), reservoir used to store treated water (1,033), spring water (96) and private well (350) collected for routine testing between 1996 and 1999 was analyzed by the multiple dilution tube methods used to detect the most probable number of total and fecal coliforms. These samples were obtained in the region of Maringá, state of Paraná, Brazil.
Results
The highest numbers water samples contaminated by TC (83%) and FC (48%) were found in the untreated water. TC and FC in samples taken from reservoirs used to store treated water was higher than that from taps midway along distribution lines. Among the treated water samples examined, coliform bacteria were found in 171 of the 1,033 sampling reservoirs.
Conclusions
Insufficient treatment or regrowth is suggested by the observation that more than 17% of these treated potable water contained coliform. TC and FC positive samples appear to be similar and seasonally influenced in treated water. Two different periods must be considered for the occurrence of both TC and FC positive samples: (i) a warm-weather period (September-March) with high percentage of contaminated samples; and (ii) cold-weather period (April-August) were they are lower. Both TC and TF positive samples declined with the decreased of water temperature.
Resumo
Objetivo
Avaliar a qualidade microbiológica de amostras de água tratada e não-tratada proveniente de comunidades urbanas e rurais e examinar a relação entre ocorrência de coliformes e a média de temperatura da água, e uma comparação dos níveis de precipitação de chuva.
Métodos
2 3 3 2 3 3 2 3 3 2 3 3 2 3 3 Rev Saúde Pública 2003;37(2):232-6
www.fsp.usp.br/rsp
Microbiological quality of drinking water
Nogueira G et al
(clorada) e não-tratada pelo método dos tubos múltiplos para determinar o número mais provável de coliformes totais e fecais. Destas, 1.594 provenientes de água de torneiras, 1.033 de reservatório para estocar água tratada, 96 de água de minas e 350 de poços particulares. Tais amostras foram obtidas na região de Maringá, Paraná, Brasil.
Resultados
O maior número de amostras contaminadas por TC (coliformes totais) (83%) e FC (coliformes fecais) (48%) foi observado em água não tratada. O índice de TC e FC foi maior nas amostras de reservatórios do que nas torneiras ao longo de sistema de distribuição. Entre as amostras de água tratada, foram encontradas bactérias do grupo coliforme em 171 dos 1.033 reservatórios amostrados.
Conclusões
A observação de que mais de 17% da água potável tratada contêm coliformes sugere tratamento insuficiente ou recrescimento. Em água tratada, amostras positivas para TC e FC parecem ser similares e sazonalmente influenciadas. Dois diferentes períodos podem ser considerados para a ocorrência de amostras positivas para TC e FC: (i) período quente e úmido (Setembro-Março) com alta percentagem de amostras contaminadas; e (ii) período frio e úmido (Abril-Agosto) onde a positividade é baixa. Amostras positivas para TC e FC diminuem com o decréscimo da temperatura da água.
INTRODUCTION
The contamination of natural water with fecal ma-terial, domestic and industrial sewage and agricul-tural and pasture runoff may result in an increased risk of disease transmission to humans who use those waters.7,12 Diarrheal disease from contaminated water
continues to be a serious problem in developing coun-tries and a lesser, but chronic, problem in developed countries.8
Human pathogenic microorganisms that are trans-mitted by water include bacteria, viruses, and proto-zoa. Most of the microorganisms transmitted by wa-ter usually grow in the human intestinal tract and reach the outside through in the feces. Traditionally, the presence of coliform bacteria in drinking water has been seen as an indicator of fecal contamination through cross connection, inadequate treatment, or an inability to maintain a disinfectant residual in the water distribution system.9 Coliform bacteria are
re-garded as belonging to the genera Escherichia, Citrobacter, Enterobacter, and Klebsiella. Although coliform organisms may not always be directly re-lated to the presence of fecal contamination or patho-gens in drinking water, the coliform test is still useful for monitoring microbial quality of treated piped water supplies.11 Typically, the tests for coliforms come
in two formats, a most-probable-number multiple-tube fermentation based on lactose fermentation with pro-duction of acid and gas within 48 hours and a mem-brane filtration method also based on lactose fermen-tation. If the water sample yields presumptively posi-tive results, confirmation taking an extra 24 to 48 hours of incubation time is required. Fecal coliform
is detected with these same methods, but often by using elevated temperatures and different medium formulations.1
The purpose of this study was to evaluate the micro-biological quality of treated and untreated water sam-ples from sources and points of consumption of ur-ban and rural communities of the northwest of the state of Paraná, Brazil, supplied by different munici-pal water systems. Also, to examine the relationship between coliform occurrence and average water tem-perature, and make a comparison of precipitation data of treated and untreated water. To analyze the sea-sonal variation in coliform occurrence, data from all three years were combined.
METHODS
Between 1996 and 1999, 3,073 untreated and treated (chlorinated)water samples from 1,594 taps located midway along distribution lines 1,033 reser-voirs used to store treated water, 96 spring water and 350 private wells, collected for routine testing, were comparatively studied. All samples were obtained from surrounding communities of the city of Maringá supplied by different municipal water systems. The samples were collected in sterile 250-ml-glass bot-tles containing 0.2 ml of a sterile sodium thiosulfate solution (10%). They were kept at 4°C and analyzed within 24 hours in the laboratory.
2 3 4 2 3 42 3 4 2 3 4
2 3 4 Rev Saúde Pública 2003;37(2):232-6
www.fsp.usp.br/rsp Microbiological quality of drinking water
Nogueira G et al
tryptose broth. If the water sample yielded presump-tively positive results, simultaneous inoculation into brilliant green lactose bile broth for total coliforms and EC broth for fecal coliforms (FC) was required. Positive result for EC broth, incubated at 44.5ºC for
24 hours, was considered as positive completed test response.Parallel positive brilliant green lactose bile broth with negative EC broth cultures indicated the presence of nonfecal coliforms. The number of coliforms per 100 ml of water was then calculated from the distribution of positive and negative tubes in the test by referring to an appropriate table.1
Pres-ence of coliform bacteria is an indication that dis-ease-causing bacteria also may be present and that water is unsafe for drinking.
RESULTS AND DISCUSSION
Testing for evidence of water contamination has been traditionally accomplished by the detection or enumeration of total and fecal coliforms. Coliform bacteria should not be detectable in treated water supplies and, if so, suggest inadequate treatment, in-ability to maintain a disinfectant residual in the wa-ter distribution system, or excessive nutrients.9,11
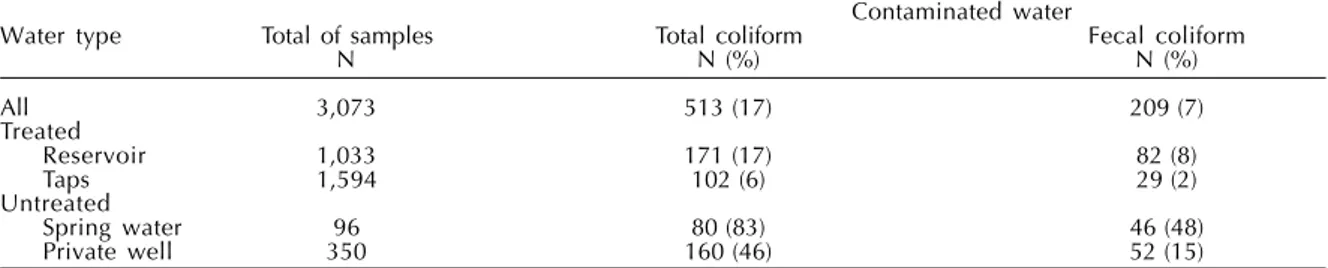
The results of microbiological analyses performed on 3,073 water samples from a wide variety of sources are presented in Table 1. As expected, the highest number of water samples contaminated by TC (83%) and FC (48%) was found in untreated water. The enu-meration of TC (17%) and FC (8%) in samples col-lected from reservoirs used to store treated water was higher than that from taps located midway along dis-tribution lines (6% and 2%, respectively). It was also compared the respective proportions of treated water samples contaminated by TC and FC in residences (16 and 7%) and workplaces (18 and 6%) (Table 2).
Of treated water samples examined, coliform bacte-ria were found in 171 of 1,033 sampling reservoirs. The occurrence of insufficient treatment or regrowth is suggested by the observation that more than 17% of treated drinking water contained coliform. Water reservoirs of workplaces and residences can be sites
where water stagnates, disinfectant residuals dissi-pate, and microbial water quality deteriorates.
The weather in the city of Maringá is classified as CW ‘h type (Köppen classification) and is called tropi-cal with two wet seasons (fall, late spring and early summer) and two dry seasons (winter and early spring). The annual rainfall is about 1,582.2 mm. The annual mean temperature is approximately 22ºC.4
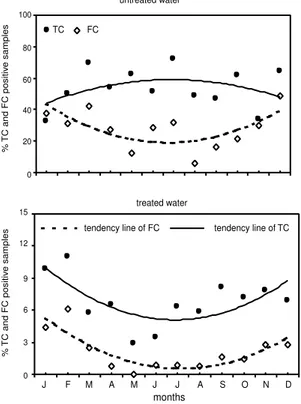
Figure 1 illustrates the average monthly coliform occurrence in untreated and treated water. To analyze the seasonal variation in coliform occurrence, data from all three years were combined. The mean values for both TC and FC positive samples were not associ-ated with any particular month in untreassoci-ated water, but there was a great variety of distribution patterns. Conversely, TC and FC positive samples appear to be similar and seasonally influenced in treated water, with the highest counts seen during the months of September to March and falling from April through August. Data fell into two clearly defined periods, spring and summer (September through March) when counts increased, and fall and winter period (April through August) when counts decreased.
Figure 2 shows the relationship between coliform-positive samples and average water temperatures and a comparison of the precipitation data of treated and un-treated water obtained for routine testing and combined as described above. These results indicate a mixed effect for water temperature and rainfall on coliform occur-rences. In treated water, at least two different periods must be considered for the occurrence of both TC and FC positive samples: (i) a warm-weather period (Sep-tember-March) with high percentage of contaminated samples; and (ii) a cold-weather period (April-August) when they are lower. The number of both TC and FC
Table 2 - Proportions of contaminated water in residences and workplaces.
Indicator bacterium Contaminated water Residences Workplaces
% %
Total coliform 16 18
Fecal coliform 7 6
Table 1 - Detection of coliform bacteria in water samples from sources and points of consumption among urban and rural communities.
Contaminated water
Water type Total of samples Total coliform Fecal coliform
N N (%) N (%)
All 3,073 513 (17) 209 (7)
Treated
Reservoir 1,033 171 (17) 82 (8)
Taps 1,594 102 (6) 29 (2)
Untreated
Spring water 96 80 (83) 46 (48)
2 3 5 2 3 5 2 3 5 2 3 5 2 3 5 Rev Saúde Pública 2003;37(2):232-6
www.fsp.usp.br/rsp
Microbiological quality of drinking water
Nogueira G et al
positive samples decreased with the decline of water temperature. However, in untreated water, a similar pat-tern of behavior within the climatic periods was only observed in FC positive samples. The highest number of TC positive samples was found during the months of May to September with a decrease in coliform occur-rence when water temperature went from 20 to 25oC.
Similar correlation was found between accumulated monthly rainfall and bacteriological parameters.
Foregoing studies have reported that water tempera-ture influenced microbial growth rate, lag phase, and cell yield.5 They have shown that the growth of
Es-cherichia coli and Enterobacter aerogenes was very slow below 20ºC. They have also showed that the lag in the growth phase of Pseudomonas putida was within 3 days at 7.5oC but only 10 hours at 17.5oC.
LeChevallier et al9 (1996) emphasized that the
gen-eralization between water temperature and microbial activity can vary somewhat between systems. Accord-ing to these authors, utilities in cold climates may experience increased microbial activity even at cold water temperature because the microbial populations present in the supply have adapted to growth at low temperature.
Foregoing studies have associated the occurrence
of coliform bacteria in drinking water system with rainfall events.9,10 According to these authors,
rain-fall is a complex variable and may have many differ-ent impacts on drinking water quality: (i) rainfall can be a mechanism that introduces coliform bacteria into the system through leaks and cross-connections and (ii) rainfall can wash dissolved nutrients into the wa-tershed and increase organic carbon levels.
The present study investigated water quality at sources and points of consumptkon of urban and rural communities. Most people of such areas use water directly from available sources, without any treat-ment and therefore are exposed to a variety of water-related diseases. Both spring water and private wells samples obtained for routine testing had high colif-orm-positive samples. Previous studies have shown that a significant percentage of bacteria of fecal ori-gin found in rural wells oriori-ginated from animal ma-nure.3 Furthermore, Gallegos et al6 (1999) studied the
environmental effects of wastewater irrigation of the subsurface at two locations in Mexico. According to these authors, the data obtained showed that: (a) an elevated concentration of fecal and total coliform recorded at both sites indicates that fecal bacteria had been transported through the subsurface, and (b) the level of subsurface contamination was affected
Figure 1 - Seasonal occurrence of total and fecal coliforms positive samples in untreated and treated water. Solid and dashed lines represent tendency lines of total and fecal coliforms, respectively. 100 80 60 40 20 0 15 9 6 3 0 12
J F M A M J J A S O N D
months
tendency line of FC tendency line of TC
%
TC and FC positiv
e samples
%
TC and FC positiv
e samples
untreated water
treated water
TC FC
Figure 2 - Relationship between coliform positive samples and average water temperature and a comparison of the precipitation data of treated and untreated water. Solid and dashed lines represent tendency lines of total or fecal coliforms and water temperature or rainfall level, respectively.
TC water temperature
TC rainfall tendency line tendency line 100 80 60 40 20 0 100 80 60 40 20 0 100 80 60 40 20 0 100 80 60 40 20 0 35 25 15 5 350 250 150 50 35 25 15 5 35 25 15 5 15 12 9 6 3 0 15 12 9 6 3 0 350 250 150 50 35 25 15 5 15 12 9 6 3 0 15 12 9 6 3 0 350 250 150 50 350 250 150 50
J F M A M J J A S O N D
months J F M A M J JmonthsA S O N D
rainf
all le
vel (mm)
% FC positiv
e samples
rainf
all le
vel (mm)
% FC positiv
e samples
% FC positiv
e samples
% FC positiv
e samples rainf all le vel (mm) rainf all le vel (mm) % TC positiv e samples % TC positiv e samples % TC positiv e samples % TC positiv e samples w ater temper ature (ºC) w ater temper ature (ºC) w ater temper ature (ºC) w ater temper ature (ºC)
2 3 6 2 3 62 3 6 2 3 6
2 3 6 Rev Saúde Pública 2003;37(2):232-6
www.fsp.usp.br/rsp Microbiological quality of drinking water
Nogueira G et al
by both spatial and temporal factors with higher col-iform concentrations occurring at shallower depths (<10 m below surface) and at the top of the water table, and during the wet season. They have also dis-cussed the potential effects of groundwater degrada-tion on public health and the need for guidelines to protect groundwater quality.
Arnade2 (1999) tested sixty residential wells in Palm
Bay, Florida, for fecal coliform, nitrates, and phos-phates, to determine whether season has a significant effect on the correlation between these parameters and the proximity of wells to septic tanks. According to this author, ground water samples collected at all distances from septic tanks during the wet season contained twice as many fecal coliforms and higher concentrations of nitrates and phosphates compared with samples collected during the dry season.
Infectious diseases caused by pathogenic bacteria, viruses, protozoa and other parasites are the most com-mon and widespread health risk associated with drink-ing water. Those that pose a serious disease risk when-ever present in drinking water include Salmonella
spp., Shigella spp., pathogenic Escherichia coli, Vi-brio cholerae, Yersinia enterocolitica, Campylobacter jejuni, and Campylobacter coli, the viruses Adeno-viruses, enteroAdeno-viruses, hepatitis A virus, Norwalk vi-rus, Rotavivi-rus, Small round viruses, and the parasites
Giardia spp., Cryptosporidium spp., Entamoeba
histolytica, and Dracunculus medinensis. According to WHO11 (1993) waterborne transmission of these
pathogens have been confirmed by epidemiological studies and case histories. Part of the demonstration of pathogenicity involves reproducing the disease in suitable hosts. Experimental studies of infectivity provide relative information, but it is doubtful whether the infective doses obtained are relevant to natural infections. In Brazil, little or no information on this subject is available.
The present study investigated water quality at sources and points of consumption of urban and rural communities. Most people of such areas use water directly from available sources, without any treat-ment and therefore are exposed to a variety of water-related diseases.
A more extensive study would be a prerequisite to determine chemical, physical, and operational fac-tors that influence the occurrence of coliform bacte-ria either in finished drinking water systems or at sources and points of consumption of rural and peri-urban communities.
ACKNOWLEDGEMENTS
To the staff of “Laboratório de Microbiologia” of the “Unversidade Estadual de Maringá”, Paraná, Bra-zil, for their technical assistance.
REFERENCES
1. American Public Health Association. Standard methods for examination of water and wastewater. 19th ed. Washington (DC); 1995.
2. Arnade LJ. Season correlation of well contamination and septic tank distance. Grnd Wat 1999;37:920-3.
3. Conboy MJ, Gross MJ. Contamination of rural drinking water wells by fecal origin bacteria: survey findings. Water Quality J Can 1999;34:281-303.
4. Deffune G, Delavalentina DJ, Galvani E, Avancini M. Classificação climática e índice de aridez para Maringá-PR, de 1976-1992. Bol Geografia 1994;Suppl 12:3.
5. Fransolet G, Villers G, Masschelein WJ. Influence of temperature on bacterial development in water. Ozone Sci 1985;7:205-27.
6. Gallegos E, Robles E, Campoy E, Sainz MG, Bonilla P, Escolero O. The effects of wastewater irrigation on groundwater quality in mexico. Water Sci Technol 1999;40:45-52.
7. Geldreich EE. Microbial water quality concerns for supply use. Environ Toxicol Water 1991;6:209-23.
8. Grant MA. A new membrane filtration medium for simultaneous detection and enumeration of Escherichia coli and total coliforms. Appl Environ Microbial 1997;63:3326-530.
9. LeChavallier M W, Welch NJ, Smith DB. Full-scale studies of factors related to coliform regrowth in drinking water. Appl Environ Microbial 1996;62:2201-21.
10. Stukel A, Greenberg ER, Dain BJ, Reed FC, Jacobs NJ. A longitudinal study of rainfall and coliform
contamination in small community drinking water supplies. Environ Sci Technol 1990;24:571-5.
11. World Health Organization . Guidelines for drinking-water quality. Geneva; 1993.