Article
J. Braz. Chem. Soc., Vol. 24, No. 9, 1433-1441, 2013. Printed in Brazil - ©2013 Sociedade Brasileira de Química 0103 - 5053 $6.00+0.00
A
*e-mail: mssqam@iq.unesp.br, maryrmarchi@gmail.com
UV Filters in Water Samples: Experimental Design on the SPE Optimization
followed by GC-MS/MS Analysis
Claudia P. da Silva, Elissandro S. Emídio and Mary R. R. de Marchi*
Department of Analytical Chemistry, Institute of Chemistry, São Paulo State University (UNESP), 14801-970 Araraquara-SP, Brazil
Esse estudo descreve o desenvolvimento e otimização de um método de extração em fase solida (SPE) para análise dos filtros ultravioletas (UV): benzofenona-3 (BP-3), etilhexil salicilato (ES), etilhexil metoxinamato (EHMC) e octocrileno (OC) em matrizes ambientais. Um planejamento fatorial fracionário (PFF) 25-1 foi empregado na avaliação das variáveis significativas do método
de extração. As condições experimentais otimizadas da avaliação estatística foram: capacidade do cartucho de 500 mL, eluente acetato de etila, metanol como solvente de lavagem (10% em água, v/v) and volume do eluente de 3 × 2 mL e pH 3. Os parâmetros analíticos avaliados foram satisfatórios, apresentando linearidade de 100 a 4000 ng L-1, recuperações para os quatro níveis de
fortificação (Limite de Quantificação do Método, 200, 1000 e 2000 ng L-1) entre 62 e 107% com
desvio padrão relativo menor que 14%. Os limites de quantificação foram encontrados na faixa de ng L-1, variando entre 10 e 100 ng L-1. O método proposto foi aplicado para a determinação
dos quatro filtros UV em amostras de águas naturais.
This study describes the development and optimization of a solid-phase extraction (SPE) method for analysis of ultraviolet (UV) filters, benzophenone-3 (BP-3), ethylhexyl methoxycinnamate (EHMC), ethylhexyl salicylate (ES) and octocrylene (OC), in environmental matrices. A 25-1
fractional factorial design (FFD) was used to evaluate the significant variables for the extraction method. The optimized experimental conditions determined from the statistical evaluation were: breakthrough volume of 500 mL, eluent of ethyl acetate, wash solvent of methanol (10% in water, v/v), eluent volume of 3 × 2 mL and pH 3. The evaluated analytical parameters were satisfactory for the analytes and showed linearity between 100 and 4000 ng L-1, recoveries for four fortification
levels (Method Quantification Limit, 200, 1000 and 2000 ng L-1) were between 62 and 107% with
relative standard deviations less than 14%. Limits of quantification were in the ng L-1 range and
were between 10 and 100 ng L-1. The proposed method was used to analyze four UV filters in
natural water samples.
Keywords: UV filters, solid-phase extraction, experimental design, GC-MS/MS
Introduction
UV filters belong to a new class of organic pollutants called emerging contaminants. The presence of UV filters in the environment has recently become an important issue on the world stage. The recent attention is because UV filters have the ability to interact with estrogen receptors and, subsequently, the endocrine systems of humans and animals.1
UV filters are effective in reducing solar radiation effects, especially skin cancer, so these compounds are not only added to sunscreen products but are also included in formulations of many everyday products, such as skin creams, body lotions, sprays, hair dyes, shampoo and many
others. Although the maximum concentration levels (0.5 to 10%, reaching 25% in some countries) are regulated for each given UV filter, the amounts added to personal care products (PCPs) become high because more than one type of UV filter is needed in the formulations to obtain a high sun protection factor (SPF).2
An aggravating factor for the large presence of UV filters in the environment is that they are reported to be potential endocrine disruptors.3 Although the maximum
concentrations of UV filters in PCPs are regulated in different parts of the world,4-6 in the environment, currently
there is no normative guideline in the world or, specifically, in Brazil.
Given the lack of environmental regulations regarding UV filters, the evidence of their interference with the normal endocrine system function, their growing use in everyday products and the consequent inflow of large amounts of these substances into the environment, the interest in monitoring UV filters in different environmental compartments by sensitive analytical techniques has greatly increased.
Regarding environmental matrices, the analytical methods used to detect and quantify UV filters are generally restricted to chromatographic techniques, such as gas chromatography (GC), liquid chromatography (LC) coupled with mass spectrometry (MS) and tandem MS (MS-MS).7-9 However, before introducing the sample into
the chromatographic system, a pretreatment procedure (clean-up and/or concentration of the analyte) should be used to improve the detectability of the compounds of interest.
Traditional sample preparation methods, such as liquid-liquid extraction (LLE), are still used.10 However,
a common trend is to reduce the consumption of organic solvents in extraction techniques, thus LLE has been used less often.11 The solid-phase extraction (SPE) technique has
the advantages of consuming less time and less solvent and is being developed and/or improved for effective application to the extraction of UV filters in aqueous samples.12,13
Recently, miniaturized techniques have become very attractive; for example, solid-phase microextraction (SPME),14 sorptive extraction on a magnetic stir bar
(SBSE)15 and dispersive liquid-liquid microextraction
(DLLME)7 have been used to analyze UV filters. However,
the variety of commercial material polarities for some of these techniques is limited.12 Thus, solid-phase
extraction (SPE), with its variety of sorbents, is still the extraction technique chosen by many researchers for the extraction and preconcentration of UV filters in aqueous samples.13,16-18
Many statistical methods have been developed to optimize the parameters of interest. Among them, experimental design (ED) can be used as a tool in the optimization of the SPE procedure. The use of ED can save time and resources, and with a few experiments, one can identify the variables that are significant for the extraction of the UV filters and can also determine possible interactions
between variables. In a second step, other experiments can maximize the values of significant variables to find the best configuration of the factors involved, which thus results in higher analyte recovery.19
Before starting the optimization process, it is important to list all the variables needed to describe the system under study, to identify those variables that are most crucial for obtaining the best response20 and to adjust the variables to
obtain recoveries between 70 and 120%.21
Once identified, the variables that potentially affect the response (peak area) of the chromatographic system are used to optimize the SPE procedure. Although univariate optimization is the most commonly used approach in analytical chemistry,22 in this work, we consider
all the selected factors simultaneously (multivariate optimization). This multivariate approach is faster and simpler, and it leads to more reliable conclusions because the variables in question may not be fully independent and can be evaluated simultaneously to consider the possible synergistic effects.
This work presents a method for the analysis of four UV filters, benzophenone-3 (BP-3), ethylhexyl methoxycinnamate (EHMC), ethylhexyl salicylate (ES) and octocrylene (OC), in aqueous samples using SPE and GC-MS/MS. The extraction efficiency by SPE can be affected by certain parameters, such as breakthrough volume, type and volume of eluent, methanol proportion in the washing solvent and pH. These effects were studied and simultaneously optimized using multifactorial design to obtain a satisfactory chromatography response. The developed method was applied for the first time to the analysis of UV filters in water samples from a water treatment plant located in Araraquara city (SP, Brazil).
Experimental
Reagents, standards and samples
Standard solutions of the individual UV filters were prepared in ethyl acetate at 1000 mg L-1 and then diluted
with ethyl acetate to a concentration of 5 mg L-1. These
solutions were stored in the dark at −20 °C. Concentrations of 1-2000 µg L-1 were obtained by dilution (v/v) of the stock
solution. These solutions were used to prepare the analytical curves and to optimize the extraction. The optimization of the SPE procedure was performed using treated water samples (without chlorination) obtained from the water treatment plant and with an additional concentration of 200 ng L-1.
Sample collection
Water samples were collected in October 2012 and March 2013 at the Water Treatment Plant (WTP) in Araraquara city (SP, Brazil), before and after treatment. All the samples were collected in 4 L capacity amber Pyrex borosilicate glass bottles with screw caps. After
collection, the samples were transported to the laboratory under refrigeration at 4 ºC (ice packs) and were protected from light. In the laboratory, prior to extraction, the samples were filtered through a glass fiber filter (Macherey-Nagel GF3) with a 0.6 µm pore size.
Solid-phase extraction (SPE) procedure
The SPE cartridges (200 mg / 6 mL, Strata X from Phenomenex, Torrance, USA) were conditioned in batches, first with 5 mL of the solvent used as the eluent, then with 5 mL of methanol and then with 5 mL of deionized water. After conditioning, 500 mL of sample at pH 3 were added at a flow rate of approximately 10 mL min-1, and then,
50 mL of a 5% MeOH/water solution were used to remove any possible analytes retained on the glassware. Next, the cartridge was kept under vacuum for 5 min, and 500 µL of MeOH were added to facilitate drying. The analytes
Table 1. Analytes, abbreviations, CAS registry numbers, chemical structures, molecular weights, log Kow and pKa values for the UV filters included in
this work23-24
Analyte (abbreviations), CAS Number Chemical structure Molecular weight /
(g mol-1) log Kow pKa
Benzophenone-3 (BP-3), 131-57-7 228.24 3.79 7.56
Ethylhexyl methoxycinnamate (EHMC), 5466-77-3 290.40 5.80 –
Ethylhexyl salicylate (ES), 118-60-5 250.33 5.97 8.13
Octocrylene (OC), 6197-30-4 361.49 6.88 –
Benzyl cinnamatea (BC), 103-41-3 238.28 4.06 –
Benzophenone-d10b (BP-d
10), 22583-75-1 192.28 3.18 –
were eluted with 6 mL (3 × 2 mL) of ethyl acetate. Then, 500 µL of the internal standard solution of 100 µg L-1
benzyl cinnamate were added to the eluate. The volume of the eluate was reduced to 1 mL under a gentle flow of nitrogen gas, and the eluate was finally transferred to an appropriate vial and analyzed by GC-MS/MS.
GC-MS/MS analysis
The analytes were analyzed by GC-MS/MS using a gas chromatograph (Varian, Walnut Creek, CA, USA) coupled to an ion trap mass spectrometer (Saturn 2000) and equipped with injector model 1079 (split/splitless). The chromatograms were recorded and processed using Star Workstation software 6.9.2 (Varian, USA). The chromatographic conditions were as follows: helium as the carrier gas (maintained at a constant flow rate of 1.2 mL min-1); an injector temperature maintained at 300 °C,
operating in splitless injection mode with a sampling time of 1 min; and a fused silica capillary column (30 m length, 0.25 mm i.d. and 0.25 µm film thickness) ZB-5 Msi
(Phenomenex, Torrance, USA) used for the separation. The column temperature was programmed to be 60 °C for 1 min, then increased from 60 to 160 °C at 25 °C min-1
(hold for 1 min) and again increased from 160 to 300 °C at 10 °C min-1. Finally, the temperature was held at 300 °C for
5 min. The transfer line, trap and manifold temperatures were maintained at 300, 50 and 220 °C, respectively. The total run time was 22.0 min. The mass spectra were acquired by electron ionization at 70 eV over a mass range scanned from 40 to 400 m/z. The spectral base peak for each compound was isolated within a 3 Da window and was subjected to collision-induced dissociation (CID).
Experimental design and statistical tools
Multivariate optimization of the SPE procedure was performed in two steps. First, the potentially significant selected factors were studied by fractional factorial design (FFD), in which a subset of all possible combinations was performed (Table 2). Second, only significant variables were studied.
Table 2. Variables, levels and design matrix of the 25-1 fractional factorial design (FFD) used to optimize the SPE procedure
Variable Level
Low (−1) Central (0) High (+1)
pH 2 4 6
Breakthrough volume / mL 200 350 500
Eluent type AcOEt AcOEt/n-hexane 75/25% AcOEt/n-hexane 50/50%
Eluent volume 3 × 2 mL 3 × 4 mL 3 × 6 mL
Methanol / % (washing step) no methanol added 5 10
Run
Variable
pH Breakthrough volume /mL
Eluent volume
Eluent type
Methanol (washing step)
6 −1 +1 −1 +1 +1
11 +1 −1 +1 −1 +1
5 −1 +1 −1 −1 −1
14 +1 +1 −1 +1 −1
19 (C) 0 0 0 0 0
1 −1 −1 −1 −1 +1
18 (C) 0 0 0 0 0
2 −1 −1 −1 +1 −1
12 +1 −1 +1 +1 −1
3 −1 −1 +1 −1 −1
13 +1 +1 −1 −1 +1
15 +1 +1 +1 −1 −1
8 −1 +1 +1 +1 −1
9 +1 −1 −1 −1 −1
17 (C) 0 0 0 0 0
4 −1 −1 +1 +1 +1
10 +1 −1 −1 +1 +1
7 −1 +1 +1 −1 +1
16 +1 +1 +1 +1 +1
Several factors may affect the extraction process, such as pH, breakthrough volume, eluent volume, eluent type and composition of the wash solvent. Fractional factorial design (25-1) was used to screen the variables,
thereby defining the significant experimental variables for SPE of the UV filters from the water samples. The levels at which the studies were conducted and the order in which the experiments were performed (random order) are listed in Table 2. The experimental design and data analysis were performed using the STATISTICA® software package
(version 7.0 StatSoft, Tulsa, USA).
Results and Discussion
GC-MS/MS development method
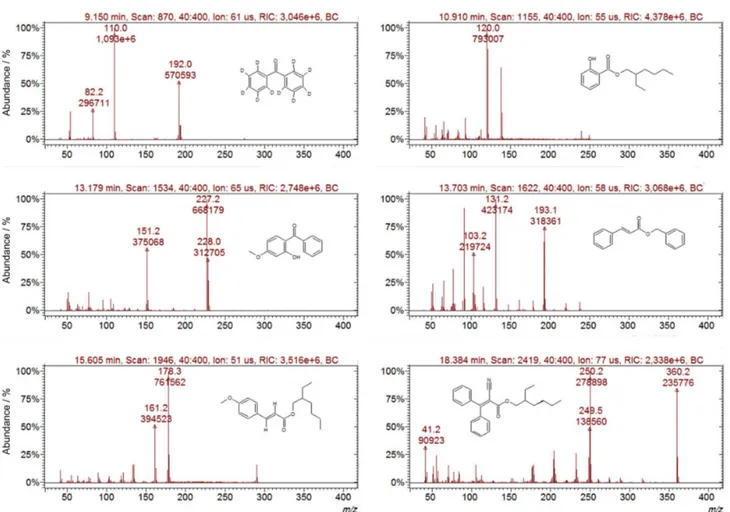
Initially, the chromatographic conditions were optimized for better separation of the analytes with minimum analysis time. Thus, using these optimized analytical conditions, each compound was individually analyzed in scan mode (full scan) to determine its ionization conditions. In these experiments, the retention time of each analyte and its
respective spectrum (Figure 1) were obtained. From these spectra, the precursor ion was selected for each of the analytes to be fragmented. The precursor ion was chosen as a compromise between selectivity (highest m/z) and detectability (high intensity).25
Once the precursor ions were selected, they were fragmented with the resonant excitation mode to generate multiple ion spectra with high relative intensities to assure accurate quantification, and a certain proportion (between 5 and 15%) of the precursor ions was preserved.25,26 The
selection was achieved with the excitation amplitude voltage. The optimized values for the excitation amplitude and the other MS/MS parameters are shown in Table 3. These MS/MS dissociation conditions for the selected precursor ions were optimized with the Automated Method Development (AMD) option included in the Star Workstation software. AMD uses up to ten different collision-induced dissociation (CID) voltages for the same precursor ion, obtaining an optimization relatively quickly.
Using parameters optimized for each MS-segment, ion chromatograms in multiple reaction monitoring (MRM)
mode of the four UV filters, the surrogate and the internal standard were obtained and are presented in Figure 2.
Experimental variables involved in the SPE procedure
Factorial design is a very useful tool to determine optimal experimental conditions and to obtain more detailed information about the relationships among the factors studied.27 FFD with a resolution of V (25-1) was
performed to evaluate the solid-phase extraction parameters. Five variables were studied at two levels (low and high levels), and three central points were included to estimate the experimental variance and to check for loss of linearity between the levels chosen for each variable. FFD resulted in a total of 19 randomized trials, which were performed in a single day. The variables and their high and low levels were chosen according to preliminary experiments. After the experiments, the recoveries were calculated for each analyte in each run. The factorial design was evaluated from the normalized recovery responses (Rn) obtained in each of
the 19 FFD experiments (results provided in Table 4). The responses were calculated with equation 1:28
(1)
where x is the analyte identity (BP-10, ES, BP-3, EHMC and OC), Rx is the recovery obtained for compound
x, and Rx(max) is the maximum recovery for compound x in
all 19 FFD experiments.
An ANOVA (analysis of variance) test was used to evaluate the data and to determine the statistically significant first- and second-order effects. The normalized responses of the experimental design were evaluated using a t-test with a 5% significance and were analyzed with a Pareto chart (Figure 3). The size of each bar is proportional to the estimated variable effect or its interactions. The vertical dashed line corresponds to a statistical significance at the 95% confidence level. The horizontal bars that exceed the vertical dashed line correspond to those variables that
Table 3. Optimized conditions for dual fragmentation analysis by GC-MS/MS
Analyte Segment time /
min m/z range m/z, precursor ion
m/z, excitation storage level
Excitation amplitude / V
m/z, product ionsc
BP-10a 8-10 158-193 192.0 84.5 1.10 162.1; 190.1
ES 10-12 91-121 120.0 52.7 0.60 91.9;121.0
BP-3 12-13.5 181-228 227.2 100.0 0.85 184.0; 212.0
BCb 13.5-14 75-194 193.1 85.0 0.40 114.9; 192.0
EHMC(Z) 14-15
120-179 178.3 78.3 0.70 121.0; 132.9; 160.8
EHMC(E) 15-17
OC 17-19 247-251 250.2 110.2 0.76 248.1; 249.1
aSurrogate; binternal standard; cbold letters: ions used for quantification.
Figure 2. SPE and GC-MS/MS ion chromatogram in MRM mode of the analysis of WTP spiked at 10, 100, 10, 50 and 50 ng L−1 to BP10 (m/z 190.1), ES
were significant in the procedure.29 As depicted in the
Pareto chart, pH was the only significant variable. The other variables and their interactions were not significant in the process. These other variables were thus kept constant in the second step of optimization. For the breakthrough volume, 500 mL were chosen because it enabled a greater
sample volume to be introduced into the cartridge without leading to saturation of the sorbent or affecting the retention of the analytes. Ethyl acetate and 10% methanol/water were chosen as the eluent and solvent washes, respectively. The 10% methanol/water was used to remove possible matrix interference. A low eluent volume was used to save time and reduce organic solvent costs.
The second study focused on optimizing the pH to obtain the best response. Experiments were performed at pH values of 3, 4, 5, 6, 7, 8 and 9. Because the other variables were not significant, they were kept constant during the pH study as follows: a breakthrough volume of 500 mL, AcOEt eluent and a 10% MeOH wash solvent. Although the effect of the eluent volume has a positive influence, suggesting that a high value is optimal, the low value (3 × 2 mL) was used. This volume was chosen because it had a very negligible effect (Figure 3) on the SPE procedure, saved time and reduced unnecessary solvent expenses. The pH results are shown in Table 5. The pH value of 3 showed the best recovery for all the analytes mostly because, at higher pH values, the molecules are ionized, and thus, their interaction with the solid-phase is impaired. At acidic pH values, which lower the ionic charge, the best recoveries are obtained.30
Table 5 also shows that the last two analytes (EHMC and OC) still do not have satisfactory recoveries. The hypothesis that these analytes are more lipophilic and were being adsorbed on the 500 mL glass bottles connected to the cartridges (used as reservoirs of the sample) was tested. For this test, after sample passage, the reservoirs were washed with 50 mL of 5% (v/v) MeOH in deionized water.13 The recoveries obtained were 103,
67, 110, 70 and 68% for BP-10, ES, BP-3, EHMC and OC, respectively, with the additional step of washing the glassware. These results showed that the recoveries for EHMC and OC increased without impairing the recoveries of the more polar analytes.
Table 4. The recoveries obtained for the UV filters after each SPE test of FFD compared with the normalized responses obtained for each experiment
Run Recovery / % Normalized
responsea
BP-10 ES BP-3 EHMC OC
1 128 85 4 29 35 3.1
2 100 42 2 16 27 2.0
3 123 62 4 24 46 2.9
4 109 66 20 18 38 2.8
5 110 54 5 26 37 2.6
6 100 48 3 25 35 2.4
7 101 75 29 25 32 2.9
8 101 64 4 17 56 2.9
9 98 36 75 22 23 2.7
10 96 55 65 30 25 2.9
11 105 68 5 38 45 3.1
12 91 47 3 32 30 2.3
13 123 72 101 57 40 4.4
14 116 66 5 63 50 3.6
15 102 61 90 33 37 3.6
16 99 73 76 34 40 3.6
17 C 98 42 4 33 27 2.3
18 C 91 66 5 37 32 2.7
19 C 103 71 47 12 30 2.8
aNormalized responses obtained using equation 1.
Figure 3. Pareto chart of the standardized effects for the variables examined by the fractional factorial design.
Table 5. Recoveries for the pH values studied in the extraction optimization
pH Recovery / %
BP-10 ES BP-3 EHMC OC
3 113 74 105 53 51
4 96 60 106 51 44
5 108 61 118 62 45
6 100 62 118 54 48
7 102 53 115 37 30
8 104 40 9 42 41
Table 6. Ranges of the linear regression parameters for the calibration curves, limits of detection LOD and of quantification (LOQ), average recoveries and coefficients of variation (CV) for n = 3
Analyte
Linear range / (ng L-1)
aa bb rc LOD /
(ng L-1)
LOQ / (ng L-1)
Recovery / % LOQ / (ng L-1)
(CV / %)
200 ng L-1
(CV / %)
1000 ng L-1
(CV / %)
2000 ng L-1
(CV / %)
BP-10 10-4000 0.0152 0.08820 0.9915 2 10 107(11) 96(3) 98(3) 105(10)
ES 100-4000 0.0453 0.00005 0.9907 2 100 77(10) 72(5) 72(5) 69(5)
BP-3 10-4000 0.0381 0.19252 0.9919 2 10 91(12) 85(3) 95(4) 94(4)
EHMC 50-4000 0.0364 0.01212 0.9956 2 50 85(7) 76(5) 74(5) 65(10)
OC 50-4000 0.0219 0.03896 0.9951 2 50 62(13) 76(5) 70(5) 63(14)
aa: slope; bb: y-axis intercept; cr: correlation coefficient.
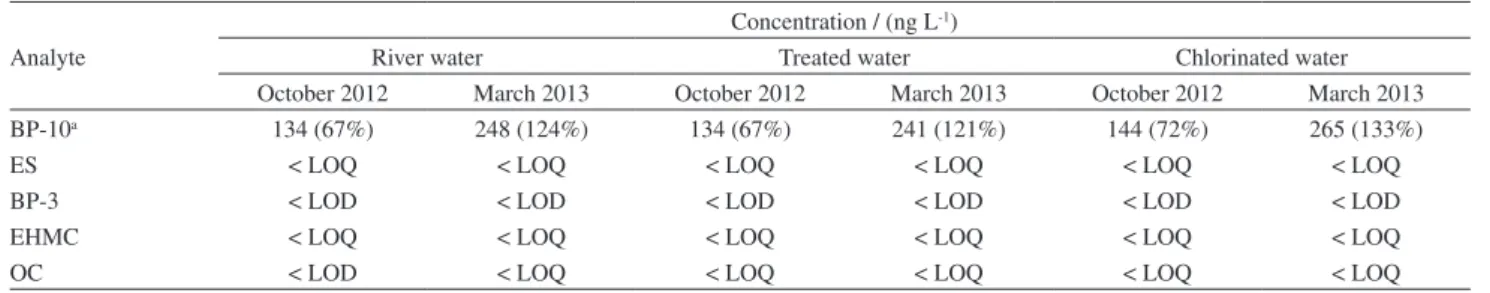
Table 7. Concentration of UV filters in natural and treated water. BP-10a used as surrogate, RSD (%) in the brackets (n = 3)
Analyte
Concentration / (ng L-1)
River water Treated water Chlorinated water
October 2012 March 2013 October 2012 March 2013 October 2012 March 2013
BP-10a 134 (67%) 248 (124%) 134 (67%) 241 (121%) 144 (72%) 265 (133%)
ES < LOQ < LOQ < LOQ < LOQ < LOQ < LOQ
BP-3 < LOD < LOD < LOD < LOD < LOD < LOD
EHMC < LOQ < LOQ < LOQ < LOQ < LOQ < LOQ
OC < LOD < LOQ < LOQ < LOQ < LOQ < LOQ
aBP-10 at 200 ng L-1.
Analytical parameters
Under the above-mentioned optimal conditions, quality factors include the linear calibration range, precision, accuracy, limits of detection and of quantification. The matrix-matched calibration curves were measured using standard solutions prepared in water from the WTP (treated water without chlorination) with concentrations (in sample) between 2 and 4000 ng L-1.
Table 6 shows the linear ranges, the regression parameters for the analytical curves, the limits of detection (LOD) and of quantification (LOQ) obtained for the proposed method. Table 6 also shows the recovery values and their variation coefficients for the four fortification levels: low LOQ of each UV filter (in 8th column of Table 6), medium (200 and
1000 ng L-1) and high (2000 ng L-1).31
The LOD and LOQ values shown in Table 6 were obtained visually from the linearity of the graphs (not shown) from 2 to 4000 ng L-1.32 The LOD and LOQ values
obtained in this study are comparable to and sometimes better than those obtained in previous studies in which the extraction was performed by SPME,14 DLLME,7 SBSE3
or SPE.16
Table 6 also shows that the retrieved values decrease with increasing levels of fortification of EHMC and OC. This decrease is most likely because at higher concentrations of these analytes, there is greater interaction with the glassware; therefore, losses are greater.
Analysis of the UV filters in water
Water samples were collected (October 2012 and March 2013) in Araraquara city, Brazil (WTP). Three points of sampling were performed: at the entrance, before any treatment (river water), after treatment without chlorination (treated water) and after chlorination (chlorinated water). The samples were analyzed by SPE and GC-MS/MS, and the results are shown in Table 7.
The low levels do not indicate that these substances are not present in the environment because only water was analyzed, and furthermore, the analyses were performed at a time when there was likely minimal sunscreen usage.
Additionally, the capability for rapid accumulation, the temporal effects of environmentally relevant concentrations and the potential mixing effects indicate the need for further studies to evaluate the occurrence and the fate of UV filters. In addition, even in very low concentrations, long-term exposure can have a negative effect.4
Conclusions
SPE combined with GC-MS/MS is a valuable tool for the analysis of UV filters in aqueous samples at levels of ng L-1 to low µg L-1. This method is innovative because
the SPE method for UV filters in water. This combination of SPE, GC-MS/MS and multivariate optimization proved to be advantageous because the application of fractional factorial design provided a simple and rapid method. Because only a few experiments are needed to optimize the extraction procedure, multivariate optimization may lead to more reliable conclusions compared with univariate optimization.
The fractional factorial design for extraction optimization coupled with the high sensitivity and selectivity inherent in GC-MS/MS enabled efficient quantification of the UV filters, with recoveries between 62 and 107% for the four fortification levels and a repeatability of 3 to 14%. The other analytical performance parameters for this method, such as the linearity, LOD and LOQ, also highlight the potential for analysis of UV filters in aqueous samples at trace levels.
Acknowledgements
The authors are grateful for a research studentship from CAPES (Brazilian Federal Agency for Support and Evaluation of Graduate Education) and financial support from FACTE (Fundação de Apoio a Ciência, Tecnologia e Educação).
References
1. Kunz, P. Y.; Fent, K.; Aquat. Toxicol.2006, 79, 305.
2. Fent, K.; Zenker, A.; Rapp, M.; Environ. Pollut. 2010, 158, 1817.
3. Magi, E.; Di Carro, M.; Scapolla, C.; Nguyen, K. T. N.;
Chromatographia2012, 75, 973.
4. Díaz-Cruz, M. S.; Barcelo, D.; TrAC: Trends Anal. Chem. 2009,
28, 708.
5. www.jusbrasil.com.br/diarios/499689/dou-secao-1-17 accessed in April 2013.
6. Tuchinda, C.; Lim, H. W.; Osterwalder, U.; Rougier, A.;
Dermatol. Clin. 2006, 24, 105.
7. Tarazona, I.; Chisvert, A.; León, Z.; Salvador, A.;
J. Chromatogr., A2010, 1217, 4771.
8. Zhang, P.-P.; Shi, Z.-G.; Yu, Q.-W.; Feng, Y.-Q.; Talanta2011,
83, 1711.
9. Nguyen, K. T. N.; Scapolla, C.; Di Carro, M.; Magi, E.; Talanta
2011, 85, 2375.
10. Jeon, H.; Chung, Y.; Ryu, J.; J. Chromatogr,. A2006, 1131, 192. 11. Caldas, S. S.; Gonçalves, F. F.; Primel, E. G.; Prestes, O. D.;
Martins, M. L.; Zanella, R.; Quim. Nova.2011, 34, 1604. 12. Pedrouzo, M.; Borrull, F.; Marcé, R. M.; Pocurull, E.; TrAC:
Trends Anal. Chem.2011, 30, 749.
13. Liu, Y.-S.; Ying, G.-G.; Shareefb, A.; Kookana, R. S.;
J. Chromatogr., A2011, 1218, 5328.
14. Liu, H.; Liu, L.; Xiong, Y.; Yang, X.; Luan, T.; J. Chromatogr., A
2010, 1217, 6747.
15. Rodil, R.; Moeder, M.; Anal. Chim. Acta2008, 612, 152. 16. Cuderman, P.; Heath, E.; Anal. Bioanal. Chem.2007, 387, 1343. 17. R o d i l , R . ; Q u i n t a n a , J . B . ; L ó p e z - M a h í a , P. ;
Muniategui-Lorenzo, S.; Prada-Rodríguez, D.; Anal. Chem.
2008, 80, 1307.
18. Pedrouzo, M.; Borrull, F.; Marcé, R. M.; Pocurull, E.;
J. Chromatogr., A2009, 1216, 6994.
19. Passeport, E.; Guenne, A.; Culhaoglu, T.; Moreau, S.; Bouyé, J.; Tournebize, J.; J. Chromatogr., A2010, 1217, 5317.
20. Barmpalexis, P.; Kanazeb, F. I.; Georgarakisa, E.; J. Pharm. Biomed. Anal. 2009, 49, 1192.
21. http://chemkeys.com/br/2000/03/18/metodos-de-otimizacao-em-quimica, accessed in May 2013
22. Ferreirós, N.; Iriarte, G.; Alonso, R. M.; Jiménez, R. M.; Talanta
2006, 69, 747.
23. Rodil, R.; Schrader, S.; Moeder, M.; J. Chromatogr., A2009,
1216, 4887.
24. Zenker, A.; Schmutz, H.; Fent, K.; J. Chromatogr., A2008,
1202, 64.
25. Frias, M. M.; Frenich, A. G.; Vidal, J. L. M.; Sánchez, M. M.; Olea, F.; Olea, N.; J. Chromatogr., B: Anal. Technol. Biomed. Life Sci.2001, 760, 1.
26. Emídio, E. S.; Prata, V. M.; Santana, F. J. M.; Dórea, H. S.;
J. Chromatogr., B: Anal. Technol. Biomed. Life Sci.2010, 878, 2175.
27. Polonini, H. C.; de Oliveira, M. A. L.; Ferreira, A. O.; Raposo, N. R. B.; Grossi, L. N.; Brandão, M. A. F.; J. Braz. Chem. Soc.
2011, 22, 1263.
28. Gaujac, A.; Emídio, E. S.; Navickiene, S.; Ferreira, S. L. C.; Dórea, H. S.; J. Chromatogr., A2008, 1203, 99.
29. Khajeh, M.; J. Braz. Chem. Soc. 2012, 23, 1704.
30. Giokas, D. L.; Sakkas, V. A.; Albanis, T. A.; J. Chromatogr., A
2004, 1026, 289.
31. International Conference on Harmonisation (ICH), Harmonised Tripartite Guideline; Validation of Analytical Procedures:
Text and Methodology Q2(R1), 2005. http://www.ich.org/
fileadmin/Public_Web_Site/ICH_Products/Guidelines/Quality/ Q2_R1/Step4/Q2_R1__Guideline.pdf , accessed in May 2013. 32.
http://chemkeys.com/br/2003/10/17/analise-quantitativa-por-cromatografia, accessed in May 2013.
Submitted: June 6, 2013
Published online: August 9, 2013