Flaviane Mello LazariniI Regina MelchiorII
Alberto Durán GonzálezII Tiemi MatsuoII
I Departamento de DSTs, Aids e Hepatites Virais. Secretaria de Vigilância em Saúde. Ministério da Saúde, Brasília, DF, Brasil II Programa de Pós-Graduação em Saúde
Coletiva. Universidade Estadual de Londrina. Londrina, PR, Brasil
Correspondence:
Flaviane Mello Lazarini
Núcleo de Estudos em Saúde Coletiva – Nesco Av. Robert Koch, 60 – Vila Operária
86038-350 Londrina, PR E-mail: fl [email protected] Received: 12/13/2011 Approved: 5/26/2012
Article available from: www.scielo.br/rsp
Trends in the epidemic of Aids
cases in Southern Brazil from
1986 to 2008
ABSTRACT
OBJECTIVE: To describe trends in the incidence of Aids cases according to
age and gender from 1986 to 2008.
METHODS: Analyses of Aids trends according to age group and to gender
was carried out Londrina, Southern Brazil. The timeframe was divided into two periods (1986-1995 and 1996-2008). Of the polynomial models, it was the fi rst-degree polynomial model which best explained the Aids epidemic within the two periods. The incidence rate of Aids among men who have sex with other men (MSM), injecting drug users (IDU), heterosexual men and women was calculated.
RESULTS: During the fi rst period, from 1986 to 1995, there was an increase in the incidence of Aids in almost all age groups and the epidemic spread across both sexes (p < 0.001), although this was more marked in men aged 14-39. The second period (1996-2008) did not show a positive or negative statistical increase, indicating that the epidemic had stabilized. A signifi cant fall in the rate for the male 14 to 29 age group was found, with increases of 0.88 and 0.87 for the fi rst and second period respectively. Cases in women aged 50 and over showed a marked increase (p = 0.019). The IDU and MSM groups predominated as the categories with the most exposure, with MSM taking over from IDU in the last three years of the study. From 2000 onwards, incidences in females aged 15 to 49 overtook that of heterosexual men.
CONCLUSIONS: The study showed a decrease in incidence in the younger age
groups and stabilization in the other age groups. There is a need for different approaches in order to reach groups with several characteristics due to the increase in the proportion of women and MSM within the exposure categories.
DESCRIPTORS: HIV Infections, epidemiology. Acquired
In order to understand the behaviour of the AIDS epidemic in Brazil, it is necessary to study its trends of incidence in different population groups.25 In addition
to increasing incidence in heterosexuals and women,6
regional diversity in the effectiveness of national poli-cies interfere in the development of services to treat AIDS. Research which describes local trends of the epidemic, in specifi c subgroups such as intravenous drug users (IDU) and men who have sex with other men (MSM) is necessary.12
This study aims to describe the trends of AIDS cases according to sex and age groups in the period from 1986 to 2008.
METHODS
This is a retrospective ecological descriptive study, with a quantitative approach, with 1,912 patients diagnosed with AIDS in Londrina, Paraná State, SouthernBrazil, between 1986 (year of the fi rst case resident in the muni-cipality) and 2008. Londrina is the second largest city in Paraná State, with 506,701 inhabitants and dominates the north of the state.
Data on diagnoses were obtained from the database of the Notifi able Diseases Information System (Sistema de Informações de Agravos de Notifi cação – SINAN), made available by the Division of Epidemiology of the Londrina’s Municipal Health Secretariat as the data available from the Brazilian Unifi ed Health System IT Department (DATASUS) website were not used, since they were often incomplete due to delays in being updated. The variables were divided into two types: those characterised as socio-demographic and those of exposure. The socio-demographic variables were: sex, age (in years – 14 to 29; 30 to 39; 40 to 49 and 50 +), level of education (in years at school – zero to three, four to seven, eight to 11 and 12 +) and occupation, according to the Brazilian Classifi cation of Occupations (those who held a paying job were classed as “working” and those who were unemployed or did not hold a paying job were classed as “not working”). The categories of exposure were: exposure through sexual intercourse (homosexual and bisexual men) and intravenous drug users according to the exposure category hierarchy.a
Incidence rates were grouped by time of diagnosis to better understand the profi le of the epidemic. The fi rst period was of four years (1986-1990), as the number of
INTRODUCTION
cases was lower during this period. Subsequently, the periods were of three years up until 2008.
The following were excluded from the study as they presented inconsistencies in the database: CD4+ cell
count at the time of diagnosis, history of an HIV posi-tive partner, vertical transmission, blood transfusions and accidents with biological material.
The annual coeffi cients of AIDS incidence, according to sex, were adjusted for age as in the technique stan-dardised by the direct method. The population adopted as the standard was that of Brazil according to the 2010 census carried out by Instituto Brasileiro de Geografi a e Estatística (IBGE).b
In order to calculate the coeffi cients of incidence among men who have sex with men and reported at least one incidence of intravenous drug use, we used estimates of the size of this population (3.2% and 0.9% respectively) in the 15 to 49 age group, obtained from the 2004 survey on knowledge, attitudes and practices of the Brazilian population.c Although there was another survey on
knowledge, attitudes and practices of the Brazilian population from 2008, we decided to use that of 2004 as the data were contemporaneous to those of the study. Results of the researchc were also used to estimate
incidence in heterosexual men in the same age group. Incidence rates among women (homosexual, bisexual and heterosexual) were added to the categories of exposure. The data were tabulated using Excel®, 2010 version.
Analysis of the incidence rates of AIDS by age group and sex was separated into two periods to make it easier to observe the behaviour of the epidemic. The
fi rst period was from 1986 to 1995 and the second 1996 to 2008. The year of 1996 was chosen as the cut off between periods since a highly active antiretroviral therapy became available in Brazil then. SPSS® version 19.0 software was used in the descriptive and regression analysis. Of the polynomial models (linear, quadratic and cubic), the linear model was that which best explained the trend of the epidemic in the two periods. The standardized coeffi cients of AIDS incidence were deemed to be the dependent variable (Y) and the calendar years of the study the independent variables (X) in the linear model.
a Prefeitura Municipal de São Paulo, Secretaria Municipal da Saúde, Vigilância Epidemiológica de DST/Aids. Bol Epidemiol Aids Munic São Paulo. 2001 jul-set:38 [cited 2011 jun 4]. Available from: http://bvsms.saude.gov.br/bvs/periodicos/Boletim__2001_Aids.pdf
b Instituto Brasileiro de Geografi a e Estatística. Censo demográfi co 2010 [cited 2011 jun 4]. Available from: http://www.censo2010.ibge.gov. br/index.php
The variable year was centralized and converted into calendar years apart from the average year of the period, i.e., year-1991 in the fi rst period and 2002 in the second period.
This research was approved by the Committee of Ethical Research of the Universidade Estadual de Londrina (CAAE nº 4515.0.000.268-10).
RESULTS
In the fi rst period, the trend was for an increase in AIDS cases, whereas in the second one, the incidence is stabilised (Table).
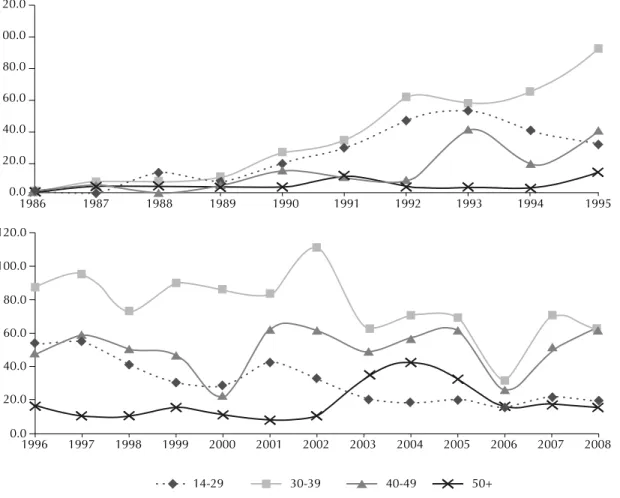
At the beginning of the epidemic, from 1986 to 1995, 66.7% of reported cases were in men (Figure 1). The ratio between sexes was three men to every woman, but in the fi nal years of the study this fell to 1.7:1 (Figure 2). The age group with the most number of cases was 14 to 29 and had a peak of 52.4% of cases between 1991 and 1993; of these, 77.3% were in men. The percen-tage for women aged 50+ went from 1.6% in 1990 to 7.1% in 2008.
There was an increase in AIDS incidence rate in almost all age groups between 1986 and 1995, especially in the 14 to 39 age range, for both sexes, but most notably for men. Only the coeffi cient among individuals aged 50+ showed a smaller increase (Table 1).
There was a signifi cant drop in cases in men aged 14 to 29 in the second period: the increase went from 0.88 cases/100 thousand in the fi rst period to 0.87 cases/ 100 thousand in the second. Signifi cant declines in the number of cases only occurred in those aged 30 to 39. In the last years of the study there was a transition towards more cases in older age groups. The percen-tage of AIDS cases over 50s was 8.1% at the start of the study and by the end, it had doubled (16.5%). In this age group, the increase in cases in women went from 0.45 cases/100 thousand in the fi rst period to 0.63 in the second.
Sexual intercourse was the predominant means of transmission, almost always above 90%, in all of the periods. Throughout the study, the percentage of cases who were homosexual males remained an average 32.1%. At the beginning of the epidemic, 51% of infected males were homosexual or bisexual. From
Table. Analysis of trends in the standardised incidence rates of reported AIDS cases, according to sex and age group. Londrina, Southern Brazil, 1986-2008.
Age group (years) Sex R² Model (y=β0 + β1.x) (year) pb
1986-1995
14 to 29 Female 0.84 Y = 9.15 + 0.92 (1991) < 0.001
Male 0.78 Y = 26.04 + 0.88 (1991) 0.001
30 to 39 Female 0.89 Y = 13.44 + 0.94 (1991) < 0.001
Male 0.93 Y = 39.82 + 0.96 (1991) < 0.001
40 to 49 Female 0.43 Y = 4.11 + 0.65 (1991) 0.039
Male 0.62 Y = 15.40 + 0.78 (1991) 0.007
50 and over Female 0.2 Y = 1.48 + 0.45 (1991) 0.184
Male 0.3 Y = 5.07 + 0.55 (1991) 0.097
Total Female 0.9 Y = 6.98 + 0.95 (1991) < 0.001
Male 0.95 Y = 21.71 + 0.97 (1991) < 0.001
1996-2008
14 to 29 Female 0.13 Y = 17.02 - 0.37 (2002) 0.213
Male 0.75 Y = 31.20 - 0.87 (2002) < 0.001
30 to 39 Female 0.35 Y = 41.36 - 0.59 (2002) 0.033
Male 0.38 Y = 77.06 - 0.62 (2002) 0.023
40 to 49 Female 0.17 Y = 28.80 + 0.41 (2002) 0.16
Male 0 Y = 51.16 + 0.88 (2002) 0.776
50 and over Female 0.4 Y = 11.01 + 0.63 (2002) 0.019
Male 0.15 Y = 19.13 + 0.38 (2002) 0.188
Total Female 0.01 Y = 22.29 - 0.13 (2002) 0.666
Male 0.02 Y = 22.53 - 0.16 (2002) 0.591
a Standardised by the Brazilian population, 2010
b p = Descriptive level of the hypothesis test for the coeffi cient β
2000 onwards, there was a decline in the epidemic in all categories (Figures 3 and 4).
The IDU group had its highest incidence of cases between 1991 and 1993, totalling 1,826.9 cases/100 thousand inhabitants in the estimated IDU population (Figure 3). From the subsequent three year period, inci-dence among IDU began a marked decline. From 2006, this group lost its position to that of MSM, which had been in second place during most of the study period. Incidence among women (homosexual, bisexual and heterosexual) and heterosexual men was low compared to that among IDU and MSM groups and another scale was used in order to better visualise it (Figure 4). Incidence of AIDS in heterosexual men was predominant in the fi rst years of the study. In spite of
fl uctuations, the rates of incidence in these men last peaked in 1997 to 1999, with 38.4 cases /100 thousand. The epidemic among women increased until 2001. Even with declines in the last three periods, the coeffi cients for this group overtook those of heterosexual men and have remained higher since 2000.
At the beginning of the study, there was no record of illiteracy. The category of those with zero to three years of schooling never rose above 10% in any of the periods. There was no difference between sexes for those with low levels of education. In all periods of the study, and for both sexes, four to seven years and eight to 11 years of schooling were the predominant categories. Twelve or more years of schooling appeared in 2006 to 2008 (12.3% of cases).
As regards paid and unpaid work, there was no difference between men and women. More than 60% of those diagnosed were working throughout the entire period.
DISCUSSION
The results show large increases in the AIDS epidemic between 1986 and 1995. After this period, incidence started to decline, especially in the younger age groups, and then stabilised. Decline in incidence may have been infl uenced by the availability of highly active antiretro-viral therapy.25 In addition to the increase in survival
rates, this also accounts for reduced transmission, as they decrease viral load in individuals with HIV/AIDS.8
120.0
100.0
80.0
60.0
40.0
20.0
0.0
1986 1987 1988 1989 1990 1991 1992 1993 1994 1995
1996 120.0
100.0
80.0
60.0
40.0
20.0
0.0
1997 1998 1999 2000 2001 2002 2003 2004 2005 2006 2007 2008
14-29 30-39 40-49 50+
Deceleration in incidence after the introduction of the above mentioned treatment has been observed in almost all regions of Brazil25 and in some other parts
of the world.d
The trend of stabilisation observed in the epidemic in Londrina is similar to that observed in Brazil.8 Although
there have been decreased rates of incidence in both sexes, the trend was not statistically signifi cant. The data corroborate the fi ndings of a studye carried out in
58 countries, which found the epidemic spread slowly at fi rst, followed by a period of rapid spread and fi nally plateauing. According to the authors, almost all epidemic reached their plateau in the 1990s or early 2000s. Londrina follows the trend of decline in Paraná,f,g in
contrast to other southern states, which have had incre-asing incidence rates since 2000. Possible explanations for the spread of the epidemic in the south are the incre-ased prevalence of HIV-1 Subtype C,4 the high amount
1986 1987 1988 1989 1990 1991 1992 1993 1994 1995
70.0
60.0
50.0
40.0
30.0
20.0
10.0
0.0
70.0
60.0
50.0
40.0
30.0
20.0
10.0
0.0
1996 1997 1998 1999 2000 2001 2002 2003 2004 2005 2006 2007 2008
14-29 30-39 40-49 50+
Figure 2. Standardised incidence rates of AIDS in women (per 100 thousand inhabitants), for both periods, according to age group. Londrina, Southern Brazil, 1986-2008.
d Dourado I, Lima C, Carthy SM, Veras MA, Kerr L, Brito AM. Acesso tardio aos serviços de saúde para o cuidado em HIV/aids em Salvador / Bahia - estudo ATASS. In: Anais do 8. Congresso Brasileiro de Epidemiologia; 2011; São Paulo (BR). Available from: http://www.unaids.org.br/ acoes/Sum%E1rio%20executivo-ATASS13abril_nova%20versao%20pdf.pdf
e Bongaarts J, Pelletier F, Gerland P. Poverty, gender, and youth: global trends in AIDS mortality. New York; 2009. (Working Paper, 16). [cited 2011 Sep 6]. Available from: http://www.popcouncil.org/pdfs/wp/pgy/016.pdf
f Ministério da Saúde (BR), Departamento DST, Aids e Hepatites Virais. Bol Epidemiol Aids. 2007; Ano IV - nº 1 - 27ª - 52ª – semanas epidemiológicas, jul-set 2006 [cited 2011 Sep 10]. Available from: http://www.aids.gov.br/pagina/2010/36374
of movement of people between the port area and the interior and the use of intravenous drugs.20
The signifi cant drop in AIDS cases in men in the 14 to 29 age group and in both sexes aged 30 to 39 in the second period, is analogous to what happened in Brazil from 1997 onwards, when incidence rates dropped
among men and rose among women.8 The other age
groups remained at relative growth, reinforcing tran-sition of the epidemic to older age groups.23
The signifi cant increase in incidence rates of AIDS in women aged 50+ was also found in a study in Pernambuco State from 1990 to 2000.19 Being in stable
Per 100 thousand inhabitants
2000.0 1900.0 1800.0 1700.0 1600.0 1500.0 1400.0 1300.0 1200.0 1100.0 1000.0 900.0 800.0 700.0 600.0 500.0 400.0 300.0 200.0 100.0 0.0
1986-1990 1991-1993 1994-1996 1997-1999 2000-2002 2003-2005 2006-2008
324.9
IDUa 1826.9 1476.6 1231.5 963.0 692.7 273.6
2.0
MSMb 256.9 429.8 539.9 632.0 502.9 436.1
1.9
Women 4.6 15.3 28.8 38.5 34.5 28.8
0.2
Heterosexual men 25.7 24.0 38.4 27.8 23.6 20.6
IDU: Injecting drug users
MSM: AIDS among men who have sex with other men
Figure 3. Incidence of AIDS according to the period in which they were diagnosed and hierarchy of exposure category, from 14 to 49 years old. Londrina, Southern Brazil, 1986-2008.
Per 100 thousand inhabitants
1986-1990 45.0
40.0
35.0
30.0
25.0
20.0
15.0
10.0
5.0
0.0
1991-1993 1994-1996 1997-1999 2000-2002 2003-2005 2006-2008
Women Heterosexual men
a Intravenous drug users were excluded from the groups according to hierarchy and can be seen in Figure 3
monogamous relationships and entering the non-repro-ductive phase means they are less likely to use condoms14
and this increases the risk of contracting HIV.13,16
For some women, it is diffi cult to talk about using condoms with their partners.2 This behaviour may be
related to establishing a relationship of trust, as well as lack of information.11 Other situations which aggravate
the social vulnerability of women, such as fi nancial diffi culties, drug use before or during sexual relations17
or working in the sex industry7 increase exposure to
HIV through not using condoms.
Those aged 50 and over are 20% more likely to delay access to services for diagnosing HIV than younger individuals.d Moreover, subjects in the more advanced
age groups tend not to perceive that they are at risk.18,21
This leads to late diagnosis and falls in survival rates,21
increasing the chance of spreading the infection due to not taking the necessary precautions to prevent this.22
In the fi rst period of the study, incidence was predo-minantly among young men in the MSM group, which was also the case in Brazil.23 This group accounted for
71% of diagnoses in the country in 1984,6 although
this proportion had fallen to 16% by 1999.6 Campaigns
aimed at promoting safer sex among this group may have had an impact on this decline.
Cases in the IDU group peaked in 1990. Although rates are falling, they predominated among exposure cate-gories until 2005. The predominance of this group was observed at the beginning of the 1990s in the European Union, where 42% of those infected with HIV were IDU.9
The entry of crack cocaine into the world market has led to a decline in pure cocaine use, especially intravenous use, in South America.h The decrease in intravenous
drug use was also apparent in Brazil and reduced transmission of HIV by this means.13,25
Incidence rates of AIDS in the MSM group overtook IDU in 2006, in this study. Despite global rates of new HIV infections having slowed from three million in 2001 to 2.7 million in 2008,i diverse studies in Brazil3,24
and in the world15,19 have shown a resurgence in new
cases in the MSM subgroup. In 2007 Szwarcwald et al24 carried out a study in 17 to 20 year old males which
showed a decrease in regular condom use, both with stable and casual partners, in both heterosexual and MSM. The lower the level of education of these young men, the lower the reported condom use.
The perception that highly active antiretroviral therapy minimises the threat of HIV infection and risk of
dying from AIDS may infl uence the underestimating of personal risk.10 As discussed above, this behaviour
may occur in other vulnerable groups.
Until the end of the 1990s in Londrina, the incidence rate of AIDS in heterosexual men aged 15 to 49 was higher than that of women in the same age group. In 2000 the rates for women overtook those of men and remained higher until the end of the period.
This increase in the women’s group makes them the exposure category with the third greatest incidence of AIDS cases. This research highlights the signifi cant increase in incidence rates found in women aged 50 and over.
The results clash with the pattern of the epidemic in Brazil for levels of education, which provokes refl ection on how well this data was completed. A possible explanation is that some information was not properly recorded when completing the notifi cation of disease, especially at the beginning of the epidemic, which is a common problem faced by epidemiological monitoring in Brazil.j
Another limit of this research is changes in defi nitions of AIDS cases which may have affected alterations in tendency over the 23 years of the epidemic studied in Londrina. These changes affect the registering of new cases and the implementation of public policies which assist in early detection and prevention of HIV transmission. The possibility of registering more cases does not nullify the stabilisation which has been observed. This limitation is common to other studies using the same methodological design.
The restriction of age groups on the analysis of AIDS in those subgroups most vulnerable to the epidemic in Londrina is also noteworthy. The estimates used in this study are limited to the age groups available in the survey on knowledge, attitudes and practices in the Brazilian population, the only survey which provided estimates of the prevalence of the most vulnerable sub groups in Brazil. In spite of this limitation, the use of estimates increases understanding of the determinants of the epidemic.
Analysis of trends showed the epidemic stabilised after increases in incidence rates in all age groups in the fi rst years of the study. However, there was an increase in women aged 50 and over and in the MSM and IDU subgroups, which indicated that that infec-tion was transmitted principally through unprotected sexual relations.
h United Nations Offi ce on Drugs and Crime. World Drug Report 2011. New York; 2011. (United Nations Publication, Sales nº E.11.XI.10). [cited 2011 Sep 23]. Available from: http://www.unodc.org/documents/data-and-analysis/WDR2011/World_Drug_Report_2011_ebook.pdf i Nações Unidas Brasil. A ONU e a resposta à aids no Brasil. Brasília (DF): UNAIDS Brasil; 2010 [cited 2011 Sep 23]. Available from: http://www.unaids.org.br/biblioteca/Folder%20A%20ONU%20e%20a%20Resposta%20%E0%20aids%20no%20Brasil%202%AA%20 Edi%E7%E3o%20FINAL.pdf
Rates among women overtook those among men in the fi nal three periods of the study, characterising this as a vulnerable group which merits special attention in preventative planning.
There is a cultural and behavioural challenge to be understood. Policies which work on preventing HIV
1. Akers A, Bernstein L, Henderson S, Doyle J, Corbie-Smith G. Factors associated with lack of interest in HIV testing
in older at-risk women. J Womens Health (Larchmt).
2007;16(6):842-58. DOI:10.1089/jwh.2006.0028
2. Alves RN, Kovács MJ, Stall R, Paiva V. Fatores psicossociais e a infecção por HIV em mulheres,
Maringá, PR. Rev Saude Publica. 2002;36(4
Supl):32-9. DOI:10.1590/S0034-89102002000500006
3. Barbosa Júnior A, Szwarcwald CL, Pascom ARP, Souza Júnior PB. Tendências da epidemia de AIDS entre subgrupos sob maior risco no Brasil, 1980-2004. Cad Saude Publica. 2009;25(4):727-37. DOI:10.1590/S0102-311X2009000400003
4. Bello G, Guimarães ML, Passaes CP, Almeida SEM, Veloso VG, Morgado MG. Evidences of recent decline in the expansion rate of the HIV type 1 subtype C and CRF31_BC epidemics in southern Brazil.
AIDS Res Hum Retroviruses. 2009;25(11):1065-9. DOI:10.1089/aid.2009.0106
5. Brito AM, Castilho EA, Szwarcwald CL. AIDS e infecção pelo HIV no Brasil: uma epidemia multifacetada.
Rev Soc Bras Med Trop. 2001;34(2):207-17. DOI:10.1590/S0037-86822001000200010
6. Brito AM, Castilho EA, Szwarcwald CL. Regional patterns of the temporal evolution of the AIDS epidemic in Brazil following the introduction of
antiretroviral therapy. Braz J Infect Dis. 2005;9(1):9-19.
DOI:10.1590/S1413-86702005000100004
7. Damacena GN, Szwarcwald CL, Souza Júnior PRB, Dourado I. Risk factors associated with HIV prevalence
among female sex workers in 10 Brazilian cities. J
Acquir Immune Defi c Syndr. 2011;57(Suppl) 3:S144-52. DOI:10.1097/QAI.0b013e31821e9bf6
8. Dourado I, Veras MASM, Barreira D, Brito AM. Tendências da epidemia de aids no Brasil após a
terapia anti-retroviral. Rev Saude Publica. 2006;40
(Supl):9-17. DOI:10.1590/S0034-89102006000800003
9. Downs AM, Heisterkamp SH, Brunet JB, Hamers FF. Reconstruction and prediction of the HIV/AIDS epidemic among adults in the European Union and in the low prevalence countries of central and eastern
Europe. AIDS. 1997;11(5):649-62.
10. Elford J, Ibrahim F, Bukutu C, Anderson J. Over fi fty
and living with HIV in London. Sex Transm Infect.
2008;84(6):468-72. DOI:10.1136/sti.2008.031187
11. Garcia S, Souza FM. Vulnerabilidades ao HIV/ aids no contexto brasileiro: iniquidades de gênero,
raça e geração. Saude Soc. 2010;19(Supl 2):9-20.
DOI:10.1590/S0104-12902010000600003
12. Grangeiro A, Escuder MML, Castilho EA. A epidemia de AIDS no Brasil e as desigualdades regionais e de
oferta de serviço. Cad Saude Publica. 2010;26(12):
2355-67. DOI:10.1590/S0102-311X2010001200014
13. Grangeiro A, Escuder MML, Castilho EA. Magnitude e tendência da epidemia de Aids em municípios brasileiros de 2002-2006.
Rev Saude Publica. 2010;44(3):430-41. DOI:10.1590/S0034-89102010005000013
14. Heffron R, Donnell D, Rees H, Celum C, Mugo N, Were E, et al. Use of hormonal contraceptives and risk of HIV-1 transmission: a prospective cohort
study. Lancet Infect Dis. 2011;11:1473-3099.
DOI:10.1016/S1473-3099(11)70247-X
15. Le Vu S, Le Strat Y, Barin F, Pillonel J, Cazein F, Bousquet V, et al. Population-based HIV-1 incidence in France, 2003-08: a modelling
analysis. Lancet Infect Dis. 2010;10(10):682-7.
DOI: 10.1016/S1473-3099(10)70167-5.
16. Lindau St, Leitsch As, Lundberg KL, Jerome J. Older women’s attitudes, behavior, and communication
about sex and HIV: a community-based study. J
Womens Health (Larchmt). 2006;15(6):747-53. DOI:10.1089/jwh.2006.15.747
17. Ober AJ, Iguchi MY, Weiss RE, Gorbach PM, Heimer R, Ouellet LJ, et al. The relative role of perceived partner risks in promoting condom use in a three-city
sample of high-risk, low-income women. AIDS Behav.
2011;15(7):1347-58. DOI:10.1007/s10461-010-9840-7
18. Park LS, Siraprapasiri T, Peerapatanapokin W, Manne J, Niccolai L, Kunanusont C. HIV Transmission rates in Thailand: evidence of HIV prevention and transmission
decline. J Acquir Immune Defi c Syndr.
2010;54(4):430-6. DOI:10.1097/QAI.0b013e3181dc5dad
19. Pottes FA, Brito AM, Gouveia GC, Araújo EC, Carneiro RM. Aids e envelhecimento: características dos casos com idade igual ou maior que 50 anos em Pernambuco, de 1990 a
2000. Rev Bras Epidemiol. 2007;10(3):338-51.
DOI:10.1590/S1415-790X2007000300005
20. Simon D, Béria JU, Tietzmann DC, Carli R, Stein AT, Lunge VR. Prevalência de subtipos do HIV-1 em amostra de pacientes de um centro urbano no sul
do Brasil. RevSaude Publica. 2010;44(6):1094-101.
DOI:10.1590/S0034-89102010005000039.
21. Smith RD, Delpech VC, Brown AE, Rice BD. HIV transmission and high rates of late diagnoses among
adults aged 50 years and over. AIDS. 2010;24
(13):2109-15. DOI:10.1097/QAD.0b013e32833c7b9c
22. Smith RD, Kall MM, Rice BD, Delpech VC. Increasing HIV infection among adults aged 50 years and over:
a call for heightened awareness. Therapy. 2011;8
(2):201-5. DOI:10.2217/thy.11.1
23. Szwarcwald CL, Bastos FI, Esteves MAP, Andrade CLT. A disseminação da epidemia da AIDS no Brasil, no período de 1987-1996: uma análise
espacial. Cad Saude Publica. 2000;16(Supl 1):7-19.
DOI:10.1590/S0102-311X2000000700002
24. Szwarcwald CL, Andrade CLT, Pascom ARP, Fazito E, Pereira GFM, Penha IT. HIV-related risky
practices among Brazilian young men, 2007.
Cad Saude Publica. 2011;27(Suppl 1):S19-26. DOI:10.1590/S0102-311X2011001300003
25. Szwarcwald CL, Castilho EA. A epidemia de HIV/AIDS no Brasil: três décadas [editorial].
Cad Saude Publica. 2011;27(Supl 1):S4-5. DOI:10.1590/S0102-311X2011001300001 REFERENCES