Rev Saúde Pública 2004;38(2) www.fsp.usp.br/rsp
Infant mortality evolution in the metropolitan
region of São Paulo (Brazil), 1980-2000
M arcia M oreira H olcmana, M aria do Rosário D ias de O liveira Latorrea and Jair Lício
Ferreira Santosb
aDepartamento de Epidemiologia da Faculdade de Saúde Pública da Universidade de São Paulo
(USP). São Paulo, SP, Brasil. bDepartamento de Medicina Social da Faculdade de Medicina de Ribei-rão Preto da USP. RibeiRibei-rão Preto, SP, Brasil
Correspondence to:
Marcia Moreira Holcman R. Pedro Doll, 472, apto 112 02404-01 São Paulo, SP, Brasil E-mail: [email protected]
Supported by the Conselho Nacional de Desenvolvimento Científico e Tecnológico (CNPq - Process n. 133455/98-00). Based on the Master’s dissertation presented at the Department of Epidemiology, Faculdade de Saúde Pública – Universidade de São Paulo, 2001.
Received on 22/7/2002. Reviewed on 10/7/2003. Approved on 12/9/2003.
Keywords
Infant mortality, trends. Mortality rate. Death certificates. Cause of death. Neonatal mortality (public health). Residence characteristics.
Abstract
Objective
To analyze IMR evolution in the São Paulo Metropolitan Area (SPMA) between 1980 and 2000, in terms of spatial, age and, causal differences.
Methods
SPMA municipalities were divided into 5 groups, based on their 1980 IMRs: ≥90‰ lb (Group 1); 70-89‰ lb (Group 2); 50-69‰ lb (Group 3); <50‰ lb (Group 4). Group 5 comprised the municipality of São Paulo itself (IMR=51‰ lb). The analysis of trends was carried out using exponential regression models.
Results
IMR and its components showed a statistically significant decrease (p<0.05), with coefficients of determination between 66 and 98%, indicating goodness of fit of the exponential model to all the time series analyzed. SPMA IMR fell 69.4%, from 55.2 to 16.9‰ lb, and Groups 1-5 showed reductions of 83.9%, 76.2%, 71.3%, 58.7%, and 68.8%, indicating that the groups with highest IMRs also showed the greatest reductions during the studied period.
Conclusions
IMRs were homogenized at around 18‰ lb in all municipality groups in the SPMA. One-half of all deaths were concentrated within the first week of life, and were due primarily to conditions originating in the perinatal period, indicating that greater care during the pre- and post-delivery periods will be required if the IMR in the SPMA is to descend to levels compatible with those of developed countries.
INTRODUCTION
The Infant Mortality Rate (IMR) has been used as an indicator not only of the quality of child health, but also of the level of development of a society. The IMR estimates the risk of a child dying during in-fancy (before reaching age 1 year), and can express the ability a community has to fulfill the nutritional, housing, and healthcare needs of its newborn.
IMRs in Brazil have decreased greatly in the last twenty years, falling from 69‰ live births in 1980 to
30‰ live births (lb) in 2000, a 57% decrease. Despite these numbers, infant mortality rates in Brazil are still high if compared to those of developed countries, in which IMRs were already below 15‰ lb in the 1980’s. There are differences in the rates of infant mortality between the five Brazilian Regions: whereas the South and Southeast Regions have rates close to 20‰ lb, the rates in the Northeast Region are above 40‰ lb.4
Rev Saúde Pública 2004;38(2) www.fsp.usp.br/rsp
Evolução da mortalidade Infantil em São Paulo, SP Holcman MM et al
and one of the largest in the world. From 1950 to 1970, a large contingent of immigrants, especially from the Northeastern states, estab-lished themselves in the SPMA. This phenom-enon promoted an increase in the demand for urban infrastructure and healthcare services, generating heterogeneous living standards and patent social exclusion. The aim of the present study is to analyze the evolution of infant mortality rates within the São Paulo Metro-politan Area – between 1980 and 2000 – with emphasis on spatial differences.
M ETH O D S
Mortality rates were calculated for the early neonatal (0-6 days after delivery), late neonatal (7-27 days after delivery), and post neonatal (28-364 days after delivery) peri-ods, as well as for the entire period (0-364 days after delivery) for all municipalities in the SPMA, between 1980 and 2000. The number of deaths according to age group was taken from data provided by the Ministry of Health’s Sistema de Informações sobre
Mortalidade (Mortality Information System
– SIM/MS). The number of live births was taken from the Sistema Estadual de Análise
de Dados (State Data Analysis System –
SEADE) Foundation.
Specific mortality rates were calculated for the 5 major causes of death in the 1980-2000 period, based on International Classification of Diseases – 9th review (ICD-9) chapters I
(Infectious and Parasitic Diseases), III (En-docrine, nutritional, and metabolic diseases and immune disorders), VIII (Diseases of the respiratory system), XIV (Congenital
malfor-Table 1 - Description of the Municipalities in the São Paulo Metropolitan Area.
Group Infant M unicipalities M ean IM R
mortality of the
rate group
1 <90 Pirapora do Bom Jesus, Ferraz de Vasconcelos, 106.5 Itapevi, Santana de Parnaíba, Poá, Carapicuiba
e Itaquaquecetuba.
2 70 l— 90 Arujá, Suzano, D iadema, Itapecerica da Serra, 79.9 Biritiba Mirim, Santa Isabel, Franco da Rocha,
Francisco M orato, Salezópolis e Embu.
3 50 l— 70 Osasco, Embu Guaçu, Jandira, Rio Grande da 64.5
Serra, São Bernardo do Campo, Mauá, Juquitiba, Caieiras, Cajamar, Mogi das Cruzes e Cotia.
4 <50 M airiporã, Guararema, Ribeirão Pires, Guarulhos, 43.6 Santo André, Barueri, Taboão da Serra, São
Caetano do Sul e Vargem Grande Paulista.
5 50.6 São Paulo 50.6
Total RM SP 55.2
Source: Crude data: Seade Foundation and Ministry of Health - SIM/MS.
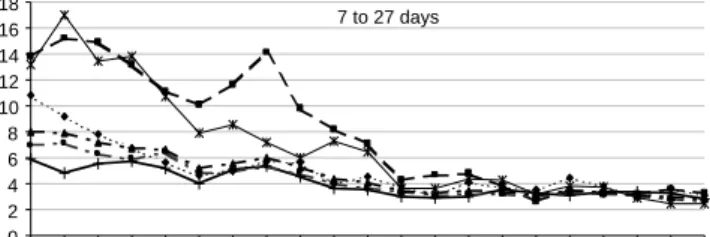
Figure 1 - Infant M ortal i ty Rate and i ts components, accordi ng to municipality groups. São Paulo Metropolitan Area, 1980-2000.
7 to 27 days
0 2 4 6 8 10 12 14 16 18
80 81 82 83 84 85 86 87 88 89 90 91 92 93 94 95 96 97 98 99 00
Less than 7 days
0 5 10 15 20 25 30 35
80 81 82 83 84 85 86 87 88 89 90 91 92 93 94 95 96 97 98 99 00
28 to 364 days
0 10 20 30 40 50 60 70 80
80 81 82 83 84 85 86 87 88 89 90 91 92 93 94 95 96 97 98 99 00
Less than 1 years
0 20 40 60 80 100 120 140
80 81 82 83 84 85 86 87 88 89 90 91 92 93 94 95 96 97 98 99 00
!
Rev Saúde Pública 2004;38(2) www.fsp.usp.br/rsp
Evolução da mortalidade Infantil em São Paulo, SP Holcman MM et al
mations), and XV (Certain conditions originating in the perinatal period).
SPMA municipalities were divided into 5 groups (Table 1), based on their 1980 IMRs: =90‰ lb (Group 1); 70-89‰ lb (Group 2); 50-69‰ lb (Group 3); <50‰ lb (Group 4). Group 5 comprised the municipality of São Paulo itself (IMR=51‰ lb).
The socioeconomic variables analyzed in each group included: percentage of households connected to the water supply and sewage networks, percentage literacy above age 5 years, and percentage house-holds according to head of family’s mean monthly income class (in number of minimum wages), col-lected in the 1980 and 2000 censuses.3,4
Trends in IMR and its components, according to municipality group and cause of death, were analyzed using exponential regression models5 (Y= β
0e b
1 x) in
which dependent variable (Y) is the infant mortality rate (dependent variable), X is the corresponding year (independent variable), and β1 is the mean of the yearly increment during the studied period. In order to avoid auto-correlation between the points,6 the
independent variable was centralized (X-1990 and X-1988). X-1990 corresponds to the middle point of the time series for IMR and its components by age from 1980 to 2000, and X-1988 to the middle point of the time series for cause-specific rates, from 1980 to 1995. A trend was considered as significant when p<0.05. The determination coefficient (r2) was used
to evaluate the model’s explanatory power (the closer this value is to 1, the better the model).6
RESU LTS
Infant mortality and its components decreased in all municipality groups (Figure 1). The SPMA showed a 69.4% decrease in IMR between 1980 and 2000 (55.2 to 16.9‰ lb). Percent decreases in IMR in the five municipality groups were 83.9%, 76.2%, 71.3%, 58.7%, and 68.8%, respectively (Table 2). Therefore, the groups with highest IMRs were also those that registered the greatest decrease, which brought all IMRs in 2000 to somewhere around 18‰ lb.
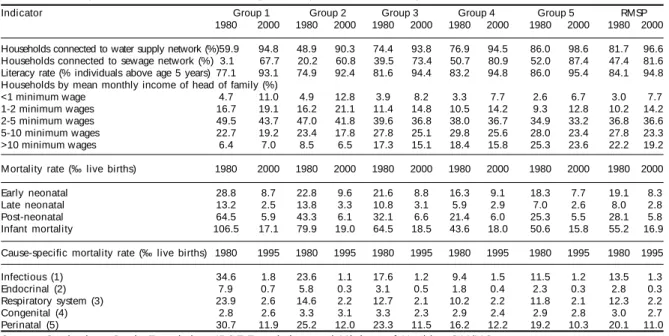
Groups 1 and 2, which in 1980 had the highest IMRs, had also the worst socioeconomic conditions, with lower percentage of households connected to the water supply and sewage networks, lower literacy, and greater number of low-income households (Ta-ble 2). The great increase in the SPMA water supply network accounted for the 90% coverage registered in all groups at the end of the period. Likewise, illit-eracy rates in all groups had also fallen below 10% by 2000. Sewage system coverage, however, is still not universal. Furthermore, the proportion of fami-lies included in the lowest income categories in-creased in all groups.
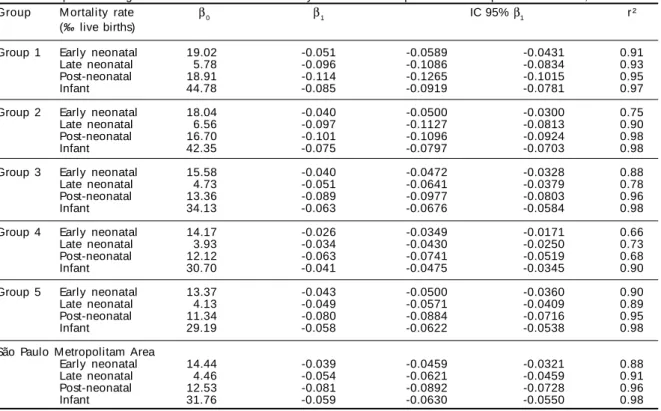
IMR and its components showed a statistically significant decrease (p<0.05), with determination coefficients between 66 and 98%, indicating the goodness of fit of the exponential model to all the time series analyzed (Table 3). Among the compo-nents of infant mortality, the post-neonatal period showed the greatest rate of decrease in all groups, followed by the late neonatal period. The early
Table 2 – Description of the indicators according to Groups. São Paulo Metropolitan Area, 1980 and 2000.
Indicator Group 1 Group 2 Group 3 Group 4 Group 5 RMSP
1980 2000 1980 2000 1980 2000 1980 2000 1980 2000 1980 2000
Households connected to water supply network (%)59.9 94.8 48.9 90.3 74.4 93.8 76.9 94.5 86.0 98.6 81.7 96.6
Households connected to sewage network (%) 3.1 67.7 20.2 60.8 39.5 73.4 50.7 80.9 52.0 87.4 47.4 81.6
Literacy rate (% individuals above age 5 years) 77.1 93.1 74.9 92.4 81.6 94.4 83.2 94.8 86.0 95.4 84.1 94.8
Households by mean monthly income of head of family (%)
<1 minimum wage 4.7 11.0 4.9 12.8 3.9 8.2 3.3 7.7 2.6 6.7 3.0 7.7
1-2 minimum wages 16.7 19.1 16.2 21.1 11.4 14.8 10.5 14.2 9.3 12.8 10.2 14.2
2-5 minimum wages 49.5 43.7 47.0 41.8 39.6 36.8 38.0 36.7 34.9 33.2 36.8 36.6
5-10 minimum wages 22.7 19.2 23.4 17.8 27.8 25.1 29.8 25.6 28.0 23.4 27.8 23.3
>10 minimum wages 6.4 7.0 8.5 6.5 17.3 15.1 18.4 15.8 25.3 23.6 22.2 19.2
Mortality rate (‰ live births) 1980 2000 1980 2000 1980 2000 1980 2000 1980 2000 1980 2000
Early neonatal 28.8 8.7 22.8 9.6 21.6 8.8 16.3 9.1 18.3 7.7 19.1 8.3
Late neonatal 13.2 2.5 13.8 3.3 10.8 3.1 5.9 2.9 7.0 2.6 8.0 2.8
Post-neonatal 64.5 5.9 43.3 6.1 32.1 6.6 21.4 6.0 25.3 5.5 28.1 5.8
Infant mortality 106.5 17.1 79.9 19.0 64.5 18.5 43.6 18.0 50.6 15.8 55.2 16.9
Cause-specific mortality rate (‰ live births) 1980 1995 1980 1995 1980 1995 1980 1995 1980 1995 1980 1995
Infectious (1) 34.6 1.8 23.6 1.1 17.6 1.2 9.4 1.5 11.5 1.2 13.5 1.3
Endocrinal (2) 7.9 0.7 5.8 0.3 3.1 0.5 1.8 0.4 2.3 0.3 2.8 0.3
Respiratory system (3) 23.9 2.6 14.6 2.2 12.7 2.1 10.2 2.2 11.8 2.1 12.3 2.2
Congenital (4) 2.8 2.6 3.3 3.1 3.3 2.3 2.9 2.4 2.9 2.8 3.0 2.7
Perinatal (5) 30.7 11.9 25.2 12.0 23.3 11.5 16.2 12.2 19.2 10.3 20.1 11.0
Source: Crude data: Seade Foundation, IBGE Foundation, and Ministry of Health - SIM/MS
" Rev Saúde Pública 2004;38(2) www.fsp.usp.br/rsp
Evolução da mortalidade Infantil em São Paulo, SP Holcman MM et al
neonatal period had the lowest rate of decrease.
In all analyses, the lowest rates of decrease were registered in Group 4, which consists of the munici-palities with IMRs below 50‰ lb in 1980.
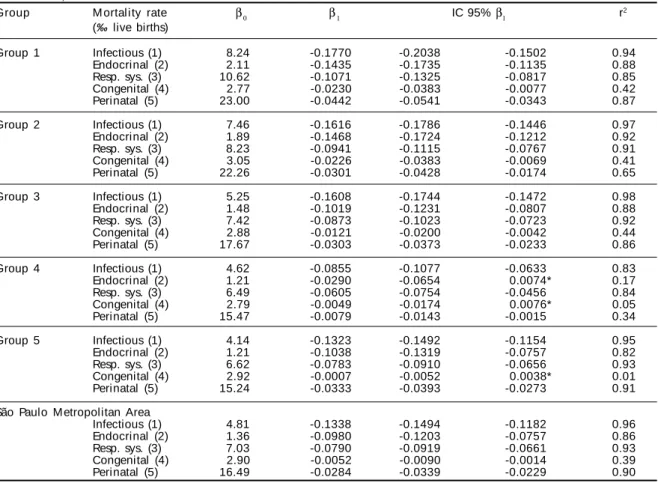
Infectious and parasitic diseases showed the high-est rate of decrease in all municipality groups and in SPMA as a whole (Table 4). Congenital malforma-tions showed the lowest rate of decrease as well as the lowest determination coefficients. In Group 4, IMRs due to endocrinal and nutritional diseases and con-genital malformations remained stable throughout the period. This was also the case with congenital mal-formations in Group 5.
D ISCU SSIO N
The infant mortality rate is one of the Instituto
Brasileiro de Geografia e Estatística (Brazilian
In-stitute for Geography and Statistics – IBGE) Foun-dation’s Minimal Social Indicators, which are part of the minimal national databases recommended by several international conferences promoted by the United Nations.
The state of São Paulo has one of the lowest rates of under-reporting in the country (2% for the number of live births and 10% for the number of deaths).12
This allows for direct calculation of infant mortality
rates, and for reliable time series to be built for the last two decades.
Despite the marked decrease observed in the pe-riod , the IMR in the São Paulo Metropolitan Area is still high when compared to developed countries, such as France (6‰ lb), Portugal (9‰ lb), Japan (4‰ lb), and United States (7‰ lb); even though, all munici-pality groups showed values below 30‰ lb (Brazil, 2000) and the 34‰ lb mean rate of all WHO member countries15 (1999).
In 1980, at least 50% of deaths occurred within the post-neonatal period. With the decrease observed in this component, there is a relative shift in the propor-tion deaths towards the neonatal period, especially to the early neonatal period, corresponding to the first 7 days of life. Likewise, there was a marked decrease in the proportion of deaths due to infections and para-sitic diseases; endocrinal, metabolic, and nutritional diseases; and diseases of the respiratory system, which in together accounted for almost 70% of all infant deaths in 1980.
In 2000, with the reductions in the number of deaths due to these diseases, the proportion of deaths caused by conditions originating in the perinatal period rose to 60% of all infant deaths, across all groups. Szwarcwald et al13 compared the reductions in early neonatal and
post neonatal mortality rates registered several
Brazil-Table 3 – Exponential regression models for infant mortality rate and its components in Groups 1-5 and SPMA, 1980-2000.
Group M ortality rate β0 β1 IC 95% β1 r ²
(‰ live births)
Group 1 Early neonatal 19.02 -0.051 -0.0589 -0.0431 0.91
Late neonatal 5.78 -0.096 -0.1086 -0.0834 0.93
Post-neonatal 18.91 -0.114 -0.1265 -0.1015 0.95
Infant 44.78 -0.085 -0.0919 -0.0781 0.97
Group 2 Early neonatal 18.04 -0.040 -0.0500 -0.0300 0.75
Late neonatal 6.56 -0.097 -0.1127 -0.0813 0.90
Post-neonatal 16.70 -0.101 -0.1096 -0.0924 0.98
Infant 42.35 -0.075 -0.0797 -0.0703 0.98
Group 3 Early neonatal 15.58 -0.040 -0.0472 -0.0328 0.88
Late neonatal 4.73 -0.051 -0.0641 -0.0379 0.78
Post-neonatal 13.36 -0.089 -0.0977 -0.0803 0.96
Infant 34.13 -0.063 -0.0676 -0.0584 0.98
Group 4 Early neonatal 14.17 -0.026 -0.0349 -0.0171 0.66
Late neonatal 3.93 -0.034 -0.0430 -0.0250 0.73
Post-neonatal 12.12 -0.063 -0.0741 -0.0519 0.68
Infant 30.70 -0.041 -0.0475 -0.0345 0.90
Group 5 Early neonatal 13.37 -0.043 -0.0500 -0.0360 0.90
Late neonatal 4.13 -0.049 -0.0571 -0.0409 0.89
Post-neonatal 11.34 -0.080 -0.0884 -0.0716 0.95
Infant 29.19 -0.058 -0.0622 -0.0538 0.98
São Paulo Metropolitam Area
Early neonatal 14.44 -0.039 -0.0459 -0.0321 0.88
Late neonatal 4.46 -0.054 -0.0621 -0.0459 0.91
Post-neonatal 12.53 -0.081 -0.0892 -0.0728 0.96
Infant 31.76 -0.059 -0.0630 -0.0550 0.98
Source: Crude data: Seade Foundation and Ministry of Health - SIM/MS
β0:Intercept; β1: Mean Exponential Increase; IC β1: 95% Confidence Interval for β1; r
#
Rev Saúde Pública 2004;38(2) www.fsp.usp.br/rsp
Evolução da mortalidade Infantil em São Paulo, SP Holcman MM et al
ian states, including São Paulo, to results obtained in Japan, Chile, United States, and certain European coun-tries, concluding that the reductions achieved in these states were compatible with those of other countries only in terms of the post-neonatal component. The au-thors add that the countries listed only achieved such low levels of infant mortality (below 10‰ lb) after re-ducing the early neonatal component. As in developed countries, an important reduction in infant mortality in the SPMA will only occur when a reduction in the early neonatal component is achieved.
In all SPMA municipality groups, the greatest re-duction in mortality levels was observed in the post-neonatal component. In Guarulhos, the greatest trend towards reduction in the 1971-1998 period was reg-istered in the post-neonatal component.14 The
imple-mentation of a healthcare network and the improve-ments in supply which took place in that municipal-ity from the 1970’s on were pointed out as potential causes for this decrease.
In Botucatu (São Paulo state), inadequate water
sup-ply and low maternal schooling were associated to an increased risk of infant mortality.8 In the present study,
infants living in municipalities included in Groups 1 and 2 – which at the beginning of the period presented the worst sanitary conditions and the highest illiteracy rates – were also at the highest risk of dying. At the end of the period, with the improvements observed in these indicators, IMR levels were similar across the 5 groups.
An analysis of the trends observed in cause-specific mortality rates in the SPMA showed a greater reduction in the number of deaths due to infectious diseases in all groups, probably due to the increase in water supply and sewage network coverage. Monteiro and Nazário11
(1995), in a study of infant mortality in the city of São Paulo between 1973 and 1993 (which divided the city into 3 income-based regions) also concluded that dif-ferences in mortality distribution were less marked at the end of the period, especially due to increases in wa-ter supply in poor regions and the consequent decreases in the number of deaths by infectious diseases.
In Rio de Janeiro state, mortality rates decreased
un-Table 4 – Exponential regression models for infant mortality rates specific for the 5 main causes of death (IDC-9) in Groups 1-5 and SPMA, 1980-1991-5.
Group M ortality rate β0 β1 IC 95% β1 r2
(‰ live births)
Group 1 Infectious (1) 8.24 -0.1770 -0.2038 -0.1502 0.94
Endocrinal (2) 2.11 -0.1435 -0.1735 -0.1135 0.88
Resp. sys. (3) 10.62 -0.1071 -0.1325 -0.0817 0.85
Congenital (4) 2.77 -0.0230 -0.0383 -0.0077 0.42
Perinatal (5) 23.00 -0.0442 -0.0541 -0.0343 0.87
Group 2 Infectious (1) 7.46 -0.1616 -0.1786 -0.1446 0.97
Endocrinal (2) 1.89 -0.1468 -0.1724 -0.1212 0.92
Resp. sys. (3) 8.23 -0.0941 -0.1115 -0.0767 0.91
Congenital (4) 3.05 -0.0226 -0.0383 -0.0069 0.41
Perinatal (5) 22.26 -0.0301 -0.0428 -0.0174 0.65
Group 3 Infectious (1) 5.25 -0.1608 -0.1744 -0.1472 0.98
Endocrinal (2) 1.48 -0.1019 -0.1231 -0.0807 0.88
Resp. sys. (3) 7.42 -0.0873 -0.1023 -0.0723 0.92
Congenital (4) 2.88 -0.0121 -0.0200 -0.0042 0.44
Perinatal (5) 17.67 -0.0303 -0.0373 -0.0233 0.86
Group 4 Infectious (1) 4.62 -0.0855 -0.1077 -0.0633 0.83
Endocrinal (2) 1.21 -0.0290 -0.0654 0.0074* 0.17
Resp. sys. (3) 6.49 -0.0605 -0.0754 -0.0456 0.84
Congenital (4) 2.79 -0.0049 -0.0174 0.0076* 0.05
Perinatal (5) 15.47 -0.0079 -0.0143 -0.0015 0.34
Group 5 Infectious (1) 4.14 -0.1323 -0.1492 -0.1154 0.95
Endocrinal (2) 1.21 -0.1038 -0.1319 -0.0757 0.82
Resp. sys. (3) 6.62 -0.0783 -0.0910 -0.0656 0.93
Congenital (4) 2.92 -0.0007 -0.0052 0.0038* 0.01
Perinatal (5) 15.24 -0.0333 -0.0393 -0.0273 0.91
São Paulo M etropolitan Area
Infectious (1) 4.81 -0.1338 -0.1494 -0.1182 0.96
Endocrinal (2) 1.36 -0.0980 -0.1203 -0.0757 0.86
Resp. sys. (3) 7.03 -0.0790 -0.0919 -0.0661 0.93
Congenital (4) 2.90 -0.0052 -0.0090 -0.0014 0.39
Perinatal (5) 16.49 -0.0284 -0.0339 -0.0229 0.90
Source: Crude data: Seade Foundation and Ministry of Health - SIM/MS.
β0:Intercept; β1: Mean Exponential Increase; IC β1: 95% Confidence Interval for β1; r
2: determination coefficient.
(1) infectious and parasitic diseases (2) endocrinal, metabolic, and nutritional diseases and immune disorders (3) diseases of the respiratory system (4) congenital malformations (5) conditions originating in the perinatal period.
$ Rev Saúde Pública 2004;38(2) www.fsp.usp.br/rsp
Evolução da mortalidade Infantil em São Paulo, SP Holcman MM et al
REFEREN CES
1. Almeida M F, Novaes HM D, Alencar GP, Rodrigues LC. Mortalidade neonatal no município de São Paulo: influência do peso ao nascer e de fatores sócio-demográficos e assistenciais. Rev Bras Epidemiol 2002;5:93-107.
2. Carvalhaes M ABL, Parada CM GL, M anoel CM , Venâncio SY. Diagnóstico da situação do aleitamento materno em área urbana do sudeste do Brasil: utilização de metodologia simplificada. Rev Saúde Pública 1998;32:430-6.
3. [IBGE] Fundação Instituto Brasileiro de Geografia e Estatística. Censo demográfico 1980: dados distritais São Paulo. Rio de Janeiro; 1983. v. 1, T. 3, n. 17, T.6, n. 19 e T. 5, n. 19.
4. [IBGE] Fundação Instituto Brasileiro de Geografia e Estatística. Censo demográfico 2000. Resultados do Universo (Tabela 3.36.20) [on-line] Disponível em: http://w w w.ibge.gov.br [2002 mar]
5. Kleinbaun DG, Kupper LL, Muller KE. Applied regression analysis and other multivariable methods. Belmont: PSW-Kent Publishing Company; 1988.
6. Latorre MRDO, Cardoso MRA. Análise de séries temporais em epidemiologia: uma introdução sobre os aspectos metodológicos. Rev Bras Epidemiol 2001;4:145-52.
7. Leal M C, Szwarcwald CL. Evolução da mortalidade neonatal no Estado do Rio de Janeiro, Brasil (1979-1993): análise por grupo etário segundo região de residência. Rev Saúde Pública 1996;30:403-12.
8. Macharelli CA, Oliveira LR. Perfil de risco de crianças menores de um ano residentes em localida-de do estado localida-de São Paulo, Brasil, 1987. Rev Saúlocalida-de Pública 1991;25:121-8.
9. Martins CM, Almeida MF. Fecundidade e diferenciais intra-urbanos de desenvolvimento humano, São Paulo, Brasil, 1997. Rev Saúde Pública 2001;35:421-7.
10. Monteiro CA, Júnior IF, Conde WL. Evolução da assistência materno-infantil na cidade de São Paulo (1984-1996). Rev Saúde Pública 2000;34(6 Supl):19-25. equally between 1979 and 1993.7 The reductions reached
in the regions with highest IMRs were related to the post-neonatal component, which, according to the au-thors, was greatly influenced by the amplification of the public water supply network and of healthcare serv-ice coverage. Likewise, the decrease in IMR in the SPMA was more marked in regions where sanitation conditions were most deficient, due to the increase in the number of water supply connections registered dur-ing the study period. This happened in spite of the re-duction in purchasing power observed in the SPMA population. Other improvements in infant health indi-cators, such as increases in the duration of breastfeeding and in the percentage of children receiving immuniza-tion and improvements in antenatal care, are likely to have contributed towards the advancement of infant health as a whole.2,10 Reductions in fecundity – and
con-sequent reductions in the number of births – may also have contributed towards the decrease in IMR.9
Generally speaking, the analysis of IMRs in the São Paulo Metropolitan Area showed that public policies aimed at improving basic sanitary condi-tions have been effective in reducing post-neonatal mortality, which is due mainly to diseases related to the environment in which the child lives.
Almeida et al1 (2002), in an analysis of neonatal
mortality in the city of São Paulo, highlighted the association between socioeconomic conditions and the type of service used by pregnant mothers. These factors – combined with the relative increase in the proportion of deaths occurred in the early neonatal period and with the reduction of popula-tion-wide income levels, registered in the present study – indicate the need for a healthcare policy that prioritizes the improvement of services and personnel related to newborn and maternal care in the pre- and post-delivery periods, thus ensuring a more systematical surveillance of high-risk newborns. Access to these services, regardless of socioeconomic level, is likely to reduce the IMRs of all SPMA municipalities to levels compatible with those of developed countries.
%
Rev Saúde Pública 2004;38(2) www.fsp.usp.br/rsp
Evolução da mortalidade Infantil em São Paulo, SP Holcman MM et al
11. Monteiro CA, Nazário CL. Declínio da mortalidade infantil e eqüidade social: o caso da cidade de São Paulo entre 1973 e 1993. In: Monteiro CA. Velhos e novos males da saúde no Brasil: a evolução do país e suas doenças. São Paulo: Hucitec/ Nupens/ USP; 1995. p. 173-85.
12. Simões CC. Estimativas da mortalidade infantil por microrregiões e municípios. Brasília (DF): Ministério da Saúde; 1999.
13. Szwarcwald CL, Leal MC, Castilho EA, Andrade CLT. Mortalidade infantil no Brasil: Belíndia ou Bulgária? Cad Saúde Pública 1997;13:1-21.
14. Tomé EA, Latorre MRDO. Tendências da mortalidade infantil no município de Guarulhos: análise do período de 1971 a 1998. Rev Bras Epidemiol 2001;4:153-67.