Rev Saúde Pública 2014;48(5):797-807
The influence of health
expenditures on household
impoverishment in Brazil
Influência dos gastos em
saúde no empobrecimento de
domicílios no Brasil
I Programa de Pós-Graduação em Saúde Pública. Centro de Ciências da Saúde. Universidade Federal de Santa Catarina. Florianópolis, SC, Brasil
II Programa de Pós-Graduação em Epidemiologia. Universidade Federal de Pelotas. Pelotas, RS, Brasil
III Diretoria de Estudos Setoriais. Instituto de Pesquisa Econômica Aplicada. Brasília, DF, Brasil
IV Australian Research Centre for Population Oral Health. School of Dentistry. The University of Adelaide. Adelaide, Australia
Correspondence:
Alexandra Crispim Boing
Universidade Federal de Santa Catarina Centro de Ciências da Saúde Campus Universitário – Trindade 88034-500 Florianópolis, SC, Brasil E-mail: [email protected] Received: 8/30/2013 Approved: 4/7/2014
Article available from: www.scielo.br/rsp
ABSTRACT
OBJECTIVE: To analyze the variation in the proportion of households living below the poverty line in Brazil andthe factors associated with their impoverishment.
METHODS: Income and expenditure data from the Household Budget Survey, which was conducted in Brazil between 2002-2003 (n = 48,470 households) and 2008-2009 (n = 55,970 households) with a national sample, were analyzed. Two cutoff points were used to deine poverty. The irst cutoff is a per capita monthly income below R$100.00 in 2002-2003 and R$140.00 in 2008-2009, as recommended by the Bolsa Família Program. The second, which is proposed by the World Bank and is adjusted for purchasing power parity, deines poverty as per capita income below US$2.34 and US$3.54 per day in 2002-2003 and 2008-2009, respectively. Logistic regression was used to identify the sociodemographic factors associated with the impoverishment of households.
RESULTS: After subtracting health expenditures, there was an increase in households living below the poverty line in Brazil. Using the World Bank poverty line, the increase in 2002-2003 and 2008-2009 was 2.6 percentage points (6.8%) and 2.3 percentage points (11.6%), respectively. Using the Bolsa Família Program poverty line, the increase was 1.6 (11.9%) and 1.3 (17.3%) percentage points, respectively. Expenditure on prescription drugs primarily contributed to the increase in poor households. According to the World Bank poverty line, the factors associated with impoverishment include a worse-off inancial situation, a household headed by an individual with low education, the presence of children, and the absence of older adults. Using the Bolsa Família
Program poverty line, the factors associated with impoverishment include a worse-off inancial situation and the presence of children.
CONCLUSIONS: Health expenditures play an important role in the impoverishment of segments of the Brazilian population, especially among the most disadvantaged.
DESCRIPTORS: Health Expenditures. Poverty. Socioeconomic Factors. Social Conditions. Social Health Inequalities. Population Surveys.
Original Articles DOI:10.1590/S0034-8910.2014048005113
Alexandra Crispim BoingI
Andréa Dâmaso BertoldiII
Leila Garcia PosenatoII
Direct payment for the use of health services has been observed globally. However, the proportion of the popu-lation that pays the majority of the disbursement and the extent of private payment in inancing health vary substantially between rich and poor countries. While 38.0% of health expenditures are private in high-income countries, this percentage increases to 61.0% in low- and middle-income countries.12,17
In Brazil, household participation in health expendi-tures is signiicant, with private expenditure equaling 57.2% of the total expenditure in this sector in 2009.12
Despite having a universal, comprehensive, and equi -table public health system, Brazil is one of the few
RESUMO
OBJETIVO:Analisar a variação na proporção de domicílios vivendo abaixo da linha de pobreza no Brasil e os fatores associados ao empobrecimento.
MÉTODOS: Foram analisados os dados de despesa e renda das Pesquisas de Orçamentos Familiares conduzidas no Brasil em 2002-2003 (n = 48.470 domicílios) e 2008-2009 (n = 55.970 domicílios) com amostra representativa nacional. Foram utilizados dois pontos de corte para deinir pobreza. O primeiro, recomendado pelo Programa Bolsa-Família, considerou pobreza rendimento per capita mensal inferior a R$100,00 em 2002-2003 e a R$140,00 em 2008-2009. O segundo, proposto pelo Banco Mundial, incorpora a correção pela paridade do poder de compra, resultando em US$2,34 por dia, em 2002-2003, e US$3,54, em 2008-2009. Para identiicar os fatores sociodemográicos associados ao empobrecimento dos domicílios foi utilizada regressão logística.
RESULTADOS: Houve acréscimo de domicílios vivendo abaixo da linha de pobreza no Brasil após subtração dos gastos em saúde. Considerando-se a linha de pobreza recomendada pelo Banco Mundial, em 2002-2003 o acréscimo foi 2,6 pontos percentuais (ou 6,8%) e, em 2008-2009, 2,3 pontos percentuais (ou 11,6%). Considerando-se a linha de pobreza utilizada pelo Programa Bolsa-Família, a variação foi 1,6 (11,9%) e 1,3 (17,3%), respectivamente. Gastos com medicamentos foram os que mais contribuíram para o aumento de domicílios pobres. Os fatores associados ao empobrecimento, segundo a linha de pobreza do Banco Mundial, foram apresentar pior situação econômica, ser cheiado por indivíduo com baixa escolaridade, presença de crianças e ausência de idosos. Utilizando-se a linha de pobreza do Bolsa-Família, os fatores associados foram apresentar pior situação econômica e presença de crianças.
CONCLUSÕES: Os gastos em saúde apresentam importante inluência no empobrecimento de segmentos da população brasileira, sobretudo entre os mais desfavorecidos.
DESCRITORES: Gastos em Saúde. Pobreza. Fatores Socioeconômicos.
Condições Sociais. Desigualdades em Saúde. Inquéritos Demográicos.
INTRODUCTION
countries in the world in which private expenditures on health exceed government expenditures.17 The prospect
of dedicating a high proportion of household income to health expenditures can have a great impact on the population, discouraging people from using health services and causing them to disregard prescription drug therapies or postpone necessary exams.a Furthermore, a
household’s high private expenditure can have serious consequences, like a cut in the consumption of goods and services essential to daily life, exposing families to situations of social risk.12
Although the estimates of poverty do not usually consider healthcare payments, the increase in the
799
Rev Saúde Pública 2014;48(5):797-807
proportion of impoverished individuals makes it increasingly imperative to incorporate this type of expenditure into analyses, allowing an evaluation of its impact on the population.12,15
Annually, approximately 150 million people world-wide face catastrophic health expenditures,12 i.e., they
have to deal with health expenditures that exceed a pre-deined percentage of their total expenditures or their households’ ability to pay.16,18 Moreover, every year,
approximately 100 million people are pushed below the poverty line because of these expenditures.12
In African countries, like Kenya and Senegal, private health expenditures pushed more than 100,000 families below the poverty line in 2005.9 Research conducted
in 11 Asian countries indicated that health expendi-tures increased the proportion of people living below the poverty line by 2.7 percentage points, representing an increase of more than 78 million people living on less than US$1.00 a day after healthcare payments.15
The same phenomenon has been reported in China,10
India,5 Kenya,4 Vietnam,15 and Bangladesh,15 which
presented an increase from 1.1 to 3.8 percentage points in the proportion of impoverished individuals, upon subtracting private health expenditures from house-hold incomes.
Considering the relevance of this topic and the lack of studies that evaluate and monitor the role of health expenditure in the impoverishment of households in Brazil, this article aims to analyze the variation in the proportion of households below the poverty line in Brazil and the factors associated with their impoverishment.
METHODS
A cross-sectional study based on data from the 2002-2003 and 2008-2009 editions of the Pesquisa
de Orçamentos Familiares (POF – Household
Budget Survey) was conducted nationwide in urban and rural areas of Brazil by the Brazilian Institute of Geography and Statistics (IBGE).b,c The POF
conducted in 2002-2003 and 2008-2009 adopted two-stage cluster sampling. The primary sampling units were the census tracts from the geographic base of the 2000 Census, and the secondary sampling units were the permanent private households. In total, the
sample covered 48,470 households in 2002-2003 and 55,970 households in 2008-2009.b,c
The recall periods relating to expenditure data varied between seven days, 30 days, 90 days, and 12 months. All values were annualized and delated. The indexes used for delation as well as the reference dates are available in the IBGE publication.b,c The per capita
monetary and non-monetary values of per household income and expenditures were calculated using data from the income and expenditure questionnaires.
The poverty line was defined using two different cutoff points. The irst was the deinition proposed by the World Bank, which classiies a poor person as someone who survives on less than US$2.00 per day.6,d
The dollar was adjusted for purchasing power parity (PPP), resulting in values of US$2.34 for 2002-2003 and US$3.54 for 2008-2009. To convert the value of the dollar, a value of R$3.32 on January 15, 2002-2003 and R$2.38 on January 15, 2008-2009 was used. The second cutoff point was adopted by the Brazilian federal government under the Bolsa Família Program, with the values that deined poverty being equal to or below R$100.00 (US$30.1)e per month in 2002-2003
and R$140.00 (US$58.8) per month in 2008-2009.f,g
To estimate the inluence of health expenditures on the proportion of households below the poverty line in Brazil in 2002-2003 and 2008-2009, the total monthly income per household was calculated after subtracting the total health expenditure. The value obtained was divided by the number of residents and then divided by 30 to obtain the household’s daily per capita value, in the case of the World Bank cutoff. For Bolsa Família, the monthly value was used; hence, the abovemen-tioned division was not necessary. Thus, with the daily
per capita value for the World Bank cutoff point and the monthly per capita value for the Bolsa Família
cutoff point, it was possible to measure the propor-tion of households below the poverty line. Moreover, the same procedure was performed for each separate health expenditure item (such as prescription drugs, health plan, dental consultation and treatment, outpa-tient treatment, surgical services, hospitalization, tests, and treatment material) to identify the groups of expenditures that most contributed to the varia-tion in the proporvaria-tion of poverty. Using these values, the proportions of households below the poverty line before subtracting total health expenditures, i.e.,
b Instituto Brasileiro de Geografia e Estatística. Pesquisa de Orçamentos Familiares 2002-2003: primeiros resultados: Brasil e grandes regiões. Rio de Janeiro; 2004.
c Instituto Brasileiro de Geografia e Estatística. Pesquisa de Orçamentos Familiares 2008-2009: antropometria e estado nutricional de crianças, adolescentes e adultos no Brasil. Rio de Janeiro; 2010.
d World Bank. Poverty data: a supplement to World Development Indicators 2008. Washington (DC); 2008. e US$1.00 was considered equal to R$3.32 on January 15, 2002-2003 and R$2.38 on January 15 2008-2009.
f Brasil. Lei nº 10.836, de 9 de janeiro de 2004. Cria o Programa Bolsa Família e dá outras providências. Diario Oficial Uniao, Brasília, DF. 12 jan. 2004. p.1
considering only income and after subtracting the total health expenditures were compared.5,15
The proportions of households living below the poverty line were described by geographic location (urban and rural); macro region (North, Northeast, Southeast, South, and Midwest); the household head’s gender (male and female); the household head’s education (complete years of study, which are categorized into zero to four, ive to eight, nine to 11, and 12 or more years); National Economic Indicator (IEN),1
catego-rized into quintiles, with Q1 the poorest quintile and Q5 the richest quintile; possession of a health plan (yes/no); the presence of children residing in the house (yes/no); and the presence of older adults residing in the house (yes/no).
Furthermore, the factors associated with the condition of a household being pushed below the poverty line after subtracting health expenditures in 2008-2009 were identiied. The dichotomous outcome (yes/no) comprised households that were not below the poverty line, according to the World Bank and Bolsa Família
cutoff points, but which moved below the poverty line after subtracting the health expenditures. The explor-atory variables to conduct the description of the propor-tion of households living below the poverty line in Brazil were the same as those mentioned. Bivariate and multivariate analyses were performed using condi-tional logistic regression. The exploratory variables that presented a value of p < 0.20 in the bivariate analysis were included in the multivariate model, and those with p < 0.20 were maintained in the inal model, as an adjustment for confounding variables. The model’s it was tested with the Hosmer-Lemeshow test.8
The data were analyzed using the statistical program Stata 11, considering the effect of the study design and the sample weights. This study used secondary data, without identifying the subjects, thus meeting the current Brazilian regulations governing research involving human beings.
RESULTS
The sample included 48,470 households in the 2002-2003 POF and 55,970 households in the 2008-2009 POF. In 2002-2003, 78.0% of the interviewed households were concentrated in urban areas, 26.1% of which were headed by women and 60.2% by people over the age of 40. Among the residents, children were part of 40.2% of households, and almost one in four had older adults. In 2008-2009, there was an increase in the households headed by women (30.5%) and by people over the age of 40 (64.1%), and households witholder adult residents (27.1%). There was little variation in households
with children (40.7%) and households located in urban areas of the country (76.7%) (data not shown).
In the two biennia, there was a higher proportion of poor households in rural areas, in the North and Northeast regions of the country, those with a worse IEN (irst quintile), with children among the residents, among those whose household heads had little educa-tion, and among those who did not have a health plan. Comparing the years 2002-2003 and 2008-2009, there is a signiicant reduction in households living below the poverty line, according to the different cutoff points adopted (Table 1).
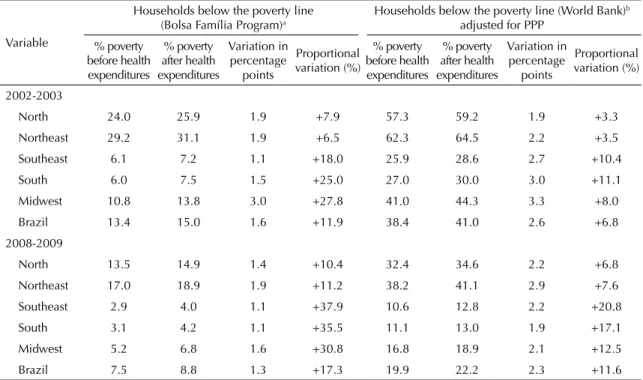
In analyzing the effect of health payments on impover-ishment in Brazil (Table 2), in 2002-2003, there was an increase of 11.9% using the Bolsa Família cutoff point and an increase of 6.8% using the World Bank cutoff in the total number of households whose per capita
income was below the poverty line after incurring health expenditures. Using the Bolsa Família cutoff point, the greatest increase was observed in the Midwest region (27.8%), and the smallest was observed in the Northeast (6.5%). Despite the overall decrease in house-holds below the poverty line in 2008-2009, there was a signiicant increase in impoverished households after incurring heath expenditures, reaching 17.3% using the cutoff point proposed by the Bolsa Família and 11.6% using the cutoff point deined by the World Bank. The North, Northeast and Midwest regions showed the greatest increase, i.e., an increase between two and three percentage points between 2002-2003 and 2008-2009.
When the effect of different health expenditures on the impoverishment of households was analyzed, prescrip-tion drug expenditures were responsible for 60.9% of the increase in below poverty line households in 2002-2003. Health plan expenditures corresponded to 11.1%, and the rest of the items together corresponded to 28.0%. For the 2008-2009 biennium, prescription drugs represented 65.7%, health plans represented 2.6%, and the total of the other items represented 31.7% of the increase (Figure).
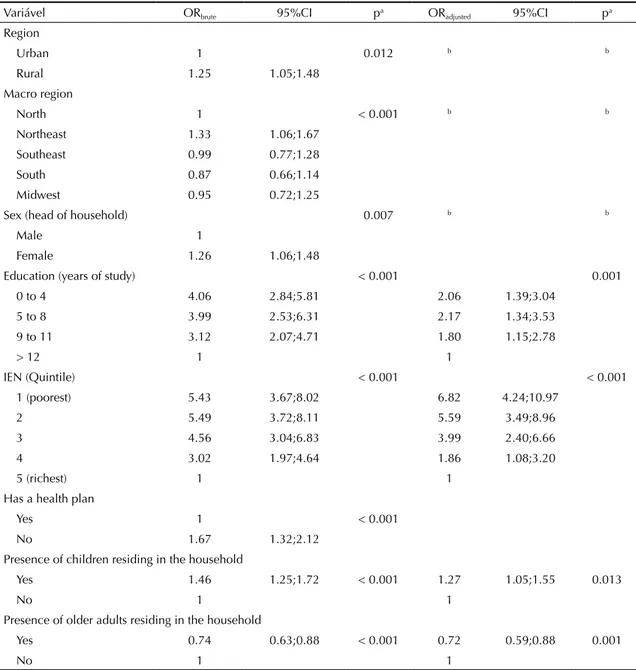
Having analyzed the factors associated with impover-ishment after considering health expenditures using the World Bank cutoff point, bivariate analyses indicated that the chance of impoverishment was greater in house-holds in rural areas of the Northeast region compared with the North region; in households where the head of household was a woman, was among the less educated, was among the poorest, and who did not have a health plan; and in households where there was at least one child and no older adult residents (Table 3).
801
Rev Saúde Pública 2014;48(5):797-807
Table 1. Description of the sample and proportion of households considered below the poverty line, according to two cutoff points. Brazil, 2002-2003 and 2008-2009.
Variable
Proportion of households living below the poverty line – % and 95%CI
2002-2003 2008-2009 Cutoff points proposed by the Bolsa Família Program – monthly values Cutoff points proposed by the World Bank adjusted forPPP – daily values
n % n % 2002-2003R$100.00 95%CI 2008-2009R$140.00 95%CI 2003-2002US$2.34 95%CI 2008-2009US$3.54 95%CI Region
Urban 37,830 84.7 42,948 84.4 10.4 9.9;10.8 5.4 5.1;5.6 33.7 32.9;34.4 16.2 15.7;16.6 Rural 10,640 15.3 13,022 15.6 30.4 29.3;31.4 18.9 18.0;19.9 64.4 63.3;65.6 39.8 38.6;40.9 Macro region
North 6,868 6.5 7,611 6.8 24.0 22.6;25.3 13.5 12.5;14.4 57.3 55.8;58.9 32.4 31.0;33.7 Northeast 18,624 25.2 19,232 26.1 29.2 28.4;30.0 17.0 16.3;17.6 62.3 61.4;63.2 38.2 37.3;39.1 Southeast 8,643 45.1 14,078 44.1 6.1 5.4;6.8 2.9 2.5;3.3 25.9 24.6;27.2 10.6 9.9;11.3
South 6,102 16.0 6,716 15.4 6.0 5.3;6.7 3.1 2.6;3.5 27.0 25.8;28.2 11.1 10.2;11.9
Midwest 8,233 7.2 8,333 7.6 10.8 10.0;11.6 5.2 4.6;5.8 41.0 39.8;42.3 16.8 15.8;17.8 Sex (head of household)
Male 35,841 73.7 38,882 69.1 14.0 13.5;14.5 7.5 7.2;7.8 39.1 38.2;39.9 20.0 19.5;20.6 Female 12,629 26.3 17,088 30.9 11.4 10.6;12.2 7.5 7.0;8.0 36.3 35.0;37.7 19.4 18.6;20.3 Education (years of study)
0 to 4 25,769 48.5 25,545 52.8 20.8 20.1;21.5 11.7 11.2;12.2 52.6 51.6;53.7 28.4 27.6;29.2 5 to 8 10,038 22.6 3,324 7.3 11.3 10.3;12.2 10.4 9.1;11.7 39.4 37.8;41.1 27.7 25.6;29.7
9 to 11 8,303 17.9 8,082 18.5 3.8 3.2;4.4 8.4 7.5;9.2 19.0 17.6;20.3 24.4 23.0;25.7
> 12 4,360 11.1 7,245 21.2 1.1 0.7;1.5 1.5 1.1;1.9 4.9 4.0;5.7 4.1 3.6;4.7
IEN (Quintile)
1 (poorest) 19,255 32.2 13,990 20.2 30.7 29.7;31.7 20.0 19.1;20.9 65.6 64.4;66.8 43.6 42.4;44.8 2 9,375 18.4 12,046 18.8 12.8 11.7;13.8 10.7 10.0;11.5 49.1 47.4;50.8 31.4 30.3;32.6
3 8,687 18.8 11,195 19.4 4.8 4.1;5.5 4.5 3.9;5.0 31.6 30.0;33.3 17.2 16.2;18.3
4 6.364 17.3 9,621 20.9 1.0 0.6;1.4 1.1 0.8;1.4 11.1 9.8;12.3 5.6 5.0;6.2
5 (richest) 4.398 13.3 7,859 20.7 0.4 0.08;0.6 0.2 0.07;0.4 2.4 1.5;3.2 1.0 0.8;1.3 Has a health plan
Yes 8,675 24.2 9,882 25.0 0.9 0.7;1.1 0.6 0.4;0.8 8.5 7.6;9.4 2.8 2.3;3.2
No 39,795 75.8 46,088 75.0 17.4 16.9;18.0 9.8 9.4;10.2 47.9 47.0;48.7 25.5 25.0;26.1 Presence of children residing in the household
Yes 20,553 42.4 22,781 38.1 24.2 23.3;25.1 14.9 14.3;15.6 57.3 56.1;58.6 35.6 34.7;36.5
No 27,917 57.6 33,781 61.9 6.3 5.9;6.7 2.9 2.7;3.1 25.9 25.1;26.7 10.2 9.7;10.6
Presence of older adults residing in the household
Yes 11,613 24.0 15,173 27.7 7.3 6.7;7.9 9.3 9.0;9.7 30.5 29.2;31.8 10.5 9.9;11.1
No 36,857 76.0 40,797 72.3 15.4 14.9;15.9 2.7 2.3;3.0 40.9 40.0;41.8 23.4 22.9;24.0
less educated; approximately 27.0% higher in house-holds with the presence of children; and 39.0% lower in households with older adult residents. The Hosmer-Lemeshow test (p = 0.569) showed that the model used had a good it.
Having analyzed the factors associated with impover-ishment after considering health expenditures using the
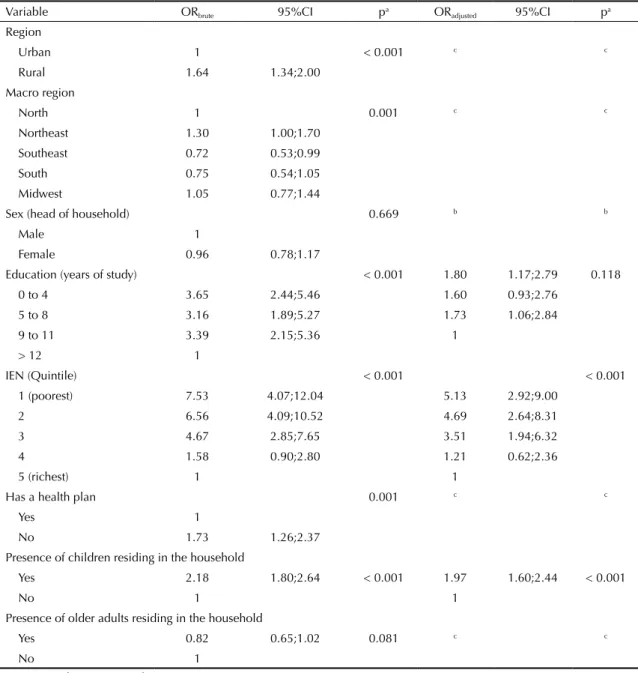
Bolsa Família cutoff point, bivariate analyses identi-ied results similar to those found when using the World Bank cutoff point (Table 4). In the adjusted analysis, the chance of a household being pushed below the poverty line was approximately ive times higher in households belonging to the poorest quintile and approximately two times higher in households with children. The model was considered appropriate according to the Hosmer-Lemeshow test (p = 0.156).
DISCUSSION
This study observed a substantial increase in the proportion of households below the poverty line after subtracting health expenditures from their incomes. The main reason for this phenomenon was expenditures on prescription drugs. Households located in urban areas with a poor economic condition and with the presence of children were the most affected.
When considering the cutoff point for the World Bank poverty line,6 adjusted by PPP, this study found that
health expenditures increased the proportion of house-holds below the poverty line in Brazil by 2.6% in 2002-2003 and 2.3% in 2008-2009. Direct comparisons of these values with those reported in studies conducted
in other countries cannot be made because the method-ologies employed to constitute health expenditures, the income earned by households, and the cutoff points to deine poverty vary among the studies. Nevertheless, all studies have reported similar results, highlighting the deleterious effect of health expenditures on the economic status of families in different countries. Van Doorslaer et al15 (2006) analyzed household budget and
expenditure data from 11 Asian countries and found that after deducting health expenditures, extreme poverty increased 2.7%, and poverty increased 2.0%. There was a large discrepancy in the values for each country; the most signiicant proportional variation was observed in Bangladesh (3.8% and 3.6% higher, respectively). Garg & Karam5 (2009) identiied a 3.3% increase in India’s
poverty when considering health expenditures, and in Kenya, Chuma & Maina4 (2012) found a 2.7% increase,
representing 1.98 million individuals who were pushed below the poverty line due to health expenditures.
The increase in the proportion of households below the poverty line due to health expenditures is directly related to high private expenditures in the sector. In Brazil, the percentage share of health expenditures in relation to total household expenditures was 4.2% in 1974-1975; in 2002-2003, it increased to 6.5%, and in 2008-2009, it increased to 7.2%.b,c This high volume of private
expen-ditures in the sector may indicate that the Brazilian Uniied Health System (SUS) is unable to fully respond to the population’s needs,11 leading individuals to resort
to the private sector, either through direct disbursement or health plans, to, for example, use health services and/ or have access to prescription drugs.11
Figure. Each health expenditure item’s contribution to impoverishment. Brazil, 2002-2003 and 2008-2009.
Prescription drugs
Plan
Treatment material
Dental consultation and treatment
Doctor’s appointment
Exams
Other health expenditures
Surgical service
Hospitalization
Outpatient medical treatment
More than one expenditure group
0 10 20
2008-2009 2002-2003
803
Rev Saúde Pública 2014;48(5):797-807
Another point to be emphasized is the socioeco-nomic inequality in dedicating income to health expenditures. In absolute terms, the rich spend more on health; however, the proportion of these expen-ditures relative to income is substantially higher among the poor.a Considering the heavier weight of
health expenditures on the poorest strata of society, the subtraction of these values from the total income should have important effects on poverty. Individuals near the poverty line have a high probability of being driven below the poverty line by the need to shoulder health expenditures.
According to the World Health Organization12 (WHO),
impoverishment due to health expenditures occurs in countries of all income levels, but is higher in those with higher private health expenditures. Also, according to WHO,12 private spending in the sector should be less
than 20.0% to minimize the impoverishment resulting from health expenditures. Even though Brazil has a public, universal, and equitable health care system among its principles, it paradoxically has low public investment in the sector (approximately 43.6% in 2009). In addition, the SUS faces problems with guaranteeing access to specialized services as well as a shortage of doctors in public facilities in poor regions and even in the country’s largest cities. This situation is exacerbated by social problems, such as poverty, inequality, and low levels of education and sanitation.11 Thus, inancing
and eficient management are required to strengthen the SUS, as well as an expansion of social policies of income transfer, like the Bolsa Família Program, which ight poverty and encourage improvements in education and health, promoting the development of human capital.
Studies have shown that the private sector, in different contexts, does not protect people from impoverishment and catastrophic health expenditures.18 One illustration
of this fact is the personal bankruptcies caused by health expenditures in the United States;7 data from 2008
indi-cate that health expenditures contributed to 62.0% of these failures. Although many individuals have health insurance, it not enough to protect them from the high costs of direct payments and copayments.7 In the
Brazilian context, Barros et al2 (2011) also found that
health insurance does not protect the population from catastrophic expenses.
Data from this study indicated that among the health expenditures, prescription drug costs were primarily responsible for the increase in poverty. This result relects the high proportion of prescription drugs in total health expenditures, especially in the poorest households. According to the IBGE,c prescription drugs
accounted for 48.6% of the total health expenditures in the Brazilian population in 2008-2009, a value that reached 76.4% in the poorest decile.c
Table 2. Proportion of households below the poverty line before and after considering health expenditures according to macro region. Brazil, POF 2002-2003 and 2008-2009.
Variable
Households below the poverty line (Bolsa Família Program)a
Households below the poverty line (World Bank)b
adjusted for PPP % poverty
before health expenditures
% poverty after health expenditures
Variation in percentage
points
Proportional variation (%)
% poverty before health expenditures
% poverty after health expenditures
Variation in percentage
points
Proportional variation (%)
2002-2003
North 24.0 25.9 1.9 +7.9 57.3 59.2 1.9 +3.3 Northeast 29.2 31.1 1.9 +6.5 62.3 64.5 2.2 +3.5 Southeast 6.1 7.2 1.1 +18.0 25.9 28.6 2.7 +10.4 South 6.0 7.5 1.5 +25.0 27.0 30.0 3.0 +11.1 Midwest 10.8 13.8 3.0 +27.8 41.0 44.3 3.3 +8.0 Brazil 13.4 15.0 1.6 +11.9 38.4 41.0 2.6 +6.8 2008-2009
North 13.5 14.9 1.4 +10.4 32.4 34.6 2.2 +6.8 Northeast 17.0 18.9 1.9 +11.2 38.2 41.1 2.9 +7.6 Southeast 2.9 4.0 1.1 +37.9 10.6 12.8 2.2 +20.8 South 3.1 4.2 1.1 +35.5 11.1 13.0 1.9 +17.1 Midwest 5.2 6.8 1.6 +30.8 16.8 18.9 2.1 +12.5 Brazil 7.5 8.8 1.3 +17.3 19.9 22.2 2.3 +11.6 PPP: Purchasing power parity
In fact, access to prescription drugs is still a problem that needs to be resolved in the health sector, in spite of public policy advances in the area. For example, between 2002 and 2007, there was a 222.0% increase in the Ministry of Health’s total expenditure on prescrip-tion drugs.14 However, an analysis performed on data
from the 2008 National Household Sample Survey found that only 45.3% of SUS users who received prescriptions obtained all the prescription drugs free in the health service.3 Among those who did not receive
them through the SUS, 78.1% had to acquire them through the private sector.3 The North, Northeast, and
Midwest regions have the lowest access to prescrip -tion drugs when compared with the others;3 these are
the same regions that, in this study, were identiied with greater impoverishment when health expenditures were considered.
With the aim of expanding access to essential continuous prescription drugs and reducing private expenditures, the federal government created the Popular Pharmacy Program in 2004. Through this program, the population can buy certain prescription drugs through co-participa-tion, where the government bears 90.0% of the cost, and
Table 3. Factors associated with impoverishment due to health expenditures, considering the World Bank poverty line adjusted for PPP as the cutoff point (US$3.54 per day). Brazil, 2008-2009.
Variável ORbrute 95%CI pa ORadjusted 95%CI pa
Region
Urban 1 0.012 b b
Rural 1.25 1.05;1.48 Macro region
North 1 < 0.001 b b
Northeast 1.33 1.06;1.67 Southeast 0.99 0.77;1.28 South 0.87 0.66;1.14 Midwest 0.95 0.72;1.25
Sex (head of household) 0.007 b b
Male 1
Female 1.26 1.06;1.48
Education (years of study) < 0.001 0.001 0 to 4 4.06 2.84;5.81 2.06 1.39;3.04
5 to 8 3.99 2.53;6.31 2.17 1.34;3.53 9 to 11 3.12 2.07;4.71 1.80 1.15;2.78
> 12 1 1
IEN (Quintile) < 0.001 < 0.001
1 (poorest) 5.43 3.67;8.02 6.82 4.24;10.97
2 5.49 3.72;8.11 5.59 3.49;8.96
3 4.56 3.04;6.83 3.99 2.40;6.66
4 3.02 1.97;4.64 1.86 1.08;3.20
5 (richest) 1 1
Has a health plan
Yes 1 < 0.001
No 1.67 1.32;2.12
Presence of children residing in the household
Yes 1.46 1.25;1.72 < 0.001 1.27 1.05;1.55 0.013
No 1 1
Presence of older adults residing in the household
Yes 0.74 0.63;0.88 < 0.001 0.72 0.59;0.88 0.001
No 1 1
PPP: Purchasing power parity; IEN: National economic indicator
a Wald test.
805
Rev Saúde Pública 2014;48(5):797-807
the citizen bears the rest. However, co-participation and payment experiences are highly inequitable because the payment participation value is ixed for all users, i.e., it more strongly penalizes the poorest. Furthermore, an analysis of the origin of the population served by the Popular Pharmacy Program identiied a signiicant proportion of users originating from the SUS (46.0%).13
These data may relect problems in the provision of prescription drugs in the public sector, which causes millions of people to resort to the private sector or to
payment participation to gain access to prescription drugs. Santos-Pinto et al13 (2011) pose the following factors as
hypotheses for major access to the Popular Pharmacy Program by users originating from the SUS: a shorter distance than the local health unit; a shorter wait time for the prescription drug or for being attended at the time of dispensing the consumable; and a greater availability of prescription drugs in the Popular Pharmacy Program.13
In 2011, the government launched the “Health is price-less” campaign, which began to make prescription drugs
Table 4. Factors associated with impoverishment due to health expenditures, considering the Bolsa Família poverty line as the cutoff point (R$140.00 monthly per capita). Brazil, 2008-2009.
Variable ORbrute 95%CI pa ORadjusted 95%CI pa
Region
Urban 1 < 0.001 c c
Rural 1.64 1.34;2.00 Macro region
North 1 0.001 c c
Northeast 1.30 1.00;1.70 Southeast 0.72 0.53;0.99 South 0.75 0.54;1.05 Midwest 1.05 0.77;1.44
Sex (head of household) 0.669 b b
Male 1
Female 0.96 0.78;1.17
Education (years of study) < 0.001 1.80 1.17;2.79 0.118 0 to 4 3.65 2.44;5.46 1.60 0.93;2.76
5 to 8 3.16 1.89;5.27 1.73 1.06;2.84
9 to 11 3.39 2.15;5.36 1
> 12 1
IEN (Quintile) < 0.001 < 0.001
1 (poorest) 7.53 4.07;12.04 5.13 2.92;9.00
2 6.56 4.09;10.52 4.69 2.64;8.31
3 4.67 2.85;7.65 3.51 1.94;6.32
4 1.58 0.90;2.80 1.21 0.62;2.36
5 (richest) 1 1
Has a health plan 0.001 c c
Yes 1
No 1.73 1.26;2.37
Presence of children residing in the household
Yes 2.18 1.80;2.64 < 0.001 1.97 1.60;2.44 < 0.001
No 1 1
Presence of older adults residing in the household
Yes 0.82 0.65;1.02 0.081 c c
No 1
IEN: National economic indicator
a Wald test.
b Excluded from the analysis for presenting p > 0.20.
for hypertension, diabetes, and asthma available for free in the Popular Pharmacy Program. Additional research is needed to assess the impact of this program on private spending and the impoverishment of households.
This study showed that apoor inancial condition, poor education, and the presence of children in the house-hold were the factors associated with impoverish-ment. Corroborating these indings, research suggests that families with children and poor, sick, or disabled members are more susceptible to expenditures, gener-ating catastrophic consequences.h
With regard to the study’s limitations, the data are from a cross-sectional household survey. For this
type of study, longitudinal approaches are more appropriate for capturing expenditures and their impact on the impoverishment of families with higher reliability.5 Another important limitation is
related to the method for calculating the poverty line, for which the cutoff points are defined using a degree of arbitrariness. However, the POF has national coverage, collecting extremely detailed data with recognized quality.b,c
The results reinforce the importance of using national data produced in the POF to monitor aspects related to health and health expenditures for the development and evaluation of health policies aimed at ensuring the population’s protection from impoverishment.
807
Rev Saúde Pública 2014;48(5):797-807
1. Barros AJD, Victora CG. Indicador econômico para o Brasil baseado no censo demográfico de 2000. Rev Saude Publica. 2005;39(4):523-9. DOI:10.1590/S0034-89102005000400002 2. Barros AJD, Bastos JL, Dâmaso AH. Catastrophic
spending on health care in Brazil: private health insurance does not seem to be the solution.
Cad Saude Publica. 2011;27(Suppl 2):S254-62. DOI:10.1590/S0102-311X2011001400012 3. Boing AC, Bertoldi AD, Boing AF, Bastos JL, Peres
KG. Acesso a medicamentos no setor público: análise de usuários do Sistema Único de Saúde no Brasil. Cad Saude Publica. 2013;29(4):691-701. DOI:10.1590/S0102-311X2013000400007
4. Chuma J, Maina T. Catastrophic health care spending and impoverishment in Kenya. BMC Health Serv Res. 2012;12(1):413. DOI:10.1186/1472-6963-12-413 5. Garg CC, Karan AK. Reducing out-of-pocket
expenditures to reduce poverty: a disaggregated analysis at rural-urban and state level in India. Health Policy Plan. 2009;24(2):116-28. DOI:10.1093/heapol/czn046
6. Haughton JH, Khandker SR. Handbook on poverty and inequality. Washington (DC): The World Bank; 2009. 7. Himmelstein DU, Thorne D, Warren W, Woolhandler S.
Medical bankruptcy in the United States, 2007: results of a national study. Am J Med. 2009;122(8):741-6. DOI:10.1016/j.amjmed.2009.04.012
8. Hosmer DW, Lemeshow S. Applied logistic regression. New York: John Wiley & Sons; 1989. p.140-5. 9. International Labour Office, Social Protection
Department. Social health protection: an ILO strategy towards universal access to health care. Geneva; 2008. (Social Security Policy Briefings. Paper 1).
10. Liu Y, Rao K, Hsiao WC. Medical expenditure and rural impoverishment in China. J Health Popul Nutr. 2003;21(3):216-22.
11. Ocké-Reis CO. SUS o desafio de ser único. Rio de Janeiro: Editora Fiocruz; 2012.
12. Organização Mundial de Saúde. Relatório mundial da saúde: o financiamento da cobertura universal. Genebra; 2010.
13. Santos-Pinto CDB, Costa NR, Osorio-de-Castro CGS. Quem acessa o Programa Farmácia Popular do Brasil? Aspectos do fornecimento público de medicamentos.
Cienc Saude Coletiva. 2011;16(6):2963-73. DOI:10.1590/S1413-81232011000600034 14. Vieira FS. Gasto do Ministério da Saúde com
medicamentos: tendência dos programas de 2002 a 2007. Rev Saude Publica. 2009;43(4):674-81. DOI:10.1590/S0034-89102009005000041 15. Van Doorslaer E, O’Donnell O, Rannan-Eliya RP,
Somanathan A, Adhikari SR, Garg CC, et al. Effect of payments for health care on poverty estimates in 11 countries in Asia: an analysis of household survey data. Lancet. 2006;368(9544):1357-64. DOI:10.1016/S0140-6736(06)69560-3 16. Wagstaff A, Van Doorslaer E. Catastrophe and
impoverishment in paying for health care: with applications to Vietnam 1993-1998. Health Econ. 2003;12(11):921-33. DOI:10.1002/hec.776
17. World Health Organization. Global health expenditure atlas. Geneva; 2012.
18. Xu K, Evans DB, Kawabata K, Zeramdini R, Klavus J, Murray CJL. Household catastrophic health expenditure: a multicountry
analysis. Lancet. 2003;362(9378):111-7. DOI:10.1016/S0140-6736(03)13861-5 REFERENCES
Article based on the doctoral thesis of Boing AC, titled: “Desigualdade socioeconômica nos gastos catastróficos em saúde no Brasil: análise da Pesquisa de Orçamentos Familiares 2002-3 e 2008-9”, presented to the Programa de Pós-Graduação em Saúde Coletiva, Universidade Federal de Santa Catarina, in 2013.