SAGE Open
July-September 2013: 1 –15 © The Author(s) 2013 DOI: 10.1177/2158244013495543 sgo.sagepub.com
Article
Introduction
One of the Healthy People 2020 goals is to “increase the pro-portion of adults who are at a healthy weight and reduce the proportion of adults who are obese” (U.S. Department of Health and Human Service, 2010). Obesity is a major health concern that continues to increase at significant rates and has been associated with increased risks for chronic disease and health problems among immigrants (Landis, Murray, Bolden, & Wingo, 1999; Novotny, Williams, Vinoya, Oshiro, & Vogt, 2009). Nurses who are serving special populations such as immigrant populations need to consider the social and cul-tural factors that can influence health problems (Javier, Huffman, & Mendoza, 2007). Policy and politics play a major role in the promotion of health encapsulating how individuals and communities can be empowered to improve the immi-grants’ health. Nurses and other health care providers have a major role to play in promoting the health of their client groups and are seen as advocates, enabling and advising their clients on their health and well-being (Coverdale, 2010).
With immigration, a multitude of changes can occur. These changes may include access to health care, quality of health care, physical activity, and diet. Recent literature has focused on the analysis of dietary patterns as a method of investigating the role of foods in studies among Asian American immigrants (Kudo, Falciglia, & Couch, 2000;
Pierce et al., 2007). In particular, adoption of diets high in fat and sugar, and low in fruits and vegetables is of concern because this dietary pattern is a risk factor for several major chronic conditions (Kim, Lee, Ahn, Bowen, & Lee, 2007; Satia-Abouta, Patterson, Neuhouser, & Elder, 2002).
The emergence of nutrition transition is observed when people move from one culture to another leading to changes in food choices as in the case of some newcomers from rural areas of their native countries that migrated to urban areas of host countries (Hughes & Lawrence, 2005; Keita, Casazza, Thomas, & Fernandez, 2009; Satia, 2010). Nutrition transi-tion is characterized by switching in the consumptransi-tion of energy-dense and processed food that can also involve high fat/sugar intake; moving away from naturally nutritious meals such as lesser consumption of fruits, vegetables, and whole grains; and more consumption of meals and snacks outside the home (Novotny et al., 2009; Satia, 2010). This transformation can be immediate if there are no traditional foods available in the new culture (Kittler & Sucher, 2004).
1
Gardner-Webb University, Boiling Springs, NC, USA
2
University of Hawaii at Manoa, HI, USA
Corresponding Author:
Susan H. Lane, Gardner-Webb University, P.O. Box 7309, Boiling Springs, NC 28017, USA.
Email: [email protected]
Dietary Acculturation and Predictors
of Anthropometric Indicators Among
Filipino Americans
Reimund C. Serafica
1, Susan H. Lane
1and Clementina D.
Ceria-Ulep
2Abstract
The aim of this study was to explore the relationship of the demographic variables, level of acculturation, dietary consumption of fat, sugar, fruits and vegetables and dietary acculturation to the anthropometric measurement of Filipino Americans (FAs) in the United States. The study sample consisted of 128 FAs (N = 128) residing in the southeastern part of the United States. Participants completed the demographics, the Block’s Short Food Frequency Questionnaire (SFFQ), a Short Acculturation Scale for Filipino Americans (ASASFA), and the Dietary Acculturation Questionnaire for Filipino Americans (DAQFA). Anthropometric measurements (waist circumference, hip circumference, weight, and height) were also taken. Descriptive statistics analyses and partial least squares (PLS) were used to explore the predictive relationships among the variables constructed. The most important positive predictors of the anthropometric indicators were the Western Scale (path coefficient = .503, p< .05) and the intake of fats and sugars (path coefficient = .282, p< .05).
Keywords
Owing to lack of familiarity and awareness to healthy food choices, many newcomers to the United States face prob-lems, stress, and confusion about their food choices.
The U.S. Census Bureau determined that in 2010, Filipino Americans (FAs) numbered 2,555,923, and it is estimated that FAs are the third largest Asian ethnic group in the United States (Gryn & Gambino, 2012). This statistic is a 32% increase from 1990 and 137% increase from 1980 (Chung et al., 2007; NaFFAA, 2011). This change is due to waves of immigration from the Philippines that can be characterized as individual search for economic opportunities and family reunifications (de Castro, Gee, & Takeuchi, 2008). As the FA population continues to increase rapidly, it is important to understand their dietary consumption and its relationship to their level of acculturation. It is also imperative to prioritize culturally appropriate nutritional awareness as part of nurs-ing interventions in primary care and community settnurs-ings.
This study sought to answer the research question: Do demographic variables, level of acculturation, dietary con-sumption of fat, sugar, fruits, and vegetables, dietary accul-turation predict anthropometric measurement levels among FAs in the United States? The evidence produced by this study will improve understanding of the current dietary prac-tices and acculturation among Filipino immigrants and will aid in developing effective educational interventions in the maintenance of healthy weight and the prevention of obesity.
Literature Review
The process of acculturation is multidimensional, focusing on overall adaptation of groups and individuals to a new society; change within the process of acculturation may include cultural, psychological, social, economic, and politi-cal factors (Lee, Sobal, & Frongillo, 1999; Satia, 2010). Research indicates that cultural changes are associated with a positive influence in nutrition for some and negative effects for others (Gray, Cossman, Dodson, & Byrd, 2005). The relationship of acculturation to the burden of health-related chronic conditions is important due to rising numbers of FAs in the United States and with chronic disease conditions. Acculturation of FAs may influence dietary intake and nutri-tional status. For immigrants and their offspring, health implications occur as a result of new and former diets. While length of stay in the United States and age of immigration can be an additional measure of acculturation, other dimen-sions of acculturation should be included due to the com-plexity of the concept of acculturation. Other dimensions within the concept of acculturation may include a person’s experience including language preference, media preference, food preference, and self- defined acculturation level (Chen & Wu, 2008; dela Cruz, McBride, Compas, Calixto, & Van Derveer, 2002).
Several studies revealed that migration of immigrants is connected with rapid weight gain and risk of obesity (Magnusson, Hulthen, & Kjellgren, 2005; Van Hook &
Balistreri, 2007). Other epidemiologic studies suggested that changes of dietary patterns might explain some of the rapid increase of obesity and type II diabetes observed among Asian immigrants (Gomez, Kelsey, Glaser, Lee, & Sidney, 2004). Diets high in saturated and trans fats have been associ-ated with coronary heart disease (Ascherio, Katan, Zock, Stampfer, & Willett, 1999; Stampfer, Hu, Manson, Rimm, & Willet, 2000) and to cancers of the colon, breast, and prostate (Landis et al., 1999; World Cancer Research Fund, 2007). Fourteen specific types of cancers have been associated with decreased fruit and vegetable intake (World Cancer Research Fund, 2007). Dietary consumption of fat, sugar, fruits, and vegetables has received attention in recent years because of studies showing that high intake of fat and sugar and low intake of fruits and vegetables are associated with increased risk for most chronic diseases among immigrants (Casagrande, Wang, Anderson, & Gart, 2007; Delisle, Vioque, & Gil, 2009; Perez-Escamilla & Putnik, 2007).
Increases in anthropometric indicators and prevalence of overweight are of special concern for Filipinos because comorbidities tend to occur at lower body mass index (BMI) in Asians (Adair, 2004). The proportion of Filipino women with BMI) ≥ 30 kg/m2 was higher in Hawaii (20%) compared with women in San Diego (9.3%) or the Philippines (5.2%, p < .001). As indicated by Centers of Disease Control and Prevention (CDC; 2007), BMI is clas-sified as follows: underweight (BMI < 18.5); normal weight (BMI ≥ 18.5<25); overweight (BMI ≥ 25 < 30); and obese (BMI ≥ 30). One study, in particular, revealed that regard-less of BMI classification, Filipinos had the highest over-weight prevalence (35%-47%, compared with 20%-38% in Chinese, p< .05) in relation to diabetes risk (Oza-Frank & Cunningham 2010).
While the focus of most studies was on overall obesity, abdominal obesity is also considered as an independent pre-dictor of several risk factors and morbidity to FAs (Baruffi, Hardy, Waslien, Uyehara, & Krupitsky, 2004; Malina, Huang, & Brown, 1995). Waist circumference (WC) is a good predictor for intra-abdominal fat mass (Iacobellis & Leonetti, 2003; van der Kooy, Leenen, Seidell, Deurenberg, & Hautvaust, 1993). According to CDC (2007), women with WC over 35 inches (88 cm) and men measuring greater than 40 inches (102 cm) are considered at risk for cardiovascular diseases (CVD) and diabetes.
Recent studies of dietary acculturation were also done in some Asian populations: Korean Americans, Chinese immi-grants in North America, Japanese Americans, Thais, and Hmong Americans in the United States (Franzen & Smith, 2009; Kim et. al., 2007; Lv & Cason, 2004; Pierce et al., 2007; Satia et al., 2001; Sukalakamala & Brittin, 2006). None of the studies performed an assessment of the level of acculturation of the population based on how the participants identify themselves in addition to other related demographic variables. The reviewed studies also indicate the possibility that length of residence, age of immigration, and language fluency may influence current dietary pattern. Although those that measured demographic and psychosocial variables found these factors to be important predictors of dietary intake. The biometric measurements utilized in most studies were only limited to BMI. None of the studies have included WC and WHR as indicators of health risks. The different measures of dietary intake have its own merit and its use as a research tool depends on the nature of the study and popula-tion. Dietary acculturation among FAs is virtually understud-ied in the literature.
Method
Sample and Setting
The FAs currently living in the Southeastern part of the United States was the sample population. According to 2010 U.S. Census, there is an 80% increase of FAs living in this state. The high proportion of FAs in this region is largely due to many years of recruitment of skilled Filipino workers by the health, banking/finance, pharmaceutical, and information technology industries in this area.
The inclusion criteria for the sampling procedure were Filipino immigrants over the age of 18 who could speak and read in English and/or Tagalog or both. The exclusion crite-ria were (a) participants who could not speak, read, or under-stand English and/or Tagalog; (b) participants who were pregnant and/or with a medical condition that required a pre-scribed therapeutic diet; and (c) Filipino immigrants with less than 1 year of residency in the United States who may not have had enough experience to identify dietary changes since immigration. A convenience sample of N= 128 self-selected participants who satisfied these criteria was recruited from the target population. All participants were recruited through local churches, Filipino events, stores, day care, beauty salons, and agencies and by word of mouth.
Data Collection and Ethical Procedures
Data were collected over three months in 2011. Approximately 30 to 45 min were needed to complete all questionnaires and biometric measurements. Each participant was asked to sign a consent form and the Institutional Review Board approval was obtained from the principal investigator’s (PI) university.
Anonymity of the participants and the confidentiality of the information gathered were assured. Two Filipino Baptist churches located in the community were designated as the sites for the data collection. A privacy curtain was placed in the church’s activity hall to ensure the participant’s privacy during biometric measurements. A female nurse volunteer had also assisted the PI in obtaining the height, weight, hip, and waist circumference of female participants.
Data Analysis
This analysis was not possible using MLR, which could only handle isolated fragments of the puzzle, one at one time. PLS path modeling is particularly useful in generating estimates even with very small sample sizes.
A power analysis to determine the minimum sample size was not necessary for PLS path modeling. According to Hair et al. (2010), “PLS is insensitive to sample size consider-ations” (p. 776). PLS path modeling is particularly useful in generating estimates even with moderate sample sizes (as low as 100 observations or less). The sample size of N= 128 used in this study was therefore more than enough to construct PLS path model. The sample size of N= 128 used in this study was therefore more than enough to construct PLS path model.
Instruments
Anthropometric Measurements
These measurements were made according to the standard procedures reported in the literature (CDC, 2008; Centers for Disease Control–National Health and Nutrition Examination Survey [CDC-NHANES], 2007; WHO, 2004). The height and weight of each participant without shoes while standing were measured. The participants were also asked to wear one outer layer of clothes only. Weight was measured with a Tanita BWB-800 series Digital Physician Scale (Arlington Heights, Illinois). The scale and the stadiometer were cali-brated with a standard weight and height every morning of each day of the interview sessions of the participants before obtaining the measurements. All weights and heights were measured twice, and means were used for analyses. The BMI (kg/m2) was calculated as the body mass (kg) divided by the height (m) squared. Three categories of BMI were catego-rized as normal < 25; overweight = 25-30; and obese > 30.
Socioeconomic/Demographic Questionnaire. The variables col-lected using the Socioeconomic/Demographic Questionnaire included gender, age, years of residency in the United States, age at immigration to the United States, country of birth, income, marital status, and years of education. The nominal variables were coded in binary format (0 or 1). The ordinal variables were coded with integers (1-3). In addition, the par-ticipants reported whether their weight and waist circumfer-ence had changed since their arrival in the United States. The responses were coded in binary format (−1 =decrease, 0 =
no change, and +1 =increase).
Level of acculturation. The level of acculturation was mea-sured by A Short Acculturation Scale for Filipino Americans or ASASFA (dela Cruz, Padilla, & Butts, 1998). The 12-item ASASFA questionnaire is a validated cross-cultural measure that determines an FA’s level of acculturation. The scale is drawn from cultural awareness and ethnic loyalty, that spe-cifically measure three factors or dimensions on a five-point Likert-type scale: (a) use and preference for specific
language in a number of settings and activities, (b) use of and preference for media language (television and radio pro-grams), and (c) ethnic preference in social relations (dela Cruz et al., 1998). In a previous study, the alpha coefficient was reported at 0.85 (dela Cruz & Galang, 2008). In the pres-ent study, the alpha coefficipres-ent was found to be 0.82.
Level of dietary acculturation. The Dietary Acculturation Questionnaire for Filipino Americans (DAQFA) collected variables concerning the level of dietary acculturation of each participant. It was developed by the PI after adapting a Dietary Acculturation Scale by Satia et al. (2001) intended for the Chinese Americans. The original scale consisted of a 5-item Chinese Dietary Acculturation Scale and a 10-item Western Dietary Acculturation Scale.
In the adapted questionnaire for FAs, two subscales were identified: Filipino and Western Dietary Acculturation Scales. Responses to DAQFA are listed as yes or no based on the participants’ dietary practices in the past month. For anal-ysis purpose, the items were coded as 0 for “No” responses and 1 for “Yes” responses. The face validity of the question-naire was established by pilot testing with 20 FAs residing in the same region. The instrument’s content validity was also examined by four experts who were familiar with the con-struct being measured: a doctoral prepared statistician, two doctoral prepared Filipino nurses, and Dr. Satia, who devel-oped the original Chinese Dietary acculturation scale who reviewed the questionnaire for accurate content.
The DAQFA lists 15 food items and dietary behaviors that are reflective of traditional Filipino (5 items) and Western (10 item) food choices, as well as behavior and eating pat-terns. The questionnaire was revised after the pilot study according to comments received from the pilot test partici-pants. The overall content validity index of the instrument was 0.82.
consistency (Kuder–Richardson 20 = 0.78 for the Western Dietary Acculturation Scale and 0.70 for the Filipino Dietary Acculturation Scale.
Cronbach’s alpha coefficients ranged from 0.67 to 0. 77 in previous adapted studies conducted on other ethnic groups (Kim et al., 2007; Lv & Cason, 2004; Satia-Abouta et al., 2002). In the present study, the alpha coefficient was 0.79.
Measures of Dietary Consumption of Fat, Sugar,
Fruits, and Vegetables
The Short Food Frequency Questionnaire (SFFQ) by Block is a shorter-version questionnaire and a variant of widely used Block questionnaires. The SFFQ was selected for the estima-tion of the FAs’ daily dietary consumpestima-tion of fat, sugar, fruits, and vegetables, since it is designed to capture common sources of fat, sugar, fruits, and vegetables in the American diet. The questionnaire has a scannable form, and a computer software program (NutritionQuest) that estimates the con-sumption of calories from saturated fats and trans fats, sugar, added sugar, vegetable, and fruit intake based on the items in the questionnaire. Although the SFFQ has only been used in three recent studies (Block, Wakimoto, Jensen, Mandel, & Greene, 2006; Lalonde et al., 2008; Sternfeld et al., 2009), its variant, the widely used Block Food Frequency Questionnaire, has been used and modified in multiethnic studies (Block, Gillespie, Rosenbaum, & Jenson, 2000; Block et al., 2006; Greendale et al., 2002; Wakimoto, Block, Mandel, & Medina, 2006) with alpha coefficients ranging from 0.59 to 0.79. In the current study, the alpha coefficient was 0.72.
Results
Characteristics of the Sample
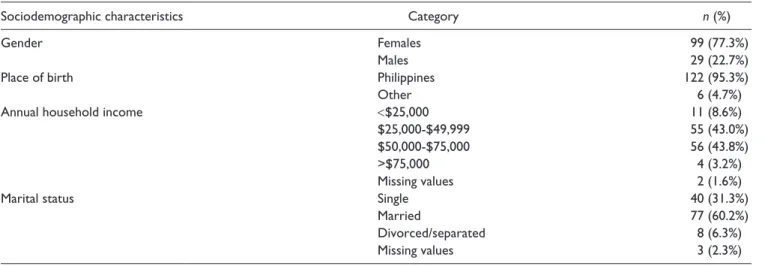
The sample consisted of N= 128 Filipinos who satisfied the inclusion/exclusion criteria, of which over three quarters
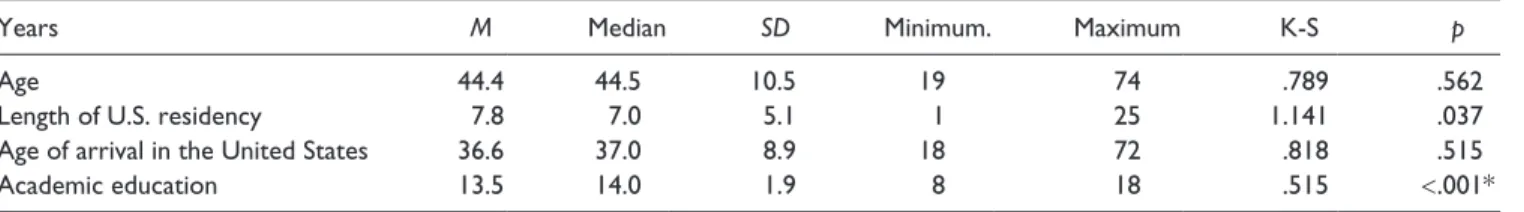
(n= 99, 77.3%) were female. Nearly all (n= 122, 95.3%) were born in the Philippines. The majority (n= 111, 86.8%) had an annual household income of between $25,000 and $75,000 and most were married (n= 77, 60.2%). The fre-quency distributions of demographic sample are presented in Table 1. All but one of the variables (years of academic education) were normally distributed, indicated by p> .01 for the K-S statistic. The ages of the participants ranged from 19 to 73 with a mean of 44.4 years (SD= 10.5). Their lengths of residency in the United States ranged from 1 to 25 years with a mean of 7.8 years (SD = 5.1). Their ages of arrival in the United States ranged from 18 to 72 years, with a mean of 36.6 years (SD = 8.9). The participants had received from 8 to 18 years of academic education, with a median of 14 years.
In this sample population, the education level of partici-pants was high, with a median of 14 years. This character-istic may explain how they qualified to come to the United States as skilled immigrants. In the Philippines, elementary and high school education is compulsory and requires a total of 10 years (six in elementary and four in high school); additionally, most college education requires 4 years, bring-ing the total to 14 years. This result was not surprisbring-ing, however, because the minimum entry-level requirement needed to work as a professional in the Philippines is a bac-calaureate degree (Ea, Griffin, L’Eplattenier, & Fitzpatrick, 2008). In addition, most Filipinos prioritize the value of higher education for reasons of social and economic advancement (Rumbaut, 2005).The majority of the partici-pants reported household yearly incomes between $25,000 and $75,000, which is also consistent with other recent studies among FAs (Ea et al., 2008; de Castro et al., 2008). Since Filipinos were educated in English in the Philippines, many of the immigrants were well versed in English lan-guage and were able to enter the U.S. workforce with their degrees and earn the incomes of professionals (Rumbaut, 2005; see Table 2).
Table 1. Frequency Distributions of Demographic Categories.
Sociodemographic characteristics Category n (%)
Gender Females 99 (77.3%)
Males 29 (22.7%)
Place of birth Philippines 122 (95.3%)
Other 6 (4.7%)
Annual household income <$25,000 11 (8.6%)
$25,000-$49,999 55 (43.0%)
$50,000-$75,000 56 (43.8%)
>$75,000 4 (3.2%)
Missing values 2 (1.6%)
Marital status Single 40 (31.3%)
Married 77 (60.2%)
Divorced/separated 8 (6.3%)
Anthropometric Findings
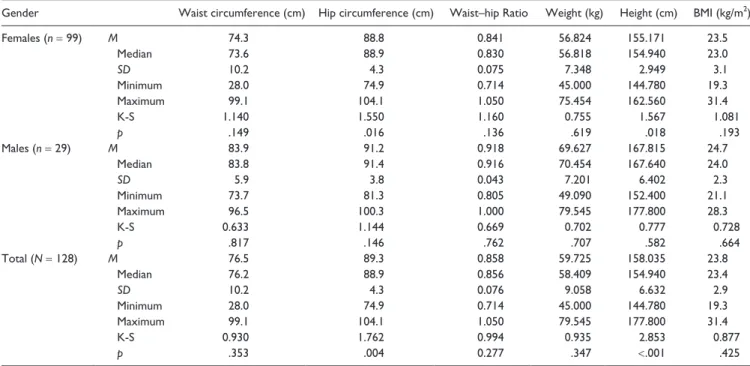
The categorical biometric measurements of the participants are presented in Table 3. Just under half of the participants (n= 63, 49.2%) recorded an increase in weight since they arrived in the United States, while exactly one half (n= 64, 50.0%) recorded no change in weight. Specifically, 62.1% of men and 45% of women reported an increase in weight, while 37.1% of men and 53.5% and women reported no change in weight. Half of the participants (58.6% of men and 45.4% of women) recorded an increase in waist measure-ment while less than a half (37.9% of men and 50% of women) recorded no change. Less than 3% of participants recorded a decrease in body measurements. The BMI of most participants (n= 92, 71.9%) was normal. A quarter (n= 32, 25.0%) were overweight (31.4% of men and 20.2% of women), while n= 4, 3.1%, all of which were women, were classified as obese (BMI > 30). The descriptive statistics for waist, hip, weight, and height measurements of both genders are presented in Table 4. The descriptive statistics for waist, hip, weight, and height measurements of the males and females are presented in Table 4. As mentioned previously, the normal WHR for men is ≤ 0.9 and women is ≤ 0.8 (Seidell, 2010). All of the measurements were normally dis-tributed when stratified by gender, indicated by p> .01 for the K-S statistics. When males and females were combined, however, their heights were not normally distributed, indi-cated by K-S = 2.853, p< .001). The height distribution was not normal, but bimodal, reflecting sexual dimorphism.
The mean, median, and maximum waist circumference, hip circumference, waist/hip ratio, weight, height, and BMI were
consistently higher in males than in females, also reflecting sexual dimorphism. The mean biometric measurements for the males were significantly greater than those for the females. All the measurements were normally distributed when stratified by gender, indicated by p >.01 for the K-S statistics.
Level of Acculturation
The normality of the composite variables (Factor 1, Factor 2, Factor 3, and ASASFA Total) was confirmed by p> .001 for the K-S statistics (see Table 5). The internal consistency reli-ability of these composite variables was good (Cronbach’s alpha = .731 to .916). A comparison of the mean scores indi-cated that the central tendency was for the participants (a) to speak more Tagalog than English, (b) to have a media prefer-ence for more Tagalog than English, and (c) to have an ethnic preference in social relations somewhere between both (i.e., Americans and Filipinos) equal and more Americans than Filipinos. The overall level of acculturation, indicated by ASASFA Total, reflected a central tendency toward more Filipino culture than American.
Dietary Consumption of Fat,
Sugar, Fruits, and Vegetables Findings
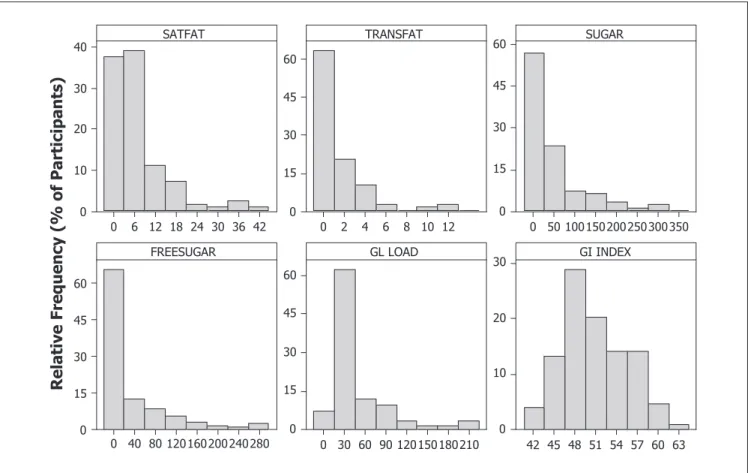
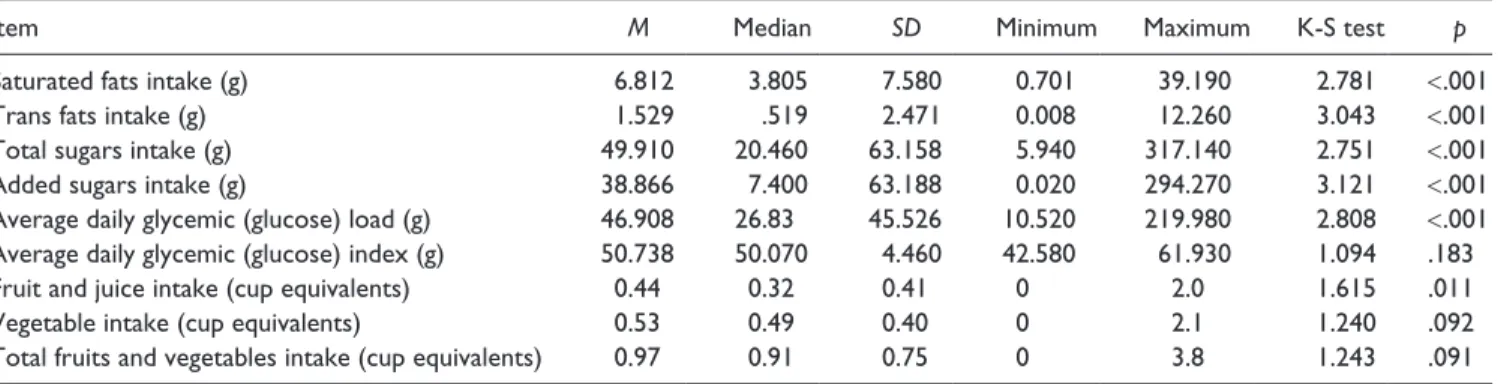
The majority (>60%) of the participants consumed ≤ 9 g of saturated fats (SATFAT), ≤ 3 g trans fats (TRANSFAT), ≤ 75 g of total sugars (SUGAR), ≤ 20g of added sugars (FREESUGAR), with a glycemic load ≤ 40, and a glycemic index ≤ 52 (see Figure 1). The frequency distribution for the
Table 2. Descriptive Statistics for Demographic Variables Related to Time.
Years M Median SD Minimum. Maximum K-S p
Age 44.4 44.5 10.5 19 74 .789 .562
Length of U.S. residency 7.8 7.0 5.1 1 25 1.141 .037
Age of arrival in the United States 36.6 37.0 8.9 18 72 .818 .515
Academic education 13.5 14.0 1.9 8 18 .515 <.001*
*Significant deviation from normality (p < .001).
Table 3. Frequency Distributions of Body Measurement Categories.
Body-measurement category Direction of change
Total
(N= 128)
Males (n= 29)
Females (n= 99)
Changes in body weight Increased 63 (49.2%) 18 (62.1%) 45 (45.5%)
Decreased 1 (0.8%) 0 (0.0%) 1 (1.0%)
No change 64 (50.0%) 11 (37.9%) 53 (53.5%)
Changes in waist measurement Increase 64 (50.0%) 17 (58.6%) 47 (47.5%)
Decrease 3 (2.3%) 1 (3.4%) 2 (2.0%)
No change 61 (47.7%) 11 (37.9%) 50 (50.5%)
BMI category Normal 92 (71.9%) 17 (58.6%) 75 (75.8%)
Overweight 32 (25.0%) 12 (41.4%) 20 (20.2%)
consumption of fruits and vegetables revealed that the major-ity (>50%) consumed <1 cup equivalents per day of fruits/ juice and <1 cup equivalents per day of vegetables (see Figure 2). The mode for the combined consumption of fruits and vegetables was 1, representing a class interval between 0.5 and 1.5 cups equivalents per day. The descriptive statis-tics (M, median, SD, minimum, and maximum) for the con-sumption of fats, sugars, fruit, and vegetables, are presented in Table 6. The deviations from normality for the consump-tion of fat and sugar were confirmed by p< .001 for the K-S statistics. Since the distributions departed very strongly from normality, parametric statistics were not appropriate to ana-lyze the consumption of fat and sugar; however, it was found that the left skewed distributions could be normalized using a logarithmic (log
10) transformation. The normal distribu-tions of the logarithmically transformed data are confirmed by p> .001 for the K-S statistics.
Predictors of Anthropometric Indicators
Two PLS path models were constructed in such a way that they tested six latent variables (Western Dietary Acculturation Scale, Filipino Dietary Acculturation Scale, Fat and Sugar,
Fruits and Vegetables, Demographic and Acculturation) as potential predictors of the anthropometric measures (BMI, WHR, Waist Change, and Weight Change). The path dia-grams constructed using SmartPLS software for the two models, named exploratory and definitive are generated. An evaluation of the exploratory PLS path model (Figure 3) by bootstrapping indicated that the following indicator variables were redundant, because they were not statistically signifi-cant predictors of their corresponding latent variables at p<
.05: Age, Education, Income, FREESUGAR, GL LOAD, TRANSFAT, DAQFA Fil 1, DAQFA West 7, DAQFA West 8, DAQFA West 10. The definitive PLS path model, exclud-ing these indicators is presented in Figure 4. The results of a reliability analysis of the definitive model demonstrated that the reflective relationships (to predict Acculturation, Anthropometric, Filipino Dietary Acculturation Scale, and Western Dietary Acculturation Scale) were reliably mea-sured, indicated by Cronbach’s alpha (.798 for the Western Dietary Acculturation Scale to .917 for Acculturation) in excess of the conventional 0.7.
The most important positive predictors of the anthropo-metric indicators were the Western Dietary Acculturation Scale (path coefficient = .503, p< .05) and the intake of fats
Table 4. Descriptive Statistics for Biometric Measurements.
Gender Waist circumference (cm) Hip circumference (cm) Waist–hip Ratio Weight (kg) Height (cm) BMI (kg/m2)
Females (n = 99) M 74.3 88.8 0.841 56.824 155.171 23.5
Median 73.6 88.9 0.830 56.818 154.940 23.0
SD 10.2 4.3 0.075 7.348 2.949 3.1
Minimum 28.0 74.9 0.714 45.000 144.780 19.3
Maximum 99.1 104.1 1.050 75.454 162.560 31.4
K-S 1.140 1.550 1.160 0.755 1.567 1.081
p .149 .016 .136 .619 .018 .193
Males (n = 29) M 83.9 91.2 0.918 69.627 167.815 24.7
Median 83.8 91.4 0.916 70.454 167.640 24.0
SD 5.9 3.8 0.043 7.201 6.402 2.3
Minimum 73.7 81.3 0.805 49.090 152.400 21.1
Maximum 96.5 100.3 1.000 79.545 177.800 28.3
K-S 0.633 1.144 0.669 0.702 0.777 0.728
p .817 .146 .762 .707 .582 .664
Total (N = 128) M 76.5 89.3 0.858 59.725 158.035 23.8
Median 76.2 88.9 0.856 58.409 154.940 23.4
SD 10.2 4.3 0.076 9.058 6.632 2.9
Minimum 28.0 74.9 0.714 45.000 144.780 19.3
Maximum 99.1 104.1 1.050 79.545 177.800 31.4
K-S 0.930 1.762 0.994 0.935 2.853 0.877
p .353 .004 0.277 .347 <.001 .425
Table 5. Descriptive Statistics and Reliability for ASASFA Composite Variables.
ASASFA Item M Central tendency SD K-S p Cronbach’s alpha
Factor 1 Language use and preference 5 1.81 2 = More Tagalog than English 2.08 1.443 .031 .731
Factor 2 Ethnic preference for media 3 2.08 2 = More Tagalog than English 3.52 1.112 .168 .916
Factor 3 Ethnic preference in social relations 4 3.52 3 = Both equal to 4 = more
Americans than Filipinos
3.00 2.452 .001 .910
42 36 30 24 18 12 6 0 40
30
20
10
0
12 10 8 6 4 2 0 60
45
30
15
0
350 300 250 200 150 100 50 0 60
45
30
15
0
280 240 200 160 120 80 40 0 60
45
30
15
0
210 180 150 120 90 60 30 0 60
45
30
15
0
63 60 57 54 51 48 45 42 30
20
10
0 SATFAT
Relative Frequency (% of Participants
)
TRANSFAT SUGAR
FREESUGAR GL LOAD GI INDEX
Figure 1. Frequency distributions for the consumption of fat and sugar (g).
4 3 2 1 0 60
50
40
30
20
10
0
4 3 2 1 0 60
50
40
30
20
10
0
4 3 2 1 0 40
30
20
10
0
FRUITS
Relative Frequency (% of Participants)
VEG
FRUITS & VEG
and sugars (path coefficient = .282, p< .05). Fruit and veg-etables (path coefficient = −.034), Acculturation (path coef-ficient = .035), the Filipino Dietary Acculturation Scale (path coefficient = –.086), and Demographic factors (path coefficient = .133) were not significant predictors of the anthropometric measures at the .05 level. Results showed that a high number of food items chosen from the Western Dietary Acculturation Scale, in combination with an increased intake of fats and sugars, predicted a significant increase in BMI, WHR, waist change, and weight change.
The Filipino Dietary Acculturation Scale was a signifi-cant negative predictor of Acculturation (path coefficient =
−.789, p < .05) reflecting a strong relationship between acculturation and dietary acculturation. The results showed the choice of a high number of traditional Filipino food items (i.e. a high score on the Filipino Dietary Acculturation Scale) predicted a low score on the Acculturation Scale; however, the Western Dietary Acculturation Scale, representing the choice of traditional American food items, was not a signifi-cant predictor of Acculturation (path coefficient = −.168, p>
.05). The intake of fat and sugar was a significant negative predictor of the Filipino.
Dietary Acculturation Scale (path coefficient = −.392, p<
.05) indicating that high dietary consumption of fats and
Table 6. Descriptive Statistics for Measures of Dietary Consumption.
Item M Median SD Minimum Maximum K-S test p
Saturated fats intake (g) 6.812 3.805 7.580 0.701 39.190 2.781 <.001
Trans fats intake (g) 1.529 .519 2.471 0.008 12.260 3.043 <.001
Total sugars intake (g) 49.910 20.460 63.158 5.940 317.140 2.751 <.001
Added sugars intake (g) 38.866 7.400 63.188 0.020 294.270 3.121 <.001
Average daily glycemic (glucose) load (g) 46.908 26.83 45.526 10.520 219.980 2.808 <.001
Average daily glycemic (glucose) index (g) 50.738 50.070 4.460 42.580 61.930 1.094 .183
Fruit and juice intake (cup equivalents) 0.44 0.32 0.41 0 2.0 1.615 .011
Vegetable intake (cup equivalents) 0.53 0.49 0.40 0 2.1 1.240 .092
Total fruits and vegetables intake (cup equivalents) 0.97 0.91 0.75 0 3.8 1.243 .091
*Significant deviation from normality (p < .001).
sugars was related to the choice of a low number of traditional Filipino food items. Conversely, a high intake of fats and sug-ars was a strong positive predictor of the Western Dietary Acculturation Scale (path coefficient = .623 p< .05) indicat-ing that high dietary consumption of fat and sugar was strongly related to the choice of a high number of Western food items. Intake of fruits and vegetables was a significant positive predictor of the Filipino Dietary Acculturation Scale (path coefficient = .229, p< .05), but the Western Dietary Acculturation Scale (path coefficient = −.112, p> .05) indi-cating that a high dietary consumption of fruits and vegeta-bles was related to the choice of a high number of traditional Filipino food items.
The computed R2 values, expressed as decimals inside the blue symbols in Figure 4, were converted to percentages. A substantial proportion (R2 = 80.0%) of the variance in the anthropometric indicators was explained by the PLS path model, interpreted as a large effect size with practical, clini-cal, and theoretical importance. The model explained about half (R2 = 47.0%) of the variance in the Western Dietary Acculturation Scale, about half of the variance in the Acculturation Scale (R2= 47.9%) and less than one third of the variance in the Filipino Dietary Acculturation Scale (R2=
29.5%) interpreted as medium effect sizes. It is concluded that the major strength and utility of the PLS path model con-structed in this study was its ability to predict the variance in the BMI, WHR, and the change in body weight and waist measurements of the participants.
Discussion
Although nearly half of the participants reported no change in weight since arrival in the United States, half of them also reported an increase in waist measurement. The BMI of most participants was normal and only 25% were overweight. The mean WHR for men was .91 and .84 for women. This study also found that the WHR of the participants were associated with BMI after controlling for age signifying that age was not a mediating factor for their anthropometric measures. The extent of changes in weight and waist circumference could not be determined in this study since it did not ask the participants the estimates of their adult weight and waist cir-cumference they gained since U.S. arrival. It may also be difficult to make an assumption whether the self-reported changes in weight and waist circumference may be influ-enced by other factors (Magnusson et al., 2005). There is no known study of self-reported weight and waist changes among FAs to date.
The mean BMI (23.5 kg/m2) of female participants in this study compared with the study conducted by Araneta et al (2006) is higher than that of the Philippines (22.7 kg/m2), but lower than that of the Hawaii (26.0 kg/m2) and California (25.4 kg/m2). Although mean BMI and WC of the partici-pants were considered normal, the mean WHR was slightly above the WHO cut points for male and female participants (Dobbelsteyn et. al., 2001). The concept of the dangers of higher WHR is known to be a better predictor of poor
cardiac status than BMI (Dave, An, Jeffrey, & Ahluwalia, 2009). At any cut off points, WHR is the most useful mea-sure of obesity to identify individuals at risks for cardiovas-cular disease (Dobbelsteyn et al., 2001; Ryan et al., 2000). As mentioned earlier in this study, FAs have a higher inci-dence of CVD. Although there was no significant associa-tion between CVD and adeponectin levels using WHR as marker for central fat distribution among FAs in a previous study (Davis et al., 2004), the need for more correlation studies between CVD and WHR among FAs warrant future investigations.
The Western Dietary Acculturation Scale of the DAQFA and consumption of fat and sugar predicted a significant increase in BMI, WHR, waist change, and weight change among FAs in this study. There are many environmental fac-tors that could have affected the anthropometric indicafac-tors, including prenatal, childhood, and adult exposures that are different in the United States and the Philippines. Environmental factors important to anthropometric indica-tors include diet and physical activity (Harrison et al., 2005). Except for physical activity, other exposures were also included in this study, such as place of birth, age at immigra-tion to the United States, and level of acculturaimmigra-tion. Reflecting the importance of these variables, this study found that dietary factors, specifically the Western items on the DAQFA and consumption of fats and sugars, were the strongest pre-dictors of anthropometric indicators among FAs. A similar analysis by Newby et al. (2003) found that dietary changes geared toward Western foods were stronger predictors of BMI than other variables.
The consumption of rice which was included in the Block’s Short Food Frequency Questionnaire (SFFQ) and DAQFA can also be attributed with other foods included in the list with high glycemic load and index. Rice is a staple food for most Filipinos in the Philippines (Kennedy, Pedro, Sehhieri, Nantel, & Brouwer, 2007) and is reasonable to assume that acculturating participants were predisposed to consume rice along with their Western diet. Because the SFFQ and DAQFA that were used in the study are only rep-resentative and not comprehensive, the items that pertain to the nutrient of interest such as rice may have resulted in inac-curate reports of their dietary consumption.
Although a Western diet and consumption of fat and sugar generally correlate with anthropometric measurements, this may also be a result of physiological, cultural, and other fac-tors established before migrating to the United States. Furthermore, other factors that are associated with residence in the United States but not necessarily with duration of resi-dence, such as presence of acculturative stress, type and nature of jobs, pressure to fit in the American culture in work settings, lack of physical activity, and sedentary lifestyle, could also play roles in predicting anthropometric indicators among FAs (Olsen, 2000; Pan, Dixon, Huffman, & Himburg, 1999; Pereira et al., 2005; Thompson et al., 2009; Unger et al., 2004). Because the short food-frequency questionnaire
that was used in this study is only representative and not comprehensive, the items that pertain to the nutrients of interest may not be reliable for less-acculturated FAs in the sample and may have resulted in inaccurate reports of their dietary consumption.
A WHO expert consultation (2004) recognized that most studies on overweight, obesity, and fat distribution and health are based on studies from North America and Europe. Studies have suggested that Asian populations, including Filipinos, have different associations between BMI, per-centage of body fat, and health risks than their Western counterparts. For example, a study on a population in Taiwan showed a rise in the prevalence of obesity from about 4% to 27%, if the definition of obesity for Asian populations was changed to a cutoff point of 27 kg/m2 instead of 30 kg/m2 (Wen, Chen, & Tsai, 2010). In the present study, the total BMI was 23.8 kg/m2, which is considered normal for Caucasian populations and was considered at high-risk weight gain in Asian standards (Chen & Wu, 2008; Wen et al., 2010). It was also evident in this study of FAs that their WHR were slightly over the WHO standard and may also warrant further investigations.
Strengths and Limitations
This study is the first to describe the relationships dietary acculturation and anthropometric measurements among FAs using PLS path modeling. Additionally, this study is the first in nursing science that exploited PLS path model analysis. The measurements of the participants’ anthropometric indi-cators were physically obtained from the participants and were not self-reported as compared with other studies also served as one of the strengths of this study.
The results of the study cannot be generalized to the entire population of FAs because the sample was not ran-domly selected and the size was small (n= 128). A large portion of the FAs who participated in the study were mid-dle-aged and had high levels of education and moderate income. Individuals with less education and income may not have similar dietary patterns, but they were not represented in the survey. As with most dietary studies, this study relied solely on the dietary information recalled by the partici-pants. Although quantities of consumed foods were assessed using the SFFQ (Block) questionnaire to determine the FAs food intake, it was likely that the frequency in which foods were consumed may not be precised and may not represent the food items that the FAs were consuming in this part of the country as well as measures of dietary energy intake were missing.
Implications for Nursing
FAs need a greater understanding of their food choices to commit to the goals of Healthy People 2020 to increase healthy weight and reduce obesity among adults. First-generation FAs should be encouraged to decrease their fat and sugar consumption and food with high glycemic index. An international consensus must be in place to tailor nutri-tion policy to the cultural context of dietary trends and pref-erences of newly arrived immigrants. Less-acculturated FAs may be encouraged to maintain their healthful dietary pattern and increase consumption of vegetables and fruits. Public health nurses, nutritionists, and family nurse practitioners who care for FAs might suggest alternative vegetable and fruit options to newly arrived FAs who are not familiar with U.S. fruit and vegetable choices. Further education and counseling are also needed for the more established FAs with regard to their dietary patterns and biculturalism dietary practices.
Since majority of FA immigrants are working, employers should consider to include in their policies in promoting the health of their employees through offering employee nutri-tional guides and healthy eating onsite. Implementation of wellness programs within places of employment designed to meet culturally diverse needs are potential ways to enhance the health of FA within the United States. Nurses and other health care professionals should consider the positive and negative influences of dietary acculturation in their dietary-education efforts for FAs. While the level of cultural compe-tence has increased for health care workers, gaps still remain to address specific cultural needs within certain racial/ethnic populations. Continued focus on cultural competence train-ing for health care providers is needed. Additionally, cul-tural competence education must be incorporated at all levels of nursing education, undergraduate and graduate. The risk of developing chronic illness related to dietary pat-terns must be emphasized in nursing education, in particu-lar, to aid in the effort to prevent obesity and promote healthy lifestyles.
Moreover, for major variables such as dietary consump-tion and dietary acculturaconsump-tion was available only on recent exposure such as past year and past month, and the time win-dow of exposure to Western food may be earlier in life in some participants or during pre-migration period. Nevertheless, this study showed that even recent diet is worth investigating further as explanatory variables for changes in anthropometric measurements among FAs. A longitudinal study in future research is imperative to examine dietary acculturation among FAs which are not easily determined from a cross-sectional study. Other variables that should be considered in future research are the decision-making behav-iors associated with dietary intake to examine if higher levels of acculturation are associated with changes in decision-making behaviors. In addition, perceived social support and everyday life stressors may impact dietary intake levels and should be considered as possible predictive variables.
Conclusion
Immigration occurs in diverse cultural context, and dietary acculturation is common to most immigrants. This study is one of the few that have examined different variables of acculturation to predict anthropometric measurements in immigrant populations, and specifically in people of Filipino descent living in the United States. The results from this study can be used by public nurses, and health care providers in advocating, counseling, education, and development of strategies on healthy eating practices of migrant populations in the Western world.
Acknowledgment
The authors are thankful to the generosity of Dr. Jessie Satia (1971-2010) and all participants for agreeing to take part in the study. The authors acknowledge the statistical expertise of Dr. Ron Fisher.
Declaration of Conflicting Interests
The author(s) declared no potential conflicts of interest with respect to the research, authorship, and/or publication of this article.
Funding
The author(s) disclosed receipt of the following financial support for the research and/or authorship of this article: This work was partially supported by a research grant from Sigma Theta Tau International’s Mu Psi—At Large Chapter.
References
Adair, L. (2004). Dramatic rise and overweight and obesity in adult
Filipino women and risk of hypertension. Obesity Research,
23, 1335-1341.
Araneta, M. D., Lantion-Ang, L., Grandinetti, A., Lim-Abrahan, M., Chang, H., Barrett-Conner, E., & Wingard, D. (2006). Hyperglycemia and type 2 diabetes among Filipino women
in the Philippines, Hawaii, and San Diego. Diabetes Research
and Clinical Practice, 71, 306-312.
Ascherio, A., Katan, M., Zock, P., Stampfer, M. J., & Willett, W.
C. (1999). Trans fatty acids and coronary heart disease. New
England Journal of Medicine, 340, 1994-1998.
Baruffi, G., Hardy, C., Waslien, C., Uyehara, S., & Krupitsky, D. (2004). Ethnic differences in the prevalence of overweight
among young children in Hawaii. Journal of the American
Dietetic Association, 104, 1701-1707.
Block, G., Gillespie, C., Rosenbaum, E., & Jenson, C. (2000). A rapid food screener to assess fat and fruit and vegetable intake.
American Journal of Preventive Medicine, 18, 284-288. Block, G., Wakimoto, P., Jensen, C., Mandel, S., & Greene, R.
(2006). Validation of a food frequency questionnaire for
Hispanics. Prevention of Chronic Disease, 3(3), 1-10.
Casagrande, S., Wang, Y., Anderson, C., & Gart., T. (2007). Have Americans increased their fruit and vegetable intake? The
trends between 1988 and 2002. American Journal of Preventive
Medicine, 32, 257-263.
Centers for Disease Control. (2007). Causes and consequences.
Centers for Disease Control. (2008). Defining obesity and over-weight. Retrieved from http://www.cdc.gov/obesity/defining. html
Centers for Disease Control–National Health and Nutrition
Examination Survey. (2007). Questionnaire, datasets, and
related documentation. Retrieved from http://www.cdc.gov/ nchs/nhanes/nhanes_questionnaires.htm
Chen, J. Y., & Wu, Y. (2008). Cardiovascular risk factors in Chinese-American children: Associations between overweight,
acculturation, and physical activity. Journal of Pediatric
Health Care, 22, 103-110.
Chin, W. (1998). The partial least squares approach for structural
equation modeling. In G. A. Marcoulides (Ed.), Modern
meth-ods for business research (pp. 47-50). Hillsdale, NJ: Lawrence Erlbaum.
Chung, P., Travis, R., Kilpatrick, S., Eliot, M., Lui, C., & Schuster, M. (2007). Acculturation and parent–adolescent communica-tion about sex in the Filipino-American families: A
commu-nity-based participatory research study. Journal of Adolescent
Health, 40, 543-550.
Coverdale, G. (2010). Ready, willing and able? Specialist com-munity public health nurses views of their public health role.
Journal of Research in Nursing, 17, 47-63.
Dave, J., An, L., Jeffrey, R., & Ahluwalia, J. (2009). Relationship of attitudes toward fast food and frequency of fast-food intake
in adults. Obesity, 17, 1164-1169.
Davis, J., Busch, M., Hammat, Z., Novotny, R., Harrigan, R., Grandinetti, A., & Easa, D. (2004). The relationship between ethnicity and obesity in Asians and Pacific Islander
popula-tions: A literature review. Ethnicity & Disease, 14, 111-118.
de Castro, A., Gee, G., & Takeuchi, D. (2008). Job-related stress and chronic health conditions among Filipino immigrants.
Journal of Immigrant Minority Health, 10, 551-558.
dela Cruz, F., & Galang, C. (2008). The illness beliefs, perceptions,
and practices of Filipino Americans with hypertension. Journal
of the American Academy of Nurse Practitioners, 20, 118-127. dela Cruz, F., McBride, M., Compas, L., Calixto, P., & Van
Derveer, C. (2002). White paper on the health status of Filipino
Americans and recommendations for research. Nursing
Outlook, 50, 7-15.
dela Cruz, F., Padilla, G., & Butts, E. (1998). Validating a short
acculturation scale for Filipino-Americans. Journal of
American Academy of Nurse Practitioners, 10, 453-460. Delisle, H., Vioque, J., & Gil, A. (2009). Dietary patterns and
qual-ity in West-African immigrants in Madrid. Nutrition Journal,
8, 222-228. doi:10.1186/1475-2891-8-3
Dobbelsteyn, C., Joffress, M., MacLean, D., & Flowerdew, G. (2001). A comparative evaluation of waist circumference, waist-to-hip ratio and body mass index as indicators of car-diovascular risk factors. The Canadian Heart Health Surveys.
International Journal of Obesity, 25, 652-661.
Ea, E., Griffin, M., L’Eplattenier, N., & Fitzpatrick, J. (2008). Job satisfaction and acculturation among Filipino registered nurses.
Journal of Nursing Scholarship, 40, 46-51.
Field, A. (2009). Discovering statistics using SPSS (3rd ed.).
London, England: Sage.
Franzen, L., & Smith, C. (2009). Acculturation and environmental
change impacts dietary habits among adult Hmong. Appetite,
52, 173-183.
Gomez, S., Kelsey, J., Glaser, S., Lee, M., & Sidney, S. (2004). Immigration and acculturation in relation to health and health-related risk factors among specific Asian subgroups in a
Health Maintenance Organization. American Journal of Public
Health, 94, 1977-1984.
Gray, V., Cossman, J., Dodson, W., & Byrd, S. (2005). Dietary
acculturation of Hispanic immigrants in Mississippi. Salud
Publica de Mexico, 47, 351-360.
Greendale, G., FitzGerald, G., Huang, M. H., Sternfeld, B., Gold, E., Seeman, T., & Sowers, M. (2002). Dietary soy isoflavones and bone mineral density: Results from the study of women’s
health across the nation. American Journal of Epidemiology,
55, 746-754.
Gryn, T., & Gambino, C. (2012). The foreign born from Asia:
2011 (American Community Survey Briefs). Washington,
DC: U.S. Department of Commerce, Economics and Statistics Administration.
Hair, J., Jr., Anderson, R. E., Babin, B. J., Tatman, R. L., & Black,
W. C. (2010). Multivariate Data Analysis (7th ed.). Upper
Saddle River, NJ: Prentice Hall.
Harrison, G., Kagawa-Singer, M., Foerster, S., Lee, H., Kim, L. P., Nguyen, T. U., & Bal, D. (2005). Seizing the moment. California’s opportunity to prevent nutrition-related
dispari-ties in low-income Asian-American populations. Cancer,
104(S12), 2962-2968.
Henseler, J., Ringle, C. M., & Sinkovics, R. R. (2009). The use of partial least squares path modelling in international marketing.
Advances in International Marketing, 20, 277-319.
Hughes, R., & Lawrence, M. (2005). Globalisation, food and health
in Pacific Island countries. Asia Pacific Journal of Clinical
Nutrition, 14, 298-305.
Iacobellis, G., & Leonetti, F. (2003). Epicardial fat from echocar-diography: A new method for visceral adipose tissue
predic-tion. Obesity Research, 11, 304-310.
Javier, J., Huffman, L., & Mendoza, F. (2007). Filipino child health in the United States: Do health and health care disparities exist?
Preventing Chronic Disease Public Health Research. Practice. and Policy, 4(2), 1-20.
Keita, A., Casazza, K., Thomas, O., & Fernandez, J. (2009). Neighborhood-level disadvantage is associated with reduced
dietary quality in children. Journal of American Dietician
Association, 109, 1612-1616.
Kennedy, G., Pedro, M., Sehhieri, C., Nantel, G., & Brouwer., I. (2007). Dietary diversity score is a useful indicator of
micro-nutrient intake in non-breast-feeding Filipino children. The
Journal of Nutrition, 137, 472-477.
Kim, M. J., Lee, S. J., Ahn, Y. H., Bowen, P., & Lee, H. (2007). Dietary acculturation and diet quality of hypertensive Korean
Americans. Journal of Advanced Nursing, 58, 436-445.
Kittler, P., & Sucher, K. (2004). Accent on taste: An applied
approach to multicultural competency. Diabetes Spectrum, 17,
200-204.
Kudo, Y., Falciglia, G., & Couch, S. (2000). Evolution of meal pat-terns and food choices of Japanese-American females born in
the United States. European Journal of Clinical Nutrition, 54,
665-670.
Journal of Cardiopulmonary Rehabilitation and Prevention,
28, 340.
Landis, S., Murray, T., Bolden, S., & Wingo, P. (1999). Cancer
statistics, 1999. CA: A cancer Journal for Clinicians, 49,
8-31.
Lee, S. K., Sobal, J., & Frongillo, E. (1999). Acculturation and
dietary practices among Korean Americans. Journal of
American Dietetic Association, 99, 1084-1089.
Lv, N., & Cason, K. (2004). Dietary pattern change and
accultura-tion of Chinese Americans in Pennsylvania. Journal of the
American Dietetic Association, 104, 771-778.
Magnusson, M., Hulthen, L., & Kjellgren, K. (2005). Obesity, dietary pattern and physical activity among children in a
sub-urb with high proportion of immigrants. Journal of Human
Nutrition and Dietetics, 18, 187-194.
Malina, R., Huang, Y., & Brown, K. (1995). Subcutaneous adipose tissue distribution in adolescent girls of four different ethnic
groups. International Journal of Obesity Related Metabolic
Disorders, 19, 793-797.
National Federation of Filipino Associations in America. (2011).
Re: Filipinos in the United States. Retrieved from http//:www. naffausa.org
Newby, P. K., Muller, D., Hallfrisch, J., Qiao, N., Andres, R., & Tucker, K. L. (2003). Dietary patterns and changes in body
mass index and waist circumference in adults. American
Journal of Clinical Nutrition, 77, 1417-1425.
Novotny, R., Williams, A., Vinoya, A., Oshiro, K., & Vogt, T. (2009). US acculturation, food intake, and obesity among
Asian-Pacific hotel workers. Journal of the American Dietetic
Association, 109, 1712-1718.
Olsen, L. (2000). Learning English and learning America:
Immigrants in the center of the storm. Theory Into Practice,
39, 196-202.
Oza-Frank, R., & Cunningham, S. (2010). The weight of US
residence among immigrants: A systematic review. Obesity
Review, 11, 271-280.
Pan, Y. L., Dixon, Z., Huffman, F., & Himburg, S. (1999). Asian students change their eating patterns after living in the United
States. Journal of American Dietetic Association, 99, 54-57.
Pereira, M., Kartashov, A., Ebbeling, C., Van Horn, L., Slattery, M., Jacobs, D., & Ludwig, D. (2005). Fast-food habits, weight gain, and insulin resistance (the CARDIA study): 15 year
pro-spective analysis. Lancet, 365, 36-42.
Perez-Escamilla, R., & Putnik, P. (2007). The role of acculturation in nutrition, lifestyle, and incidence of type 2 diabetes among
Latinos. Journal of Nutrition, 137, 860-870.
Pierce, B., Austin, M., Crane, P., Retzlaff, B., Fish, B., & Hutter, C. (2007). Measuring dietary acculturation in Japanese Americans with the use of confirmatory factor analysis of food-frequency
data. American Journal of Clinical Nutrition, 86, 496-503.
Price, G., Uauy, R., Breeze, E., Bulpitt, C., & Fletcher, A. (2006). Weight, shape and mortality risks in older persons: Elevated waist-hip ratio, not high body mass index is associated with
greater risk of death. American Journal of Clinical Nutrition,
84, 449-460.
Ringle, C. M., Wende, S., & Will, A. (2005). Smart PLS, Version 2.0
(User Instruction Manual). Humboldt-Universitat zu Berlin: Institute of Marketing.
Rumbaut, R. (2005). Turning points in the transition to adulthood: Determinants of educational attainment, incarceration, and
early childbearing among children of immigrants. Ethnic and
Racial Studies, 28, 1041-1086.
Ryan, C., Shaw, R., Pliam, M., Zapolanski, A. J., Murphy, M., Valle, H. V., & Myler, R. (2000). Coronary heart disease in Filipino and Filipino-American patients: Prevalence of risk factors and
outcomes of treatment. Journal of Invasive Cardiology, 12(3),
134-139.
Satia, J. (2010). Dietary acculturation and the nutrition transition:
An overview. Applied Physiology, Nutrition, and Metabolism,
35, 219-223.
Satia, J., Patterson, R., Kristal, A., Hislop, T., Yasui, Y., & Taylor, V. (2001). Development of dietary acculturation scales among
Chinese Americans and Chinese Canadians. Journal of the
American Dietetic Association, 101, 548-553.
Satia-Abouta, J., Patterson, R., Neuhouser, M., & Elder, J. (2002). Dietary acculturation: Applications to nutrition research and
dietetics. Journal of the American Dietetic Association, 102,
1105-1118.
Seidell, J. C. (2010). Waist circumference and waist/hip ratio in
rela-tion to all-cause mortality, cancer and sleep apnea. European
Journal of Clinical Nutrition, 64, 35-41.
Stampfer, M., Hu, F., Manson, J., Rimm, E., & Willet, W. (2000). Primary prevention of coronary heart disease in women
through diet and lifestyle. New England Journal of Medicine,
343, 16-32.
Sternfeld, B., Block, C., Quesenberry, C., Block, T., Husson, G., Norris, J., & Block, G. (2009). Improving diet and physical
activity with Alive: A worksite randomized trial. American
Journal of Preventive Medicine, 36, 475-483.
Sukalakamala, S., & Brittin, H. (2006). Food practices, changes, preferences, and acculturation of Thais in the United States.
Journal of the American Dietetic Association, 106, 103-108. Tabachnick, B. G., & Fidell, L. S. (2007). Using multivariate
statis-tics (5th ed). Boston, MA: Allyn & Bacon.
Temme, D., Kreis, H., & Hildebrandt, L. (2006). PLS path
mod-eling: A software review. Humboldt-Universitat zu Berlin: Institute of Marketing.
Thompson, F., McNeel, T., Dowling, E., Midtune, D., Morrissette, M., & Zerruto, C. (2009). Interrelationships of added sugars intake, socioeconomic status, and race/ethnicity in adults in the
United States: National health interview survey, 2005. Journal
of American Dietary Association, 109, 1376-1383.
Unger, J., Reynolds, K., Shakib, S., Spruijt-Metz, D., Sun, P., & Johnson, A. (2004). Acculturation, physical activity, and fast-food consumption among Asian American and Hispanic
ado-lescents. Journal of Community Health, 29, 467-481.
United States Department of Health and Human Service. (2010).
Healthy People 2020, Understanding and improving health. Retrieved from www.healthypeople.gov/hp2020/Objectives/ files/Draft2009Objectives.pdf
van der Kooy, K., Leenen, R., Seidell, J., Deurenberg, P., & Hautvaust, J. (1993). Effect of weight cycle on visceral fat
accumulation. American Journal of Clinical Nutrition, 58,
853-857.
origin: A longitudinal study of body mass index among
chil-dren. Social Science and Medicine, 65, 976-989.
Wakimoto, P., Block, G., Mandel, S., & Medina, N. (2006). Development and reliability of brief dietary assessment tools
for Hispanics. Preventing Chronic Disease, 3(3), 1-12.
Wen, T. H., Chen, D. R., & Tsai, M. J. (2010). Identify geographi-cal variations in poverty-obesity relationships: Empirigeographi-cal
evi-dence in Taiwan. Geospatial Health, 4, 257-265.
WHO expert consultation. (2004). Appropriate body-mass index for Asian populations and its implications for policy and
inter-vention strategies. Lancet, 363(9403), 157-163.
World Cancer Research Fund/American Institute for Cancer
Research. (2007). Food, nutrition, physical activity, and the
prevention of cancer: A global perspective. Washington, DC: AIRC.
Author Biographies
Reimund C. Serafica, PhD, MSN, RN is an assistant professor of nursing at Gardner-Webb University. His research interests include dietary acculturation, dietary practices, and physical activity among first-generation immigrants in the United States.
Susan H. Lane, PhD, MSN, RN is an assistant professor of nursing at Appalachian State University. Her research interests include deci-sion-making behaviors, adolescent health, and cultural practices.