Nutritional Intervention and the Impact on Adherence to Treatment
in Patients with Metabolic Syndrome
Fernanda Michielin Busnello
1, Luiz Carlos Bodanese
2, Lúcia Campos Pellanda
1, Zilda Elizabeth de Albuquerque Santos
3 Universidade Federal de Ciências da Saúde de Porto Alegre1; Pontifícia Universidade Católica do Rio Grande do Sul2, Porto Alegre, RS - Brazil; Centro Universitário Metodista IPA3, Porto Alegre, RS, BrasilAbstract
Background: Metabolic syndrome is associated with increased risk of cardiovascular events disease and type 2 diabetes. Treatment includes modifications on life style, diet and physical activity. Treatment adherence plays a crucial role in the successful treatment of this disease.
Objective: To evaluate two models of dietary intervention, and the relationship with adherence to treatment and impact on clinical improvement of patients with metabolic syndrome.
Methods: Randomized clinical trial, lasting four months. Participants were randomized assigned to the intervention or control group. Both groups were instructed to follow a diet for 4 months. Subjects in the intervention group additionally received an intervention package, with metabolic syndrome manual book, telephone counseling and nutrition education leaflets. In both groups nutritional anamnesis, anthropometric assessment, dietary assessment, individualized dietary and biochemical tests were done.
Results: Patients who arrived more motivated were those who has the greatest reduction in the values of body mass index, which decreased from 31.7 kg/m² (SD ± 3.9) to 30.9 kg/m² (SD ± 3.8), reduction in waist circumference was 108.1 cm (SD ± 9.8) to 105.9 cm (SD ± 9.5). The statistically significant associations were in the correlation between body mass index, blood glucose and triglycerides, reducing the consumption of whole milk, increased consumption of whole grains and skimmed milk and between the increase in vegetable intake and reducing triglycerides.
Conclusion: Both groups showed significant improvement in all clinical parameters that was significantly associated with the previous motivation. Patients who arrived more motivated were those who responded better to treatment. (Arq Bras Cardiol 2011; 97(3) : 217-224)
Keywords: Patient compliance; metabolic syndrome; diet.
Mailing address: Fernanda Michielin Busnello •
Rua Sarmento Leite, 245, sala 611 - Centro - 90050-170, Porto Alegre, RS, Brazil
E-mail: [email protected]
Manuscript received November 21, 2010; revised manuscript received January 12, 2011; accepted February 23, 2011.
Introduction
The prevalence of metabolic syndrome (MS) has been increasing worldwide in recent decades1. Data from the National Cholesterol Education Program Adult Treatment Panel III (NCEP-ATP III)2 show that 60% of women and 45% of American men are diagnosed with MS. In Brazil, research findings have observed similar patterns in which data showed variations of 48% to 87% of individuals with MS3-6. One reason for the significant increase of MS in the population is the association of MS with obesity and type 2 diabetes mellitus (T2DM)7,8.
MS represents a set of risk factors of metabolic origin, which promote the development of cardiovascular diseases and T2DM9. Treatment includes a combination of changes in lifestyle, with dietary intervention, regular physical
activity and use of medicines10. Weight loss resulting from the modification of lifestyle, including physical exercise, is extremely important11. Adherence to treatment plays a crucial role in the successful treatment of MS. It is a multifactorial process that is established through partnership between the health professional and the patient, and covers aspects that include frequency of health care, recognition, acceptance and adaptation of their health condition, identification of risk habits, attitudes that promote quality of life, development of awareness for self-care and maintenance of health12. Chronic patients have lower adherence to treatment, since the treatment regimens are often complex and require great commitment from the patient, and should be followed continuously13. Treatment of patients with chronic illness should have as its central axis the provision of tools to control the disease, favoring the adaptation to this condition12.
Methods
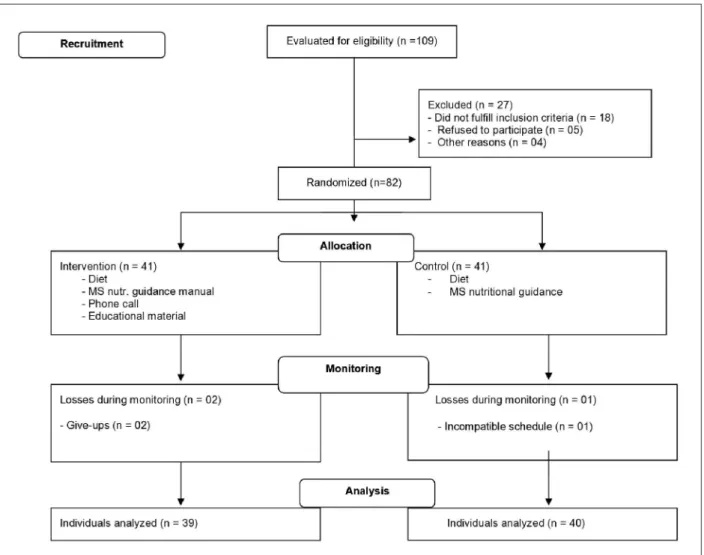
This randomized clinical trial was attended by 80 individuals selected through two sources: a) public call on newspaper of general circulation in Porto Alegre (RS); b) patients linked to the Cardiometabolic Diseases Clinic of Hospital São Lucas, PUCRS, a tertiary hospital in Porto Alegre.It included individuals of both sexes, aged 18 years or older, diagnosed with MS, according to the diagnostic criteria adopted by the NCEP-ATP III, who agreed to participate in the research before signing the informed consent (IC). The NCEP-ATP III criteria for the diagnosis of MS include the association of three or more of the following components: waist circumference for men: > 102 cm and women: > 88 cm; triglycerides ≥ 150 mg/dl; HDL for men: < 40 mg/dl and women: < 50 mg/dl; systolic blood pressure ≥ 130 mmHg or diastolic pressure ≥ 85 mmHg, and fasting glucose ≥ 110 mg/dl. The sample size required to estimate an association between adherence to treatment and clinical improvement in patients with metabolic syndrome using a power of 80%, a significance level of 5% was 80 patients. The sample size was defined with the aid of the program WinPepi.
Evaluation of patients followed a standardized protocol. Monitoring lasted four months, with monthly visits totaling
four sessions. Patients were randomized into two groups: intervention group (IG) and control group (CG). The randomization scheme was done through the web site http://www.randomization.com14, by a physician not directly involved with the trial. The randomization list was kept in a manila envelope, with a person standing outside of the visiting room. The definition of the group was informed by the researcher only after inclusion, at the time of implementing the intervention. The CG received standard individual diet and guidelines for MS. The IG received an individual standard diet and a “Manual of Nutritional Guidelines for Patients with Metabolic Syndrome”, containing nutritional advice about healthy eating, T2DM, hypertension (HTN), dyslipidemia, table for blood pressure and weight control, a field to write down their questions regarding the treatment and schedule of return visits. In addition, participants in the IG had a telephone number to call when necessary, if they had any questions between the visits. All GI patients received a telephone call from the researchers fifteen days after the medical visit for nutritional counseling. At each return visit, IG patients were given a different printed material about nutrition guidelines.The randomization diagram is described in Figure 1.
All patients underwent clinical and nutritional anamnesis, anthropometric measurements, dietary assessment, individualized dietary guidance, biochemical examinations. The clinical-nutritional anamnesis included personal data, history of past and present diseases, smoking, alcohol consumption, physical activity, bowel habits and current medication. Anthropometric assessment was performed by measuring weight (kg) and height (m), waist circumference (WC), hip circumference (HC) and neck circumference (NC). Body Mass Index (BMI) and waist-hip ratio (WHR) were calculated and ranked, and WA and NC were classified. Measurements of weight and height were performed on Filizola anthropometric scale, Personal Digital model with a maximum capacity for 180 kg and a minimum of 2 kg with graduation at each 100 g, and a rule for heights up to 192 cm. The patients were weighed without shoes, with light clothes. Height was measured with the patient standing in the center of the scale, erect and motionless, with arms outstretched over the body, head up, looking to a fixed point at eye level. The shoulders, buttocks and heels remained against the anthropometric ruler. Measurement was taken in centimeters with the measurement instrument showing scale variation in millimeters. BMI was calculated as the ratio of weight (kg)/ height2 (m)15,16 and ranked according to the reference values established by the WHO in 199815. The measurement of WC was performed with the patient standing with inextensible and inelastic tape at the end of expiration, measured in the abdominal region surrounding the midpoint of the distance between the iliac crest and inferior coastal edge17. The cutoff point is 102 cm for men and 88 cm for women16-19. Hip circumference was measured with the patient standing, circling the hips at the largest circumference at the height of the buttocks, through the pubic symphysis, parallel to the floor. WHR was calculated by dividing the waist measurement by the hip measurement. The cut-off points indicative of risk for cardiovascular diseases are ≥ 0.8 for women and ≥ 1.0 for men18. The NC was measured with the patient standing, around the neck with an inelastic tape at the midpoint of the neck at the level of cricothyroid muscle20 between the midpoint of the neck to mid-anterior neck. In men with laryngeal prominence, the measurement was made below the prominence. The values for the cutoff point used were ≤ 37 cm for men and ≤ 34 cm for women. Biochemical assessment consisted of lipid profile (triglycerides (TG), total cholesterol (TC), HDL cholesterol and LDL cholesterol), glucose, uric acid and ultrasensitive C-reactive protein (usCRP). TC, HDL, TG, glucose and uric acid were determined in the clinical laboratory of Hospital São Lucas, PUCRS, in a Vitros Fusion Johnson autoanalyzer using Johnson & Johnson kits and dry chemistry methodology. The determination of LDL-C to
serum TG below 400 mg/dl was obtained by the Friedewald
equation: LDL-c = CT - HDL-c - TG/521. Acceptable values for
lipids, glucose and uric acid were: total cholesterol up to 200
mg/dl, HDLc > 40 mg/dl, triglycerides < 150 mg/dl, LDLc < 100 mg/dl, glucose up to 110 mg/dl and uric acid up to 6.0
mg/dl for women and up to 7.0 mg/dl for men21. US usCRP
was measured in the Immunology Laboratory, Hospital São Lucas, PUC and the results were evaluated according to the criteria of the American Heart Association (AHA), the same
ones adopted by Hospital São Lucas, PUCRS, where: < 1.0
mg/l is considered low cardiovascular risk; between 1 and 3
mg/l, medium risk and > 3 mg/l, high cardiovascular risk22. To identify dietary habits, a 24-hour recall survey was conducted (24HR). The dietary guidelines were drawn up following the recommendations of the First Brazilian Guideline for Diagnosis and Treatment of Metabolic Syndrome (IDBSM)18. The statistical treatment of data was done using the Program SPSS version 17.0. For analysis of categorical variables between groups, we used the chi-square test of Pearson, and to compare the means, Student’s t test.For comparison of biochemical parameters between groups analysis of variance (ANOVA) was used for repeated two-way measures (group and time), and for multiple comparisons, the Bonferroni test. To complement this analysis, we applied the Student t test for independent samples and ANOVA for repeated one-way measures. In the parameters assessed at only two instances, we applied the Student’s t test for paired samples. To compare bowel habits, fluid intake and physical activity before and after the intervention, by group, we used McNemar’s chi-square test. In the evaluation of dietary consumption variables, non-parametric tests were applied. We used Wilcoxon’s tests for intragroup comparison and Mann-Whitney’s tests for intergroup comparison. In evaluating the associations between quantitative variables we used Pearson’s linear correlation tests (symmetric distribution) or Spearman’s (asymmetric distribution). The level of significance was 5% (p ≤ 0.05).
This study was approved by the Ethics in Research of
Pontifícia Universidade Católica, Rio Grande do Sul. The study involved no risk for patients and procedures were in accordance with the national and international guidelines for research involving humans, in keeping with the Declaration of Helsinki.
Results
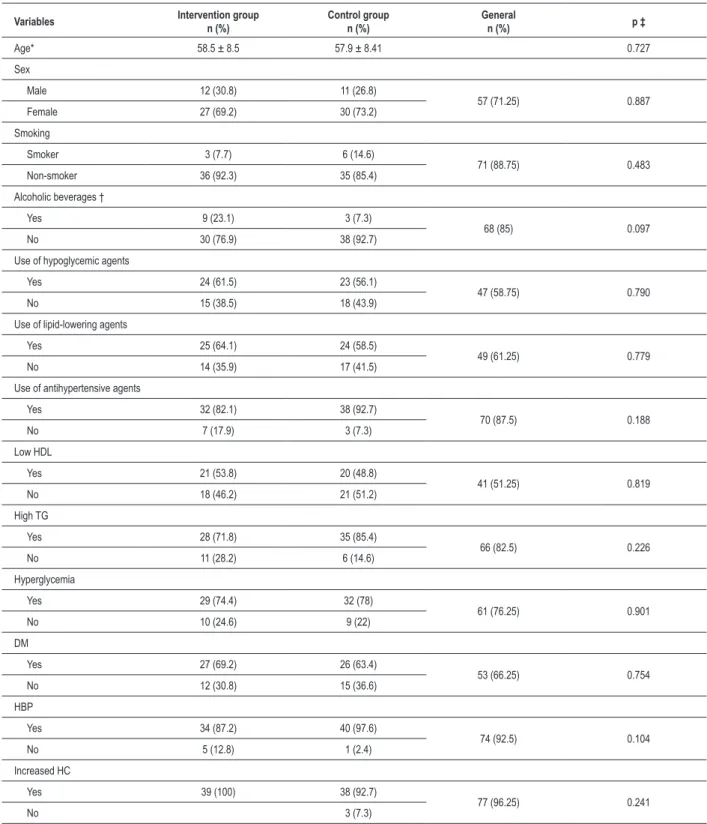
The sample comprised 80 individuals with a mean age of 58.5 years (SD ± 8.5) in the Intervention Group and 57.9 years (SD ± 8.41) in the Control Group. In both groups, most participants were female, and 27 women (69.2%) in the Intervention Group and 30 women (73.2%) in the Control Group. Table 1 describes the sample studied and the distribution of the prevalence of components of metabolic syndrome according to NCEP-ATP III criteria, showing that the groups are homogeneous in these characteristics, as well as the distribution of prevalence of metabolic syndrome components.
Regarding the initial motivation of patients, we can observe that both groups were highly motivated in the first visit according to the data shown in Table 2. When we compare the initial motivation with the final result of BMI, we observe that patients who were more motivated were those who had greater reduction in BMI (p < 0.001) in both groups, as shown in Table 3.
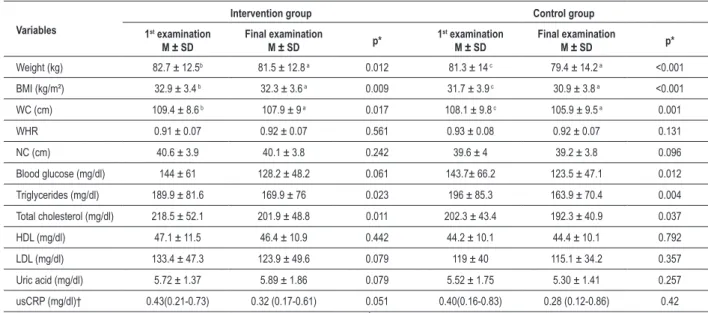
In all parameters used for anthropometric assessment (weight, BMI, WC, WHR and NC) there was a significant difference over time regardless of group, for BMI and WC. Anthropometric measurement and laboratory test data are described in Table 4.
Table 1 - Sample characteristics and distribution of prevalence of metabolic syndrome components according to NCEP-ATP III criteria
Variables Intervention group
n (%)
Control group n (%)
General
n (%) p ‡
Age* 58.5 ± 8.5 57.9 ± 8.41 0.727
Sex
Male 12 (30.8) 11 (26.8)
57 (71.25) 0.887
Female 27 (69.2) 30 (73.2)
Smoking
Smoker 3 (7.7) 6 (14.6)
71 (88.75) 0.483
Non-smoker 36 (92.3) 35 (85.4)
Alcoholic beverages †
Yes 9 (23.1) 3 (7.3)
68 (85) 0.097
No 30 (76.9) 38 (92.7)
Use of hypoglycemic agents
Yes 24 (61.5) 23 (56.1)
47 (58.75) 0.790
No 15 (38.5) 18 (43.9)
Use of lipid-lowering agents
Yes 25 (64.1) 24 (58.5)
49 (61.25) 0.779
No 14 (35.9) 17 (41.5)
Use of antihypertensive agents
Yes 32 (82.1) 38 (92.7)
70 (87.5) 0.188
No 7 (17.9) 3 (7.3)
Low HDL
Yes 21 (53.8) 20 (48.8)
41 (51.25) 0.819
No 18 (46.2) 21 (51.2)
High TG
Yes 28 (71.8) 35 (85.4)
66 (82.5) 0.226
No 11 (28.2) 6 (14.6)
Hyperglycemia
Yes 29 (74.4) 32 (78)
61 (76.25) 0.901
No 10 (24.6) 9 (22)
DM
Yes 27 (69.2) 26 (63.4)
53 (66.25) 0.754
No 12 (30.8) 15 (36.6)
HBP
Yes 34 (87.2) 40 (97.6)
74 (92.5) 0.104
No 5 (12.8) 1 (2.4)
Increased HC
Yes 39 (100) 38 (92.7)
77 (96.25) 0.241
No 3 (7.3)
* described as mean ± standard deviation; † Any amount ingested during the day was considered afirmative; ‡ Student’s t test (age) or Pearson’s chi-square (other variables). DM: diabetes mellitus; HAS: hipertensive blood pressure; TG – Triglycerides; HC - Hip circumference.
observe that in the intervention group there was a statistically significant reduction in consumption of whole milk (p = 0.002) and increased consumption of whole grains (p = 0.008), whereas in the Control Group there was a statistically
Table 4 -Comparison of anthropometric measurements and laboratory indings between the beginning and end of the intervention
Variables
Intervention group Control group
1st examination
M ± SD
Final examination
M ± SD p*
1st examination
M ± SD
Final examination
M ± SD p*
Weight (kg) 82.7 ± 12.5b 81.5 ± 12.8 a 0.012 81.3 ± 14 c 79.4 ± 14.2 a <0.001
BMI (kg/m²) 32.9 ± 3.4 b 32.3 ± 3.6 a 0.009 31.7 ± 3.9 c 30.9 ± 3.8 a <0.001
WC (cm) 109.4 ± 8.6 b 107.9 ± 9 a 0.017 108.1 ± 9.8 c 105.9 ± 9.5 a 0.001
WHR 0.91 ± 0.07 0.92 ± 0.07 0.561 0.93 ± 0.08 0.92 ± 0.07 0.131
NC (cm) 40.6 ± 3.9 40.1 ± 3.8 0.242 39.6 ± 4 39.2 ± 3.8 0.096
Blood glucose (mg/dl) 144 ± 61 128.2 ± 48.2 0.061 143.7± 66.2 123.5 ± 47.1 0.012
Triglycerides (mg/dl) 189.9 ± 81.6 169.9 ± 76 0.023 196 ± 85.3 163.9 ± 70.4 0.004
Total cholesterol (mg/dl) 218.5 ± 52.1 201.9 ± 48.8 0.011 202.3 ± 43.4 192.3 ± 40.9 0.037
HDL (mg/dl) 47.1 ± 11.5 46.4 ± 10.9 0.442 44.2 ± 10.1 44.4 ± 10.1 0.792
LDL (mg/dl) 133.4 ± 47.3 123.9 ± 49.6 0.079 119 ± 40 115.1 ± 34.2 0.357
Uric acid (mg/dl) 5.72 ± 1.37 5.89 ± 1.86 0.079 5.52 ± 1.75 5.30 ± 1.41 0.257
usCRP (mg/dl)† 0.43(0.21-0.73) 0.32 (0.17-0.61) 0.051 0.40(0.16-0.83) 0.28 (0.12-0.86) 0.42
* Student’s t-test for paired samples; †described by median (p25-p75); BMI - Body Mass Índex ; WC - Waist circumference; WHR - Waist-hip ratio; NC - Neck circumference;
usCRP - Ultrasensitive C-reactive protein; SD - Standard deviations.
Table 5 -Comparison of dietary pattern between the beginning and end of the intervention
Variables
Intervention group Control group
Beginning md (p25-p75)
End
md (p25-p75) p*
Beginning md (p25-p75)
End
md (p25-p75) p*
Meal frequency 5 (4-5) 5 (4-5) 0.953 5 (4-5.5) 5 (5-6) 0.052
Fruit consumption 2 (1-3) 2 (1-3) 0.274 1 (0-2) 2 (1-2) 0.082
Vegetable consumption 1 (1-2) 1 (1-2) 0.197 1 (1-2) 1 (1-2) 0.373
Consumption of whole milk 1 (0-1) 0 (0-0) 0.002 1 (0-2) 0 (0-1) 0.005
Skimmed milk consumption 1 (0-2) 2 (0-2) 0.167 0 (0-2) 1 (0-2) 0.010
Consumption of whole grains 0 (0-2) 1 (0-2) 0.008 0 (0-1) 1 (0-2) 0.027
Consumption of beans 1 (1-1) 1 (0-1) 0.074 1 (1-1) 1 (0-1) 0.157
* Wilcoxon test.
Table 2 - Motivation of patients according to researcher’s impression at the beginning of treatment
Motivation
Intervention group
n (%)
Control group
n (%) p*
Motivated 26 (66.7) 30 (73.2) 0.696
Not motivated 13 (33.3) 11 (26.8)
*Pearson’s chi-square test.
Table 3 -Comparison between the initial motivation and body mass
index at the beginning and the end of the intervention
Variables
BMI (kg/m²) Intervention
group Beginning End
m (±SD)
p*
BMI (kg/m²) Control group
Beginning End m (±SD)
p*
Motivated 32.2 (±3.6)31.4 (±3.6) <0.001 31.7 (±3.8)30.7 (±3.9) <0.001
Not motivated
34.1 (±2.7)
34.2 (±2.8) 0.676
31.6 (±4.1)
31.6 (±3.9) 0.939 * Student’s t-test; BMI - Body Mass Índex.
Discussion
In this randomized trial, we observed a significant improvement of several clinical parameters in both groups. The improvement was significantly associated with previous motivation. In our study, both groups were highly motivated in the first visit.
When we compare the initial motivation of participants, with the final results of BMI, we observe that those
Patients undergoing nutritional interventions, both in the short and long term, often have poor adherence to nutritional treatment24-26. The reasons that have led individuals to give up studies are often unknown, but may be presumed from the disappearance of some of the symptoms that led them to seek professional guidance leading to a feeling of no need to go to further visits, lack of time to participate in the program, dissatisfaction and disaffection with the research proposal, personal, family and health problems25,27 to the type of strategy used26. Guimarães et al25 found that irrespective of the nutritional counseling that offered, which can be group treatments or individual visits, the change in eating habits is still very limited.
It is well established in the scientific literature that obesity is associated with increased prevalence and severity of cardiovascular risk factors19. Adipose tissue, especially that which is deposited in the abdominal region, is a potent mediator of pro-inflammatory and pro-thrombosis state19; therefore, weight loss is the primary goal to prevent complications related to MS.
Dagenais et al28 compared the use of BMI, WC and WHR in eight thousand individuals as for the risk of cardiovascular events, and the stronger associations were with measures WC and WHR. Likewise, in a multicenter study conducted in 52 countries, measures more associated with myocardial infarction were WA and WHR29.
In laboratory tests performed, blood glucose, triglycerides, total cholesterol, HDL, LDL, uric acid and usCRP, there was a reduction of the values between the first and the fourth visit. The variables of weight, BMI, WC and triglycerides had significant values for time p, and the variables that tended to time p were TC, blood glucose, NC and LDL.
CRA has demonstrated an important role in the prognosis of heart diseases and is associated with cardiovascular morbidity30. usCRP has a higher prognostic value for cardiac events when compared to other risk markers31. Saijo et al32 investigated the association between CRP concentrations, RI, anthropometric measures and atherosclerosis, and found a significant association of CRP with parameters of waist circumference32.
In several studies, WC has been studied as a new predictor of obesity. Our findings corroborate the study by Ben-Noun et al33 who also found the same association in their sample. Yang et al34 found a positive association between BMI and WC, where WC ≥ 39 cm in men and ≥ 35 cm in women was the best cutoff point to identify individuals with MS34.
Individuals with MS are at high risk of developing type 2 diabetes mellitus and cardiovascular disease, but the influence of dietary modification in the metabolism of glucose and insulin in these individuals is extremely important. Insulin resistance is a central component of MS, and replacing consumption of refined cereals increases insulin secretion in these individuals, and thus can reduce the risk of glucose intolerance and development of T2DM35. Consumption of whole grains is associated with reduced risk of developing chronic diseases such as cancer, type 2
diabetes mellitus, and cardiovascular diseases36. Individuals who consume diets rich in whole grains have low prevalence of MS36. Whole foods can provide protection against the effects of weight gain and maintenance of sensitivity to insulin36.
In the study by Berg et al37, who investigated the relationship of dietary patterns in individuals and the risk of developing cardiovascular diseases, the findings showed that those who consumed more frequently a dietary pattern characterized by an adequate intake of foods rich in fiber and low consumption of fatty and sugary food sources had lower levels of WHR and BMI than the others in the sample37.
In our study, when we compare the variables of meal frequency, dietary intake of fruits, vegetables, whole milk, skim milk, whole grains and beans at the beginning and end of the intervention, we observe that in the intervention group there was a statistically significant association in reduction of whole milk consumption and increased consumption of whole grains, whereas in the Control Group there was a statistically significant association of reduction in whole milk consumption, increased consumption of skim milk and increased consumption of whole grains.
Individuals with MS have difficulty in adhering to the diet proposed. Mirmirani et al38, after researching the eating habits of individuals with MS, found an association of disease with a high intake of fat, and dietary patterns considered little healthy38.
In our results, we have found an inverse statistically significant association between increase in vegetable intake and reduction of triglycerides in the intervention group. Consuming a diet rich in vegetables and fruits is associated with a healthier metabolic profile, with low concentrations of TC and LDL, and reduced risk of developing diabetes and improved glycemic control and sensitivity to insulin38. In a well-designed survey conducted by Panagiotakos et al, which evaluated the association between eating habits and the prevalence of MS in Greek individuals, the researchers concluded that a dietary pattern that includes the consumption of whole grains, greens, vegetables, fruits and fish is associated with reduced clinical markers of MS, while the consumption of red meat and alcohol has shown an inverse association39.
Conclusions
References
1. Pereira MA, Jacobs DRJ, van Horn L, Slattery ML, Kartashov AI, Ludwig DS. Dairy consumption, obesity, and the insuli resistance syndrome in young adults: the Cardia study. JAMA. 2002;287(16):2081-9.
2. National Cholesterol Education Program (NCEP) Expert Panel on Detection, Evaluation, and Treatment of High Blood Cholesterol in Adults (Adult Treatment Panel III). Third report of the National Cholesterol Education Program expert panel on detection, evaluation, and treatment of high blood cholesterol in adults - Adult Treatment Panel III (NCEP-ATP III). Final Report. Circulation. 2002;106(25):3143-21.
3. Salaroli LB, Barbosa GC, Mill JG, Molina MCB. Prevalência de síndrome metabólica em estudo de base populacional, Vitória, ES - Brasil. Arq Bras Endocrinol Metab. 2007;51(7):1143-52.
4. Franco GP, Scala LC, Alves CJ, França GV, Cassanelli T, Jardim PC. Metabolic syndrome in patients with high blood pressure in Cuiabá-Mato Grosso State: prevalence and associated factors. Arq Bras Cardiol. 2009; 92(6):437-42, 456-61, 472-8.
5. Bopp M, Barbiero S. Prevalence of metabolic syndrome in outpatients of the institute of cardiology of Rio Grande do Sul. Arq Bras Cardiol. 2009;93(5):473-7.
6. Picon PX, Zanatta C, Gerchaman F, Zelmanovitz T, Gross JL, Canan LH. Análise dos critérios de definição da síndrome metabólica em pacientes com diabetes melito tipo 2. Arq Bras Endocrinol Metab. 2006;50(2):264-70.
7. Zimmet P, Alberti KG, Shaw J. Global and sociental implcations of the diabetes epidemic. Nature. 2001;414(6865):782-7.
8. Wilson PWF, D´Agostino RB, Parise H, Sullivan L, Meigs JB. Metabolic syndrome as a precursos of cardiovascular disease and type 2 diabetes mellitus. Circulation. 2005;112(20):3066-72.
9. Steemburgo T, Dall’Alba V, Gross JL, Azevedo MJ. Fatores dietéticos e síndrome metabólica. Arq Bras Endocrinol Metab. 2007;51(19):1425-33.
10. Gottschall CBA; Busnello FM. Terapia nutricional da síndrome metabólica. In: Gottschall CBA, Busnello FM. Nutrição e síndrome metabólica. São Paulo: Editora Atheneu; 2009. p. 177-83.
11. Oliveira AR. Síndrome metabólica e exercício. In: Gottschall CBA, Busnello FM. Nutrição e síndrome metabólica. São Paulo: Editora Atheneu; 2009. p. 291-303.
12. Silveira LMC, Ribeiro VMB. Grupo de adesão ao tratamento: espaço de “ensinagem” para profissionais de saúde e pacientes. Interface – Comunic Saúde Educ. 2004;9(16):91-104.
13. Reppold CT, Poersch AL, Mazoni CG. Aspectos psicológicos e adesão ao tratamento. In: Gottschall CBA, Busnello FM. Nutrição e síndrome metabólica. São Paulo: Editora Atheneu; 2009. p.
14. Dallal GE. Randomization Plans: randomizing the order in which subjects receive multiple treatments. [cited 2010 Apr. 20]. Available from: http://www. randomization.com.
15. Physical status: the use and interpretation of anthropometry. World Health Organ Tech Rep Ser. 1995;854:1-452.
16. National Institutes of Health (NIH). The practical guide to the identification, evaluation, and treatment of overweight and obesity in adults. [cited 2010 Nov 8]. Available from: http://www.nhibi.nih.gov/guidelines/obesity/prdtge_c.pdf.
17. Janssen I, Katzmarzyk PT, Ross R. Body mass index, waist circumference, and health risk: evidence in support of current National Institutes of Health guidelines. Arch Intern Med. 2002;162(18):2074-9.
18. Brandão AP, Brandão AA, Nogueira AR, Suplicy H, Guimarães JI, Oliveira JEP / Sociedade Brasileira de Cardiologia / Sociedade Brasileira de Hipertensão / Sociedade Brasileira de Endocrinologia e Metabologia / Sociedade Brasileira de Dieabetes / Associação Brasileira para Estudos da Obesidadel. I Diretriz brasileira de diagnóstico e tratamento da síndrome metabólica. Arq Bras Cardiol. 2005;84(supl 1):1-28.
19. See R, Abdullah SM, McGuire DK, Khera A, Patel MJ, Lindsey JB, et al. The association of differing measures of overweight and obesity with prevalent atherosclerosis: the Dallas Heart Study. J Am Coll Cardiol. 2007;50(8):752-9.
20. Martin SE, Mathur R, Marshall I, Dougrlas NJ. The effect of age, sex, obesity and posture on upper airway size. Eur Respir J. 1997;10(9):2087-90.
21. Santos RD, Giannini SD, Fonseca FH, Moriguchi EH / Sociedade Brasileira de Cardiologia. III Diretrizes brasileiras sobre dislipidemias e diretriz de prevenção da aterosclerose do Departamento de Aterosclerose da Sociedade Brasileira de Cardiologia. Arq Bras Cardiol. 2001;77(supl 3):1-48.
22. Musunuru K, Kral BG, Blumenthal RS, Fuster V, Campbell CY, Gluckman TJ, et al. The use of high-sensitivity assays for C-reactive protein in clinical practice. Nat Clin Pract Cardiovasc Med. 2008;5(10):621-35.
23. Aldana SG, Greenlaw RL, Diehl HA, Salberg A, Merrill RM, Ohimine S, et al. Effects of an intensive diet and physical activity modification program on the health risks of adults. J Am Diet Assoc. 2005;105(3):371-81.
24. Corica F, Corsonello A, Apolone G, Mannucci E, Lucchetti M, Bonfiglio C, et al. Metabolic syndrome, psychological status and quality of life in obesity: the QUOVADIS study. Int J Obes(Lond). 2008;32:185-91.
25. Guimarães NG, Dutra ES, Eliane S, Ito MK, Carvalho KMB. Adesão a um programa de aconselhamento nutricional para adultos com excesso de peso e comorbidades. Rev nutr. 2010;23(3):323-33.
26. Inelmen EM, Toffanello ED, Enzi G, Gasparini G, Mioto F, Sergi G, et al. Predictors of drop-out in overweight and obese outpatients. Int J Obes(Lond). 2005;29(1):122-8.
27. Teixeira PJ, Going SB, Houtkooper LB, Cussler EC, Metcalfe LL, Blew RM, et al. Pretreatment predictors of attrition and successful weight management in women. Int J Obes Relat Metab Disord. 2004;28(9):1124-33.
28. Dagenais GR, Yi Q, Mann JF, Bosch J, Pogue J, Yusuf S. Prognostic impact of body weight and abdominal obesity in women and men with cardiovascular disease. Am Heart J. 2005;149(1):54-60.
29. Yusuf S, Hawken S, Ounpuu S, Bautista L, Franzosi MG, Commerford P, et al. Obesity and the risk of myocardial infarction in 27,000 participants from 52 countries: a case-control study. Lancet. 2005;366(9497):1640-9.
30. Junqueira ASM, Romeo Filho LJM, Junqueira CLC. Avaliação do grau de inflamação vascular em pacientes com síndrome metabólica. Arq Bras Cardiol. 2009;93(4):360-6.
31. Rutter MK, Meigs JB, Sullivan LM, D’Agostino RB, Wilson PW. C-reactive protein, the metabolic syndrome, and prediction of cardiovascular events in the Framingham Offspring Study. Circulation. 2004;110(4):380-5.
to assess adherence to treatment in patients with chronic diseases, so we can constantly improve health care in this population.
Potential Conflict of Interest
No potential conflict of interest relevant to this article was reported.
Sources of Funding
There were no external funding sources for this study.
Study Association
32. Saijo Y, Kiyota N, Kawasaki Y, Miyazaki Y, Kashimura J, Fukuda M, et al. Relationship between C-reactive protein and visceral adipose tissue in healthy Japanese subjects. Diabetes Obes Metab. 2004;6(4):249-58.
33. Ben-Noun LL, Laor A. Relationship between changes in neck circumference and cardiovascular risk factors. Exp Clin Cardiol. 2006;11(1):14-20.
34. Yang GR, Yuan SY, Fu HJ, Wan G, Zhu LX, Bu XL, et al. Neck circumference positively related with central obesity, overweight, and metabolic syndrome in Chinese subjects with type 2 diabetes: Beijing Community Diabetes Study 4. Diabetes Care. 2010;33(11):2465-7.
35. Laaksonen DE, Toppinen LK, Juntunen KS, Autio K, Liukkonen KH, Poutanen KS, et al. Dietary carbohydrates modification enhances insulin secretion in persons with the metabolic syndrome. Am J Clin Nutr. 2005;82(6):1218-27.
36. Sahyoun NR, Jacques PF, Zhang XL, Juan W, McKeown NM. Whole-grain intake is inversely associated with the metabolic syndrome and mortality in older adults. Am J Clin Nutr. 2006;83(1):124-31.
37. Berg CM, Lappas G, Strandhagen E, Wolk A, Torén K, Rosengren A, et al. Food patterns and cardiovascular disease risk factors: the Swedish INTERGENE research program. Am J Clin Nutr. 2008;88(1):289-97.
38. Mirmiran P, Noori N, Zavareh MB, Azizi F. Fruit and vegetable consumption and risk factors for cardiovascular disease. Metabolism. 2009;58(4):460-8.