Disease Activity in Multiple Sclerosis
Finn Sellebjerg1*, Martin Krakauer1, Signe Limborg1, Dan Hesse1, Henrik Lund2, Annika Langkilde3,
Helle Bach Søndergaard1, Per Soelberg Sørensen1
1Danish Multiple Sclerosis Center, Department of Neurology, Copenhagen University Hospital Rigshospitalet, Copenhagen, Denmark,2Danish Research Centre for Magnetic Resonance, Section 340, Copenhagen University Hospital Hvidovre, Hvidovre, Denmark, 3Department of Radiology, Copenhagen University Hospital Rigshopitalet, Copenhagen, Denmark
Abstract
Although treatment of multiple sclerosis (MS) with the type I interferon (IFN) IFN-b lowers disease activity, the role of endogenous type I IFN in MS remains controversial. We studied CD4+ T cells and CD4+ T cell subsets, monocytes and
dendritic cells by flow cytometry and analysed the relationship with endogenous type I IFN-like activity, the effect of IFN-b therapy, and clinical and magnetic resonance imaging (MRI) disease activity in MS patients. Endogenous type I IFN activity was associated with decreased expression of the integrin subunit CD49d (VLA-4) on CD4+CD26highT cells (Th1 helper cells),
and this effect was associated with less MRI disease activity. IFN-btherapy reduced CD49d expression on CD4+CD26highT
cells, and the percentage of CD4+CD26highT cells that were CD49dhighcorrelated with clinical and MRI disease activity in
patients treated with IFN-b. Treatment with IFN-balso increased the percentage of CD4+T cells expressing CD71 and
HLA-DR (activated T cells), and this was associated with an increased risk of clinical disease activity. In contrast, induction of CD71 and HLA-DR was not observed in untreated MS patients with evidence of endogenous type IFN I activity. In conclusion, the effects of IFN-btreatment and endogenous type I IFN activity on VLA-4 expression are similar and associated with control of disease activity. However, immune-activating effects of treatment with IFN-b may counteract the beneficial effects of treatment and cause an insufficient response to therapy.
Citation:Sellebjerg F, Krakauer M, Limborg S, Hesse D, Lund H, et al. (2012) Endogenous and Recombinant Type I Interferons and Disease Activity in Multiple Sclerosis. PLoS ONE 7(6): e35927. doi:10.1371/journal.pone.0035927
Editor:Celia Oreja-Guevara, University Hospital La Paz, Spain
ReceivedJanuary 12, 2012;AcceptedMarch 24, 2012;PublishedJune 6, 2012
Copyright:ß2012 Sellebjerg et al. This is an open-access article distributed under the terms of the Creative Commons Attribution License, which permits unrestricted use, distribution, and reproduction in any medium, provided the original author and source are credited.
Funding:This study was supported by grants from the Danish Multiple Sclerosis Society, the Warwara Larsen Foundation, the Johnsen Foundation, the Danish Council for Independent Research [grant 271-06-0246] and the Danish Council for Strategic Research [grant 2142-08-0039]. The funders had no role in study design, data collection and analysis, decision to publish, or preparation of the manuscript.
Competing Interests:Finn Sellebjerg has served on scientific advisory boards for and received funding for travel from Biogen Idec, Merck-Serono, Novartis, Sanofi-Aventis and Teva; served as a consultant for Biogen Idec and Novo Nordisk; received speaker honoraria from Bayer-Schering, Biogen Idec, Merck-Serono, Novartis, Sanofi-Aventis and Schering-Ploug; has received research support from Biogen Idec, Merck-Serono, Novartis and Sanofi-Aventis; and serves as section editor on Multiple Sclerosis and Related Disorders. Dan Hesse has received funding for travel from Biogen Idec, Merck-Serono, and Sanofi-Aventis; and received speaker honoraria from Sanofi-Aventis and Biogen Idec. Signe Limborg reports no disclosures. Helle Bach Søndergaard reports no disclosures. Martin Krakauer reports no disclosures. Per Soelberg Sorensen has served on scientific advisory boards Biogen Idec, Merck Serono, Novartis, Genmab, TEVA, Elan, GSK, has been on steering committees or independent data monitoring boards in clinical trials sponsored by Merck Serono, Genmab, TEVA, GSK, Bayer Schering, and has received funding of travel for these activities; has served as Editor-in-Chief of the European Journal of Neurology, and is editorial board member for Therapeutic Advances in Neurological Disorders and Multiple Sclerosis; has received speaker honoraria from Biogen Idec, Merck Serono, TEVA, Bayer Schering, Sanofi-aventis, and Novartis; and has received research support from Biogen Idec, Bayer Schering, Merck Serono, TEVA, Baxter, Sanofi-Aventis, BioMS, Novartis, Bayer, RoFAR, Roche, Genzyme, from the Danish Multiple Sclerosis Society, the Danish Medical Research Council, and the European Union Sixth Framework Programme: Life sciences, Genomics and Biotechnology for health. This does not alter our adherence to all the PLoS ONE policies on sharing data and materials.
* E-mail: [email protected]
Introduction
The type I interferons (IFNs) IFN-aand IFN-bare produced in response to viral infections and induce changes in cellular function by binding to specific receptors on the cell surface, resulting in the induction or repression of numerous genes and a wide range of antiviral and immunological effects [1,2]. Treatment with recombinant interferon IFN-b decreases disease activity in relapsing-remitting multiple sclerosis (MS) by approximately 30% [3–5].
Recent studies have identified an endogenous type I IFN gene expression signature in a subgroup of untreated patients with MS [6,7]. This response has been linked with expression of the immunoregulatory cytokine interleukin (IL)-10, the immunoregu-latory transcription factor FoxP3 and protection from disease
activity in untreated MS patients and during subsequent treatment with IFN-b[8–10]. Furthermore, the expression of IL-10 is lower in patients who have developed neutralizing antibodies to IFN-b
than in other untreated MS patients and healthy control subjects, suggesting that endogenous IFN-bis involved in the induction of IL-10 [9]. Other studies have, however, suggested that the expression of IFN-stimulated genes in untreated MS patients is associated with a diminished capacity to induce IFN-stimulated genes and a higher risk of breakthrough disease upon subsequent treatment with exogenous IFN-b [11]. The reason for these differences, which indicate completely different roles of endoge-nous and exogeendoge-nous IFN-b in the pathogenesis of MS, is unknown.
To further explore this subject, we compared the effect of IFN-b
type I IFN activity on CD4+ T cell and T cell subset activation, monocyte and DC activation and clinical and magnetic resonance imaging disease activity in MS. The CD4+T cell subsets studied were identified according to their expression of CD25 (the IL-2 receptora-chain) and CD26. CD25 is expressed at high levels on regulatory T cells but also on highly activated effector T cells [12,13]. CD26 expression identifies a subset of CD4+T cells with a T helper type 1 (Th1) phenotype previously implicated in the pathogenesis of MS [14–17]. This study identifies parallels between the effects of endogenous type I IFN-like activity and the effects of treatment with IFN-b that are associated with a reduction in disease activity. However, IFN-btherapy is also found to have additional effects on circulating T cells, some of which are associated with an unexpected increase in the risk of disease activity.
Materials and Methods
Patient Material
The study was approved by the regional ethics committee of Copenhagen and Frederiksberg (KF01–041/95). All patients provided written informed consent. Venous blood samples were obtained from 39 untreated patients with relapsing-remitting MS of whom 24 subsequently began treatment with IFN-b (IFN-b1a 30mg once weekly in 19 patients, IFN-b1a 44mg three times weekly in 4 patients and IFN-b1b 250mg every other day in one patient). These patients were followed with serial blood samples after three and six months of therapy [8]. One patient who developed neutralizing anti-IFN-bantibodies after six months of therapy was excluded from the subsequent analysis. Blood samples from this cohort were obtained 9–12 hours after an injection of IFN-b. In addition, we studied 40 patients who had been treated with IFN-bfor at least six months (including 14 patients who were also included in the first cohort); 20 of these patients were treated with IFN-b1a 30mg once weekly and 20 received IFN-b1a 44mg three times weekly. Blood samples from these patients were obtained 36–48 hours after an injection of IFN-b. Further description of the cohorts is presented in Table 1. A control group consisting of 12 healthy volunteers (8 women and 4 men; median age 31 years, range 26–46 years) was also included in the study.
Assessment of Disease Activity
Clinical activity was defined as the occurrence of a confirmed relapse (new or recurrence of previous symptoms of MS lasting
.24 hours, in the absence of fever or signs of systemic infection, and with findings on neurological examination consistent with the symptoms). All patients were followed up with biannual control
visits for one year and acute visits in case of new symptoms suggesting a relapse. Time to first relapse was established for all patients.
Magnetic Resonance Imaging
MRI was performed using a 3.0 T whole body scanner (Trio, Siemens, Erlangen, Germany), maximum gradients 40 mT/m, 8-channel head coil within one week of all blood samplings [8]. To quantify the lesion load, fluid-attenuated inversion recovery (FLAIR) and proton density/T2 weighted 2D imaging sequences were used. A T1-weighted 3D imaging sequence (Magnetization Prepared RApid Gradient Echo (MPRAGE) was acquired approximately 15 minutes post-intravenous gadolinium (Gd) administration (0.2 mmol/kg body weight of Magnevist (Schering AG, Berlin, Germany)). T2 lesions and enhancing lesions were detected and counted by an experienced technician using in-house developed software.
Flow Cytometry Analysis of CD4+T Cells and Antigen-presenting Cells
A lyse-and-wash whole blood staining procedure, where whole blood samples were stained with a cocktail of pretitrated fluoresceinated monoclonal antibodies, lysed, washed and ana-lyzed on a BD FACSCaliburTM flow cytometer, was used to analyse CD4+, CD25high and CD26high T cells and CD14+ monocytes. Staining with anti-HLA-DR, a lineage antibody cocktail, anti-CD11a (expressed on myeloid dendritic cells) and anti-CD123 (expressed on plasmacytoid dendritic cells) antibodies were used for the identification of dendritic cells. Isotype control reagents and unstained controls were used to control for non-specific antibody binding and autofluorescence. Analysis of list-mode files was conducted with the BD FACSDivaTM software (Becton Dickinson). A list of all surface markers studied is given in Table S1.
In vitro Analysis of T Cell Activation
Blood mononuclear cells (MNCs) were isolated from heparin-ised venous blood from 11 healthy volunteers using density gradient centrifugation of heparinised venous blood on Lympho-prep. All incubations were performed at 37uC with 5% CO2 in RPMI1640 medium (Invitrogen, Taastrup, Denmark) supple-mented with 5% human serum albumin. The cells were cultured for 24 hours in 6-well plates at a concentration of 26106cells/ml with 1 ng/ml recombinant human IFN-b1a (Avonex, Biogen-Idec, Cambridge, MA, USA), 10 ng/ml 6-a-methylprednisolone (MP) dissolved in dimethylsulfoxide (Sigma), IFN-b1a and MP, or none of these drugs. After 24 hours the cells were washed, and
Table 1.Overview of the patient material.
Untreated (n = 39)
Interferon-treated (early cohort, n = 23)
Interferon-treated (late cohort, n = 40)
Median age (range) 33 years (23–53) 30 years (23–46) 33 years (23–57)
Gender 24 women/15 men 15 women/8 men 26 women/14 men
Median duration of disease 4 years (1–25) 2 years (1–12) 5.5 years (1–20)
Median Kurtzke EDSS score (range) 2.0 (0–6.0) 1.0 (0–6.0) 2.0 (0–6.0)
Duration of treatment – – 2 years (0.5–9.5)
Median relapse rate year prior to study inclusion (range)
1/year (0–4) 1/year (0–4) 0/year (0–4)
CD4+and CD8+T cells’ expression of CD25, CD69, CD71 and annexin V binding (a measure of apoptotic cell death) was measured by flow cytometry and FOXP3 gene expression was
measured by PCR analysis.
Gene Expression Analysis
Expression of MX1 (encoding the type I interferon-induced
myxovirus resistance A molecule), FOXP3 and the chemokine CXCL10was measured in whole blood cells or cultured MNCs by
quantitative real-time polymerase chain reaction (PCR) analysis as previously described [9,18].
Statistical Analysis
The sample size was based on previous studies on the effects of IFN-bin small patient cohorts and on studies reporting that gene expression profiling in 22 MS patients could identify subgroups with different disease courses during treatment with IFN-b [19– 21]. Values are given as median with inter-quartile range. Statistical testing was by the Wilcoxon test, the Mann-Whitney U-test, paired t-test, non-parametric correlation analysis (Spear-man rank correlation coefficient [SRCC]), Cox regression analysis (hazard ratio with 95% confidence interval), the log-rank test and Kaplan-Meier plots. P,0.05 (two-sided testing) was considered significant; a Bonferroni correction was applied to post-hoc Man-Whitney tests after Wilcoxon analyses.
Results
Circulating APCs and CD4+T Cells
Anti-CD25 and anti-CD26 antibody staining identified a population of CD25highCD4+T cells with intermediate expres-sion of CD26 and a population of CD26highCD4+ T cells with intermediate expression of CD25 (Figure S1). The CD4+CD25high population constituted 2.1% (IQR 0.5%) of CD4+T cells and the CD4+CD26high population constituted 12% (IQR 6.8%) of the CD4+ T cells in blood from healthy controls. There was no difference in the percentage of these subsets between MS patients and controls, but MS patients had a higher percentage of CD4+CD25highT cells expressing CCR5 (Figure S2). MS patients also had a higher percentage of DCs expressing CD80 than did healthy controls (Figure S2). There was no difference in the absolute number of circulating leukocytes, lymphocytes, mono-cytes, dendritic cells, CD3+T cells or CD4+T cells in untreated MS patients and healthy controls, and the expression of all other molecules studied was comparable in untreated MS patients and healthy controls (data not shown).
Endogenous Type I IFN Activity in Untreated MS The expression ofMX1 mRNA was associated with a type I
IFN-induced gene expression signature in 36 of the untreated MS patients included in the present study [9]. The percentage of CD4+CD26highT cells that were CD49dhighcorrelated negatively with expression of MX1 mRNA in blood cells (Figure 1).
Expression of FOXP3 in blood cells also correlated negatively
with the percentage of CD49dhighCD4+T cells (SRCC =20.50, p = 0.002), whereas there was no correlation withIL10expression
(data not shown). There were no other significant relationships between MX1 gene expression and CD4+ T cell or APC
activation, but the expression ofMX1 correlated with expression
of the chemokineCXCL10 (Figure 1) which, in turn, correlated
negatively with the percentage of CD4+CD26high T cells that expressed the CXCL10 receptor CXCR3 (Figure 1).
Figure 1. T cell activation, CXCL10 and MX1 expression. The relationship between the percentage of CD4+CD26high T cells expressing CD49d or CXCR3 and the expression ofMX1 andCXCL10
mRNA in blood mononuclear cells from untreated patients with relapsing-remitting multiple sclerosis was analysed by Spearman rank correlation coefficients (SRCC).
Effects of IFN-bon CD4+ T Cell and APC Activation Treatment with IFN-b transiently decreased the number of circulating lymphocytes, dendritic cells and CD3+ and CD4+ T cells and increased the number of monocytes 9–12 hours after an injection of IFN-b(Table S2). These effects were not observed 36–48 hours post-injection. Other effects of IFN-bwere persistent as they were observed both 9–12 and 36–48 hours after an injection of IFN-b: an increased percentage of CD4+ and CD4+CD25highT cells expressing CD71; an increased percentage of CD4+T cells expressing HLA-DR; a decreased percentage of CD4+CD26high T cells that were CXCR3
+ or CD49dhigh; an increased percentage of monocytes expressing CD86; and a decreased percentage of dendritic cells expressing CCR5 (Table S2). Other statistically significant effects observed either 9–12 or 36–48 hours post-injection are summarized in Table S2. There were no significant differences between the patients treated with IFN-b1a 30mg once weekly and patients treated with IFN-b1a 44mg three times weekly.
IFN-b Treatment and MRI Disease Activity
At the six months scan 7/23 patients (30%) had one or more Gd-enhancing lesions on MRI (median 1, range 1–12 lesions) and 15/23 patients had one or more new or enlarged T2-weighted MRI lesions during the six months of follow-up (median 3, range 1–27 lesions). The relationship between the number of Gd-enhancing lesions at month 6 and the number of new or enlarged T2 lesions and the immunological variables is shown in Table 2. The percentage of CD4+CD26highT cells that were CD49dhigh correlated positively with the number of Gd-enhancing MRI lesions (SRCC = 0.58, p = 0.006) and the number of new or enlarged T2 lesions (SRCC = 0.46, p = 0.042). The percentage of CD4+CD25highT cells that were CD137+correlated negatively with the number of Gd-enhancing lesions (SRCC =20.47, p = 0.025) and the number of new or enlarged T2 lesions (SRCC =20.64, p = 0.001).
IFN-b Treatment and Clinical Disease Activity
In univariate Cox regression analyses the one-year relapse risk was associated with several variables in samples obtained early after an injection of IFN-b after 6 months of treatment: the
percentage of dendritic cells expressing CD40 and CD80; the percentage of CD4+ T cells that were CD62Lhigh or expressed CD71, CD95 or HLA-DR; the percentage of CD4+CD25highcells that expressed CD137; and the percentage of CD4+CD26highcells that were CD49dhigh (Table 2). In multivariate analyses the percentage of CD4+ T cells expressing HLA-DR (hazard ratio 1.89 [1.13–3.16], p = 0.015) and the percentage of dendritic cells expressing CD40 (hazard ratio 1.84 [1.16–2.90], p = 0.009) were independent predictors of relapse risk. Although MRI disease activity was associated with relapse risk in a univariate analysis [8], Gd-enhancing MRI lesions were not an independent predictor of relapse risk. Neither did baseline flow cytometry results correlate with disease activity on subsequent treatment with IFN-b(data not shown).
The relationship between CD40 expression on dendritic cells and HLA-DR expression on CD4+ T cells and relapse risk was further analysed in the 40 patients from whom blood samples were obtained 36–48 hours after an injection of IFN-b. In this cohort there was no relationship between CD40 expression on dendritic cells and relapse risk. However, patients with a percentage of HLA-DR positive CD4+ T cells above median had a higher relapse risk than patients with below median values (Figure 2). This relationship was highly significant in patients with a disease duration of less than 5 years (n = 19, p = 0.003) and in patients treated with IFN-b for less than two years (n = 21, p = 0.004) (Figure 2). Gd-enhancing MRI lesions were observed in 10/40 of these patients but were not an independent predictor of relapse risk in the multivariate analysis.
Correlation between Flow Cytometry Measurements Comparing values obtained 9–12 hours after an injection of IFN-bafter six months of treatment we found moderate positive correlations (SRCC.0.5) between the percentage of CD4+T cells expressing CD95 and HLA-DR (SRCC = 0.71, p,0.001) and CD71 (SRCC = 0.73, p,0.001); between the percentage of CD4+CD25highT cells expressing CD137 and the percentage of CD4+ T cells that were CD62Lhigh; and a negative correlation between the percentage of CD4+CD25high T cells expressing CD137 and the percentage of CD4+CD26high T cells that were CD49dhigh.
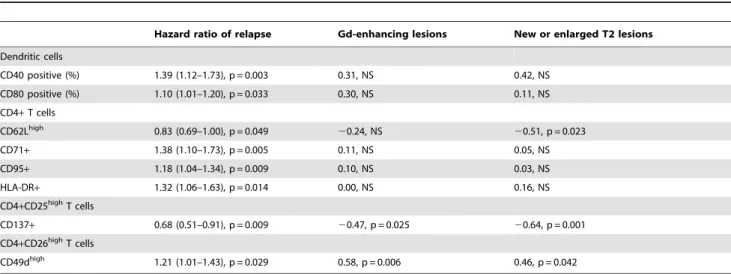
Table 2.Immune activation and disease activity.
Hazard ratio of relapse Gd-enhancing lesions New or enlarged T2 lesions
Dendritic cells
CD40 positive (%) 1.39 (1.12–1.73), p = 0.003 0.31, NS 0.42, NS CD80 positive (%) 1.10 (1.01–1.20), p = 0.033 0.30, NS 0.11, NS
CD4+T cells
CD62Lhigh 0.83 (0.69–1.00), p = 0.049 20.24, NS 20.51, p = 0.023
CD71+ 1.38 (1.10–1.73), p = 0.005 0.11, NS 0.05, NS
CD95+ 1.18 (1.04–1.34), p = 0.009 0.10, NS 0.03, NS
HLA-DR+ 1.32 (1.06–1.63), p = 0.014 0.00, NS 0.16, NS
CD4+CD25highT cells
CD137+ 0.68 (0.51–0.91), p = 0.009 20.47, p = 0.025 20.64, p = 0.001
CD4+CD26highT cells
CD49dhigh 1.21 (1.01–1.43), p = 0.029 0.58, p = 0.006 0.46, p = 0.042
Relapse risk, magnetic resonance imaging disease activity, T cell and dendritic cell activation in blood samples obtained 9–12 hours after an injection of interferon-bin 23 MS patients treated with interferon-bfor six months.
The variability of the flow cytometry measurements was analysed by comparing the results of the flow cytometry measurements after three and six months of therapy. The percentage of CD4+T cells expressing HLA-DR (SRCC = 0.71, p,0.001), CD95 (SRCC = 0.51, p = 0.027) or that were CD62Lhigh (SRCC = 0.63, p = 0.003) correlated after three and six months of therapy (data not shown). There were no significant correlations between month 3 and month 6 results for the other variables studied.
In vitro Studies of T Cell Activation by Interferon-b
The effect of IFN-band MP on CD4+T cells was studied after 24 hours ofin vitro treatment of MNCs from healthy volunteers
(Table 3). Treatment with IFN-b or IFN-b in combination with MP did not affect the viability of the cells as assessed by annexin V staining, but MP increased the percentage of annexin V-binding CD4+ T cells (p,0.001). Incubation with IFN-b increased the percentage of CD4+ T cells that were CD25+ (p,0.001), CD25high(p,0.001) and CD71+(p = 0.01) and the expression of
FOXP3 mRNA in MNCs (p = 0.005) compared with untreated
cells. Treatment with MP alone reduced the percentage of CD4+ T cells that were CD25high(p = 0.002) or CD71+(p = 0.011) and reduced FOXP3expression (p = 0.024) compared with untreated
cells. Combination treatment with IFN-band MP increased the percentage of CD4+that cells that were CD25+T cells but had no effect on CD25highor CD71+ CD4+ T cells orFOXP3 mRNA
expression.
Discussion
The major findings in the present study are that: 1) endogenous type I IFN-like activity and treatment with IFN-b are both associated with reduced expression of CD49d on CD26highCD4+ T cells (Th1 helper cells) and this correlates with MRI disease activity in IFN-b-treated MS patients; 2) treatment with IFN-b
also induces activation of CD4+ T cells, as evidenced by the induction of CD71 and HLA-DR, and this is associated with an increased relapse risk.
CD4+CD26high T cells are enriched for expression of Th1 markers and produce high levels of tumour necrosis factor
(TNF)-aand IFN-c[14,15]. Disease activity in relapsing-remitting MS and in patients with clinically isolated syndromes is associated with an increased percentage of circulating CD4+CD26+ T cells [14,16,17]. These findings indicate that CD26high T cells are a potential target for immunomodulatory MS treatments, and in a previous study we found that the number of circulating T cells, especially CD4+CD26+T cells, predicted relapses in MS patients treated with IFN-b [22]. CD49d is an integrin a-chain that together with the integrinb-chain CD29 molecule forms very late antigen (VLA)-4. The role of VLA-4 in the pathogenesis of MS is clearly evidenced by the efficacy of treatment with the anti-CD49d molecule natalizumab. CD49d is expressed at high levels on CD4+CD26highT cells, and CD4+CD49dhighT cells are increased in patients with active MS [15,23]. IFN-bdecreases the expression of CD49d in MS [20,24]. We extend these findings by showing that a decrease in CD49dhigh cells is found mainly in
Figure 2. T cell activation and relapse risk.Relationship between CD4+T cell expression of HLA-DR and relapse risk in 39 patients from whom blood samples were obtained 36–48 hours after an injection of interferon-b. Patients were dichotomized around the median and relapse risk was analysed in Kaplan-Meier plots and with the log-rank test in all patients and in subgroups of patients with a shorter duration of treatment or disease duration.
CD4+CD26high cells in patients treated with IFN-b and that endogenous type I IFN activity, as assessed by expression ofMX1,
correlates negatively with the percentage of CD4+CD26highT cells that are CD49dhigh. These findings suggest that not only IFN-b
treatment but also endogenous type I IFN may exert immuno-regulatory effects on CD49d, either directly or by indirect effects such as induction of soluble adhesion molecules [24].
The CCR5 and CXCR3 chemokine receptors are expressed on Th1 effector cells and are thought to be involved in the development of inflammatory brain lesions in MS while CCR7 is expressed on naive and central memory T cells. The decrease in CCR5 and CXCR3 expression and the concomitant increase in CCR7 expression observed on CD4+CD26high T cells in MS patients treated with IFN-b in the present study are consistent with reduced activation or a transition of cells within this T cell subset from tissue-homing effector cells to the central memory T cell subset. Indeed, treatment with IFN-b also reduced the expression of CD122 (the IL-2 receptor b-chain), CD134 (OX40), CD137 (4–1BB) and CD212 (the IL-12 receptor b2 chain) on CD4+CD26highT cells.
The observation of an increased percentage of HLA-DR and CD71 positive CD4+T cells afterin vivotreatment with IFN-bis
a novel observation, which was confirmedin vitrofor the CD71
induction on CD4+T cells. IFN-bhas previously been reported to induce the expression of activation markers on CD8+T cells in MS [21,25]. This is consistent with the results of studies demonstrating that type I IFN can enhance antiviral cytotoxic T cell and NK cell responses, i.e., an immune activating effect of type I IFN [1,26]. Furthermore, although the ex vivo
prolifer-ation of CD4+T cells is suppressed by type I IFNs,in vivoCD4+
T cell responses to some viruses are markedly enhanced by type I IFN signalling, and type I IFNs can promote the survival of T cells and enhance the differentiation of memory Th1 cells [27]; [28–30].
In our study the percentage of CD4+HLA-DR+T cells was an independent predictor of relapse risk both in patients from whom samples were obtained 9–12 hours and in patients from whom samples were obtained 36–48 hours after an injection of IFN-b. In the latter cohort this relationship was highly significant in patients studied within the first five years from onset of MS and during the first two years of treatment but not in the full patient material. This is likely to reflect that a more pristine patient population may be less selected than patients on long-term therapy, and therefore better suited for biomarker studies of the treatment response in MS.
We observed a negative correlation between the percentage of CD4+CD25highT cells expressing CD137 and clinical and MRI disease activity, consistent with the notion that this marker may reflect regulatory T cell activity [31]. We did, indeed, find thatin vitro treatment with IFN-b increased the percentage of CD4+T
cells that were CD25high and expression of FOXP3 mRNA. It
should, however, be emphasized that the CD4+CD25high T cell subset in MS consists of a mixture of highly activated effector cells and regulatory T cells, and functional studies are needed to substantiate a possible regulatory effect of CD4+CD25highT cells expressing CD137 in MS [13].
We observed a relationship between CD40 expression on dendritic cells and relapse risk in patients from whom blood samples were obtained 9–12 hours after an injection of IFN-b, but this was not confirmed in samples obtained 36–48 hours after an injection of IFN-b. The number of circulating dendritic cells was significantly reduced at the early time point and additional studies using more sophisticated phenotyping of dendritic cell subsets are necessary to establish the relationship between the effects on these cells and disease activity. We could not confirm that the induction of CD40, CD86 and PD-L2 on monocytes is associated with a beneficial response to treatment with IFN-b[32].
Finally the results highlight the importance of consistent timing of blood sampling in relation to IFN-binjections as many changes observed 9–12 hours after an injection of IFN-bwere not observed 36–48 hours post injection. The effects of IFN-b on gene expression are mainly transient, and some of these may translate into transient changes in the expression of cell surface molecules [18,33,34]. We observed a marked reduction in expression of the chemokine receptor CXCR3 expression 9–12 hours after an injection of IFN-b in all CD4+ T cell subsets studies. This may result from increases in plasma concentrations of the CXCR3 ligand CXCL10 [35,36]. Indeed, in untreated MS patients we found that the expression ofCXCL10mRNA correlated with the
expression of the type I IFN-inducedMX1molecule. Furthermore,
high CXCL10 mRNA expression correlated with low CXCR3
expression on CD4+T cells, suggesting that CXCL10 induced by endogenous type I IFN may regulate physiological T cell expression of CXCR3.
We conclude that the modulation of CD49d and other molecules on CD4+CD26high T cells may be one of the most important effects of IFN-bin MS, and may also be mediated by endogenous type I IFN activity. Conversely, the induction of HLA-DR and CD71 may reflect an unwanted, immune activating effect of IFN-b associated with an increased relapse risk. The induction of CD71 by IFN-b was preventable by combination treatment with methylprednisolone in vitro. It is tempting to
speculate that this may contribute to the efficacy of combination therapy with methylprednisolone and IFN-b, which significantly reduces the relapse rate in MS compared with IFN-b alone [37,38]. However, these conclusions are based on studies in small patient cohorts. Larger studies identifying the mechanisms underlying the relationship between T cell activation induced by IFN-b and relapse risk will be important not only for improving
Table 3.Ex vivo effect of interferon-b1a and methylprednisolone.
Control IFN-b MP IFN-band MP
CD4+Annexin V+ 5.6% (1.4) 5.0% (2.3), NS 8.9% (1.5), p,0.001 6.0% (1.7), NS
CD4+CD25+ 21% (2.3) 26% (2.3), p,0.001 20% (1.9), NS 24% (2.7), p = 0.007 CD4+CD25high 2.8% (0.23) 3.7% (0.39), p,0.001 1.9% (0.22), p = 0.002 3.1 (0.26), NS
CD4+CD71+ 0.54% (0.11) 0.77% (0.22), p = 0.01 0.40% (0.08), p = 0.011 0.44% (0.07), NS
FOXP3mRNA 2.8 (0.7) 6.2 (1.2), p = 0.005 0.93 (0.86), p = 0.024 2.0 (1.3), NS
Effect ofex vivotreatment of blood mononuclear cells (MNCs, n = 11) with interferon-b1a (IFN-b) and/or methylprednisolone (MP) for 24 hours on surface expression of CD25 and CD71 on CD4+T cells and expression ofFOXP3mRNA.
our understanding of this immunomodulatory MS therapy, but also for understanding what may be a natural, immunoregulatory role of type I IFN activity in MS.
Supporting Information
Figure S1 Principles for flow cytometry analysis.CD4+ T cells were idenfied according to light scatter and anti-CD4 antibody fluorescence intensity, and were subdivided into a CD25high and a CD26high subset according to anti-CD25 and anti-CD26 fluorescence intensity. Finally, the percentage of CD4+ T cells, CD25highand CD26highCD4+T cells expressing a panel of antigens was measured against an isotype control antibody (anti-CD49d staining in this example).
(DOC)
Figure S2 Immune activation in untreated multiple sclerosis.The percentage of CD4+CD26highT cells expressing CCR5 and the percentage of dendritic cells expressing CD80 was significantly higher in untreated multiple sclerosis without (Gd-) and with (Gd+) gadolinium-enhancing lesions magnetic resonance imaging lesions in the brain than in healthy control subjects. Statistical testing was by the Mann-Whitney U-test.
(DOC)
Table S1 Surface markers studied by flow cytometry.
This table lists the molecules studied by flow cytometry and their biological functions on T cells and antigen-presenting cells. (DOC)
Table S2 Flow cytometry results. Circulating cell counts, CD4+ T cell subsets, monocytes and dendritic cells in untreated MS patients (n = 39) and patients treated with interferon-b. Blood samples were obtained either 9–12 hours (early, n = 23) or 36–48 hours (late, n = 40) post-injection. Values are medians (inter-quartile range). Statistical testing was by Kruskal-Wallis tests for comparing the three groups groups. Mann-Whitney U-tests were used for post-hoc analysis with Bonferroni-corrected p-values (comparing each treatment group with untreated patients). NS = not significant. p,0.05*, p,0.01**, p,0.001***
(DOC)
Acknowledgments
The assistance of Joy Mendel-Hartvig in the flow cytometry studies and of Marie Koefoed in the gene expression studies is highly acknowledged.
Author Contributions
Conceived and designed the experiments: FS MK PSS. Performed the experiments: MK HBS DH SL HL. Analyzed the data: FS MK SL AL HL HBS PSS DH. Wrote the paper: FS MK SL AL HL HBS PSS DH.
References
1. Stetson DB, Medzhitov R (2006) Type I interferons in host defense. Immunity 25: 373–81.
2. Dhib-Jalbut S, Marks S (2010) Interferon-beta mechanisms of action in multiple sclerosis. Neurology 74 Suppl 1: S17–S24.
3. Jacobs LD, Cookfair DL, Rudick RA, Herndon RM, Richert JR, et al. (1996) Intramuscular interferon beta-1a for disease progression in relapsing multiple sclerosis. The Multiple Sclerosis Collaborative Research Group (MSCRG). Ann Neurol 39: 285–94.
4. PRISMS (Prevention of Relapses and Disability by Interferon beta-1a Subcutaneously in Multiple Sclerosis) Study Group (1998) Randomised double-blind placebo-controlled study of interferon beta-1a in relapsing/ remitting multiple sclerosis. Lancet 352: 1498–504.
5. The IFNB Multiple Sclerosis Study Group (1993) Interferon beta-1b is effective in relapsing-remitting multiple sclerosis. I. Clinical results of a multicenter, randomized, double-blind, placebo-controlled trial. Neurology 43: 655–61. 6. van Baarsen LG, van der Pouw Kraan TC, Kragt JJ, Baggen JM, Rustenburg F,
et al. (2006) A subtype of multiple sclerosis defined by an activated immune defense program. Genes Immun 7: 522–31.
7. Yamaguchi KD, Ruderman DL, Croze E, Wagner TC, Velichko S, et al. (2008) IFN-beta-regulated genes show abnormal expression in therapy-naive relapsing-remitting MS mononuclear cells: gene expression analysis employing all reported protein-protein interactions. J Neuroimmunol 195: 116–20. 8. Hesse D, Krakauer M, Lund H, Søndergaard HB, Langkilde A, et al. (2010)
Breakthrough disease during interferon-beta therapy in MS: No signs of impaired biologic response. Neurology 74: 1455–62.
9. Hesse D, Krakauer M, Lund H, Søndergaard HB, Limborg SJ, et al. (2011) Disease protection and interleukin-10 induction by endogenous interferon-beta in multiple sclerosis? Eur J Neurol 18: 266–72.
10. van der Voort LF, Vennegoor A, Visser A, Knol DL, Uitdehaag BM, et al. (2010) Spontaneous MxA mRNA level predicts relapses in patients with recently diagnosed MS. Neurology 75: 1228–33.
11. Comabella M, Lunemann JD, Rio J, Sa´nchez A, Lo´pez C, et al. (2009) A type I interferon signature in monocytes is associated with poor response to interferon-beta in multiple sclerosis. Brain 132: 3353–65.
12. Baecher-Allan C, Brown JA, Freeman GJ, Hafler DA (2001) CD4+CD25high regulatory cells in human peripheral blood. J Immunol 167: 1245–53. 13. Michel L, Berthelot L, Pettre S, Wiertlewski S, Lefre`re F, et al. (2008) Patients
with relapsing-remitting multiple sclerosis have normal Treg function when cells expressing IL-7 receptor alpha-chain are excluded from the analysis. J Clin Invest 118: 3411–9.
14. Jensen J, Langkilde AR, Fenst C, Nicolaisen MS, Roed HG, et al. (2004) CD4 T cell activation and disease activity at onset of multiple sclerosis. J Neuroimmunol 149: 202–9.
15. Krakauer M, Sorensen PS, Sellebjerg F (2006) CD4(+) memory T cells with high CD26 surface expression are enriched for Th1 markers and correlate with clinical severity of multiple sclerosis. J Neuroimmunol 181: 157–64. 16. Hafler DA, Fox DA, Manning ME, Schlossman SF, Reinherz EL, Weiner HL
(1985) In vivo activated T lymphocytes in the peripheral blood and
cerebrospinal fluid of patients with multiple sclerosis. N Engl J Med 312: 1405–11.
17. Khoury SJ, Guttmann CR, Orav EJ, Kikinis R, Jolesz FA, Weiner HL (2000) Changes in activated T cells in the blood correlate with disease activity in multiple sclerosis. Arch Neurol 57: 1183–9.
18. Sellebjerg F, Krakauer M, Hesse D, Ryder LP, Alsing I, et al. (2009) Identification of new sensitive biomarkers for the in vivo response to interferon-beta treatment in multiple sclerosis using DNA-array evaluation. Eur J Neurol 16: 1291–8.
19. Weinstock-Guttman B, Bhasi K, Badgett D, Taman˜o-Blanco M, Minhas M, et al. (2008) Genomic effects of once-weekly, intramuscular interferon-beta1a treatment after the first dose and on chronic dosing: Relationships to 5-year clinical outcomes in multiple sclerosis patients. J Neuroimmunol 205: 113–25. 20. Jensen J, Krakauer M, Sellebjerg F (2005) Cytokines and adhesion molecules in
multiple sclerosis patients treated with interferon-beta1b. Cytokine 29: 24–30. 21. Jensen J, Langkilde AR, Frederiksen JL, Sellebjerg F (2006) CD8+T cell
activation correlates with disease activity in clinically isolated syndromes and is regulated by interferon-beta treatment. J Neuroimmunol 179: 163–72. 22. Sellebjerg F, Ross C, Koch-Henriksen N, Sørensen PS, Frederiksen JL, et al.
(2005) CD26+CD4+T cell counts and attack risk in interferon-treated multiple sclerosis. Mult Scler 11: 641–5.
23. Barrau MA, Montalban X, Saez-Torres I, Brieva L, Barbera N, et al. (2000) CD4(+)CD45RO(+)CD49d(high) cells are involved in the pathogenesis of relapsing-remitting multiple sclerosis. J Neuroimmunol 111: 215–23. 24. Calabresi PA, Pelfrey CM, Tranquill LR, Maloni H, McFarland HF (1997)
VLA-4 expression on peripheral blood lymphocytes is downregulated after treatment of multiple sclerosis with interferon beta. Neurology 49: 1111–6. 25. Ossege LM, Sindern E, Patzold T, Malin JP (2001) Immunomodulatory effects
of interferon-beta-1b in patients with multiple sclerosis. Int Immunopharmacol 1: 1085–100.
26. Tough DF, Borrow P, Sprent J (1996) Induction of bystander T cell proliferation by viruses and type I interferon in vivo. Science 272: 1947–50.
27. Havenar-Daughton C, Kolumam GA, Murali-Krishna K (2006) Cutting Edge: The direct action of type I IFN on CD4 T cells is critical for sustaining clonal expansion in response to a viral but not a bacterial infection. J Immunol 176: 3315–9.
28. Krug A, Veeraswamy R, Pekosz A, Kanagawa O, Unanue ER, et al. (2003) Interferon-producing cells fail to induce proliferation of naive T cells but can promote expansion and T helper 1 differentiation of antigen-experienced unpolarized T cells. J Exp Med 197: 899–906.
29. Lombardi G, Dunne PJ, Scheel-Toellner D, Sanyal T, Pilling D, et al. (2000) Type 1 IFN maintains the survival of anergic CD4+T cells. J Immunol 165: 3782–9.
30. Marrack P, Kappler J, Mitchell T (1999) Type I interferons keep activated T cells alive. J Exp Med 189: 521–30.
32. Wiesemann E, Deb M, Trebst C, Hemmer B, Stangel M, Windhagen A (2008) Effects of interferon-beta on co-signaling molecules: upregulation of CD40, CD86 and PD-L2 on monocytes in relation to clinical response to interferon-beta treatment in patients with multiple sclerosis. Mult Scler 14: 166–76. 33. Sellebjerg F, Datta P, Larsen J, Rieneck K, Alsing I, et al. (2008) Gene
expression analysis of interferon-beta treatment in multiple sclerosis. Mult Scler 14: 615–21.
34. Weinstock-Guttman B, Badgett D, Patrick K, Hartrich L, Santos R, et al. (2003) Genomic effects of IFN-beta in multiple sclerosis patients. J Immunol 171: 2694–702.
35. Buttmann M, Merzyn C, Hofstetter HH, Rieckmann P (2007) TRAIL, CXCL10 and CCL2 plasma levels during long-term Interferon-beta treatment
of patients with multiple sclerosis correlate with flu-like adverse effects but do not predict therapeutic response. J Neuroimmunol 190: 170–6.
36. Krakauer M, Sorensen PS, Khademi M, Olsson T, Sellebjerg F (2006) Dynamic T-lymphocyte chemokine receptor expression induced by interferon-beta therapy in multiple sclerosis. Scand J Immunol 64: 155–63.