Contrasting Effects of Singlet Oxygen and Hydrogen
Peroxide on Bacterial Community Composition in a
Humic Lake
Stefanie P. Glaeser1,2, Bork A. Berghoff1,3, Verena Stratmann1, Hans-Peter Grossart4,5*, Jens Glaeser1*
1Institute for Microbiology and Molecular Biology, Justus-Liebig-University, Giessen, Germany,2Institute for Applied Microbiology, Justus-Liebig-University, Giessen, Germany,3Department of Cell & Molecular Biology, Uppsala University, Uppsala, Sweden,4Leibniz Institute of Freshwater Ecology and Inland Fisheries, Stechlin, Germany,5Institute for Biochemistry and Biology, Potsdam University, Potsdam, Germany
Abstract
Light excitation of humic matter generates reactive oxygen species (ROS) in surface waters of aquatic ecosystems. Abundant ROS generated in humic matter rich lakes include singlet oxygen (1O2) and hydrogen peroxide (H2O2). Because these ROS
differ in half-life time and toxicity, we compared their effects on microbial activity (14C-Leucine incorporation) and bacterial community composition (BCC) in surface waters of humic Lake Grosse Fuchskuhle (North-eastern Germany). For this purpose, experiments with water samples collected from the lake were conducted in July 2006, September 2008 and August 2009. Artificially increased1O
2and H2O2concentrations inhibited microbial activity in water samples to a similar
extent, but the effect of the respective ROS on BCC varied strongly. BCC analysis by 16S rRNA gene clone libraries and RT-PCR DGGE revealed ROS specific changes in relative abundance and activity of major bacterial groups and composition of dominating phylotypes. These changes were consistent in the three experiments performed in different years. The relative abundance ofPolynucleobacter necessarius, Limnohabitans-related phylotypes (Betaproteobacteria), andNovosphingobium acidiphilum(Alphaproteobacteria) increased or was not affected by photo-sensitized1O2exposure, but decreased after H2O2
exposure. The opposite pattern was found forActinobacteriaof the freshwater AcI-B cluster which were highly sensitive to
1O
2 but not to H2O2 exposure. Furthermore, group-specific RT-PCR DGGE analysis revealed that particle-attached P. necessarius and Limnohabitans-related phylotypes exhibit higher resistance to 1O2 exposure compared to free-living
populations. These results imply that1O2 acts as a factor in niche separation of closely affiliatedPolynucleobacter and Limnohabitans-related phylotypes. Consequently, oxidative stress caused by photochemical ROS generation should be regarded as an environmental variable determining abundance, activity, and phylotype composition of environmentally relevant bacterial groups, in particular in illuminated and humic matter rich waters.
Citation:Glaeser SP, Berghoff BA, Stratmann V, Grossart H-P, Glaeser J (2014) Contrasting Effects of Singlet Oxygen and Hydrogen Peroxide on Bacterial Community Composition in a Humic Lake. PLoS ONE 9(3): e92518. doi:10.1371/journal.pone.0092518
Editor:Luis Eduardo Soares Netto, Instituto de Biociencias - Universidade de Sa˜o Paulo, Brazil
ReceivedAugust 28, 2013;AcceptedFebruary 24, 2014;PublishedMarch 25, 2014
Copyright:ß2014 Glaeser et al. This is an open-access article distributed under the terms of the Creative Commons Attribution License, which permits unrestricted use, distribution, and reproduction in any medium, provided the original author and source are credited.
Funding:This work was supported by funds of the German Science Foundation (DFG) given to JG (JG-620/2-1) and to HPG (GR-1540/17-1 and PA- 1655/1-1). The funders had no role in study design, data collection and analysis, decision to publish, or preparation of the manuscript.
Competing Interests:The authors have declared that no competing interests exist. * E-mail: [email protected] (JG); [email protected] (H-PG)
Introduction
Dissolved organic matter (DOM) is the major carbon and energy source for heterotrophic bacteria in aquatic ecosystems [1]. Humic lakes are characterized by a high content of allochthonous DOM with recalcitrant high-molecular-weight poly-aromatic compounds. Photochemical transformations of these compounds generate low-molecular-weight substances and thereby stimulate microbial activity and growth [2,3]. On the other hand, photochemical processes lead to inhibitory effects including (i) photo-oxidation and (ii) transformation of labile compounds [4,5] as well as (iii) generation of reactive intermediates such as reactive oxygen species (ROS) [6,7,8]. ROS generation in aquatic ecosystems occurs by light excitation of DOM, in particular humic matter, and subsequent formation of triplet excited states in poly-aromatic compounds [8]. Light-excited DOM transfers energy or electrons to molecular oxygen. Thereby, the transfer of energy generates singlet oxygen (1O2) and the incomplete reduction of oxygen leads to the formation of hydrogen peroxide
(H2O2) and other ROS. Recent experiments strongly suggest that distinct structures in humic matter are linked to the formation of 1
O2 or H2O2 [9] and that the reaction of 1O2 with DOM generates small amounts of H2O2[9,10].
Effects of photochemically altered DOM on microorganisms were mainly investigated via inoculation of pre-irradiated DOM with natural microbial assemblages [11,12] including studies, which examined the effect of substrate availability on bacterial community composition (BCC) [13,14,15]. In a recent study, we showed that 1O2 has the potential to inhibit typical freshwater bacterial species and consequently affect BCC [16]. Singlet oxygen is highly reactive, exhibits a half-life time in water of,3.5ms [17], and causes cell damage by oxidation of lipids, nucleic acids, and proteins [18,19]. In contrast, H2O2has a half-life time of up to 8 hours in freshwater [20]. Moreover, H2O2 diffuses through biological membranes and mainly reacts with iron-sulphur clusters leading to subsequent intracellular hydroxyl radical formation and damage of biomolecules [21]. Hence, potentials for cell damage caused by1O2and H2O2differ substantially.
In a previous study, short and long term effects of1O2on BCC were investigated [16]. The present study compares effects of increased 1O2 and H2O2 concentrations on BCC and includes experiments on the activity of heterotrophic bacteria in the surface water of the humic matter rich south-west (SW) basin of Lake Grosse Fuchskuhle (North-eastern Germany). The experiments were designed to elucidate differences in sensitivity of dominating bacterial phylotypes towards naturally occurring ROS of different toxicity. We tested the following hypotheses: i) 1O2 and H2O2 exposure elicit specific changes in microbial activity and BCC and ii) ROS-induced changes differ between particle-attached and free-living bacterial communities. Investigation of the latter hypothesis is of particular importance since a higher generation of 1O2has been observed in particles compared to the ambient water in humic matter rich ecosystems [22,23].
Results
1O2and H2O2Cuncentrations in Surface Water Samples Three sets ofin situexperiments were performed in July 2006, September 2008 and August 2009. For each experiment day,1O2 steady state [1O2]SS concentrations and H2O2 formation were determined, because variations in sunlight intensity and in concentration of dissolved organic carbon (DOC) were observed (Table 1). By applying the furfuryl alcohol (FFA) method [24] we observed similar in situ [1O2]SS concentrations on all three
experiment days that were in the range of 11.2 to
14.1610214M in the surface water layer of the lake (Table 1). The kinetics of1O2formation differed between experiment days (Fig. 1A–C), but the dose of1O2 exposure was very similar and ranged from 56.2 to 63.5610214M Wh m22(C-Ls; Fig. 1D–F). Hydrogen peroxide concentrations were low in all water samples. During diurnal cycle studies,50 nM were detected on 11thJuly 2006 (data not shown), but in 2008 and 2009, H2O2 concentra-tions were in the range of 70 to 120 nM (Fig. 1H and I).
Environmental conditions with respect to ROS concentrations may have varied throughout the years. In order to ensure that the reactivity of natural organic matter (NOM) was similar on each experiment day, 0.22mm filtered water samples were further analysed (Materials S1). Normalization of ROS formation to mg DOC L21 revealed that the specific 1O2 formation was similar between the experiment days. In contrast, the specific H2O2 formation was higher in 2009 compared to 2006 and 2008 (Table S1). Large variations ofin situ1O2formation were not observed. In contrast, for H2O2an up to 4–5 fold variation in formation rate was detected (Table S1), but concentrations measured in lake water samples remained similar (Fig. 1H and I).
Modification of1O2and H2O2Concentrations
Allin situexperiments performed in the summers of 2006, 2008 and 2009 were designed to test whether effects of increased1O2 and H2O2 concentrations consistently differ in surface waters (hypothesis i). Respective field experiments (Fig. 2) were performed by obtaining water samples from the lake. Increased environmen-tal ROS levels, particularly of H2O2, were obtained by adding the photosensitizer Rose Bengal (RB), a poly-aromatic compound that specifically generates1O2in the presence of light and oxygen or by H2O2addition.
Concentrations of 1O2 increased by 1.3 to 8-fold in light incubations after RB addition (Fig. 1D–F). Addition of 5mM H2O2in 2009 or 10mM in 2006 and 2008 represented an increase in H2O2 concentrations by ,45 to 200-fold, respectively. In experiments with H2O2 addition, the concentrations decreased during the time of incubation and ranged between 0.25 and 4.2mM at the end of the experiments. Concentrations of H2O2 were lower in light incubations compared to dark controls (Fig. 1G–I) and H2O2 end concentrations were ,3 to 33-fold higher compared to the non-amended controls. This notion is in line with the high capacity for H2O2degradation found for humic matter rich water samples of the SW compartment (Materials S1).
Microbial Activity is Hampered by ROS Exposure
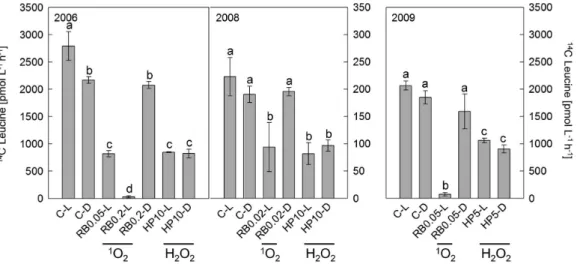
Activity of heterotrophic microorganisms, assessed by 14 C-Leucine incorporation, was highest in the light controls (C–L) reaching 2800, 223, and 2100 pmol leucine L21h21 in 2006, 2008, and 2009, respectively (Fig. 3). In 2006, microbial activity was significantly higher in the light than in the dark control. A similar trend occurred in 2008 and 2009, but it was not statistically significant. In all experiments, increased ROS levels caused inhibition of microbial activity. Precisely, generation of 1O2 (RB0.05-L) and addition of H2O2(HP10-L/D) decreased micro-bial activity to 30% of that in the respective C–L in 2006. Similar treatments caused a decrease to 43% in 2008. In 2009, the addition of 5mM H2O2in light and dark treatments (HP5-L/D) resulted in a decrease of microbial activity to 51 and 44% of that in the respective C–L. Singlet oxygen generation in RB0.2-L in 2006 and RB0.05-L in 2009 decreased microbial activity to below 5% of the respective C–L. In 2009, particle-attached and free-living bacteria were assessed separately to investigate differences in their potential to incorporate leucine. In controls, particle-attached bacteria incorporated 2.3 to 2.6-fold more leucine than free-living bacteria. Exposure to ROS decreased the activity of both fractions to the same extent (Fig. S1), indicating an overall similar sensitivity of the microbial community to ROS exposure.
Significant changes in cell numbers were not correlated with ROS exposure, except for the1O2exposure in 2008 (Fig. S2). As
Table 1.Selected environmental parameters on experiment days in 2006, 2008 and 2009.
Parameter Sample
2006 (12ndJuly) 2008 (5thSeptember) 2009 (14thAugust)
DOC (mg C L21) 23.3
61.8 34.060.1 28.461.1
Average light intensity (W m22) 570 445 557
In situ[1O
2]SS(10214M) 14.160.8 11.860.01 11.2
In situH2O2(nM) n.d. 12062.5 12061.42
DOC concentration, average light intensity and subsequent [1O
2]SSand H2O2concentrations slightly differed between experiment days of the three studied years. n.d.: not determined.
doi:10.1371/journal.pone.0092518.t001
Contrasting Effects of1O
2and H2O2on BCC
Figure 1. Formation of1O2and H2O2during experiments in 2006, 2008 and 2009.Kinetics of [1O2]SSin the surface water layer (A–C) were
calculated from the rate of furfuryl alcohol decay and the light intensity according to Haag and Hoigne (1986). The formation of1O2largely depends
on the light intensity (Table S1) and hence [1O
2]SSkinetics depend on the weather conditions. A. 12ndJuly 2006: a clear sky during the afternoon led
to a steady decrease in [1O2]SSconcentrations from noon to late afternoon. B. 5thSeptember 2008: a cloudy sky during the afternoon caused
fluctuation in [1O
2]SSconcentrations. C. 14thAugust 2009: a slightly overcasted sky during the whole day led to reduced fluctuations in [1O2]SS
concentrations compared to 2008. Values for solar radiation and rainfall within 30 days prior to the experiments were similar (Fig. S9) and hence all three experiments were conducted under comparable environmental situations. The addition of Rose Bengal (RB) increased the formation of1O
2(D–
F). D. 2.8 -fold for RB0.05-L and 8-fold for RB0.2-L in 2006, E. 1.3-fold in 2008, and F. 1.9-fold in 2009. Hydrogen peroxide concentrations were analysed in all samples at the end of the experiments (G–H). G. and H. 10mM H2O2were added in 2006 and 2008, respectively. I. 5mM H2O2were added in
2009. Numbers at RB and HP on the x-axis labels correspond tomM concentrations of RB or H2O2. Please note the different scale in panel H compared
to panels G and I. n.d.: not determined. An overview of the abbreviations used for the experimental setups is given in the box at the bottom of the Figure. C–L/D: Light and dark control incubations, RB-L: Light incubation with increased [1O
2]SS, RB-D: Dark control for RB, HP-L/D: Light and dark
incubations with H2O2. Dotted lines in A–C and error bars in D–F represent the standard deviation of the FFA method where three distinct water
samples were used to determine sample specific [1O
2]SSconcentrations. Error bars in G–H indicate the standard deviation of three analysed samples.
Contrasting Effects of1O
2and H2O2on BCC
observed in earlier experiments [16] increased numbers of micrococcoid cells were responsible for elevated total cell numbers (Table S2).
Different concentrations of RB and H2O2 were used on the three experiment days (Fig. 3). Overall, we aimed for a similar inhibition of microbial activity by 1O2 and H2O2 in order to enable a direct comparison of changes in BCC within each experiment. Therefore, several RB concentrations were tested in 2006 and 2008 (data not shown) and for further analysis only those treatments were chosen which showed a similar inhibition of14 C-Leucine incorporation.
Relative Abundance of Bacterial Groups After1O2and
H2O2Exposure
Clone libraries of free-living bacterial fractions in light controls (C-Ls) in 2006 and 2008 (Fig. 4) were dominated by Betaproteo-bacteria (54 and 31%), followed by ActinoBetaproteo-bacteria (15 and 23%) and Alphaproteobacteria (9 and 2%). In the respective particle-attached fractions, Betaproteobacteria (26 and 10%) and Bacter-oidetes (11 and 13%, Table 2) dominated, followed by Alphaproteobacteria (9 and 4%), and Actinobacteria (4 and 2%). In both years, less abundant groups including Firmicutes, Chlorobii, Verucomicrobia, and Acidobacteria represented only 4 to 6% of free-living as well as 6 to 13% of particle-attached bacterial fractions (Table 2). In 2006 and 2008, chloroplast sequences accounted for 2 and 15% of free-living or 24 and 31% of the particle-attached fractions, respectively.
Exposure to 1O2 and H2O2 induced specific shifts in BCC. Increased1O2exposure led to the disappearance of Actinobacteria and Bacteroidetes in both free-living and particle-attached
fractions, whereas the effects on Beta-, Alpha-, and Gammapro-teobacteria as well as Firmicutes depended on 1O2 dose and bacterial fraction (Fig. 4, Table 2). In 2006, a 2.8-fold increased 1
O2exposure decreased Betaproteobacteria by 37 and 24% in the free-living and particle-attached fraction, respectively. In contrast, Alphaproteobacteria increased by 46% in the free-living and by 6% in the particle-attached fraction, whereas Firmicutes increased by 15% only in the particle-attached fraction (Table 2). After an 8-fold increased 1O2 exposure, Gammaproteobacteria dominated and accounted for 69 and 38% of the free-living and particle-attached fraction, respectively. In contrast, Alphaproteobacteria disappeared in the particle-attached fraction, but did not change in the free-living one. Firmicutes strongly increased by 25% exclusively in the particle-attached fraction (Table 2). The much lower 1.3-fold elevated1O2exposure in 2008 increased Betapro-teobacteria by 27 and 7% in the free-living and particle-attached fraction, respectively. In both fractions, Alphaproteobacteria increased by 16 and 22%, and Gammaproteobacteria by 4 and 19%.
After H2O2exposure, BCC changed in a very different manner. The abundance of free-living Betaproteobacteria decreased by 41 and 4% in 2006 and 2008, but in both years they remained highly abundant (Fig. 4). Particle-attached Betaproteobacteria decreased after H2O2exposure by 20% in 2006, and were not detected in 2008. The change in relative abundance of free-living Actino-bacteria varied between an 18% increase (2006) and a 7% decrease (2008), but negative effects were less pronounced than after exposure to1O2. Actinobacteria remained highly abundant and the relative abundance of further bacterial groups only slightly changed after H2O2exposure (Table 2).
Different letters at the top of the bars depict statistically significant differences (with p#0.001) between values as determined by one-way ANOVA followed by pair-wise multiple comparison analysis with the Tukey’s test performed in Sigma Stat v. 2.0 (Systat Software). The same letters indicate that depicted values are not significantly different to each other.
doi:10.1371/journal.pone.0092518.g001
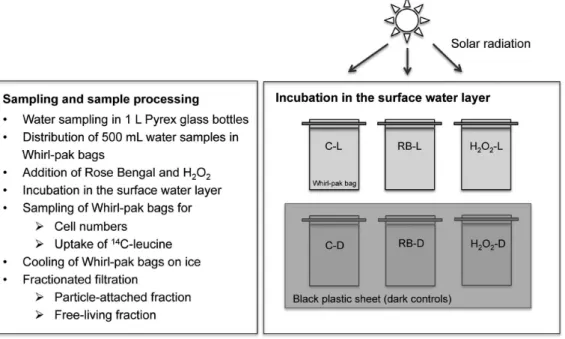
Figure 2. Design of field experiments.Field experiments performed in 2006, 2008 and 2009 followed the same experimental outline as displayed in the flow chart. Whirl-pak bags were incubated in the surface water layer on large metal racks after addition of Rose Bengal and H2O2. Dark controls
were covered with a black plastic sheet to avoid exposure to solar radiation. Abbreviations are given in Fig. 1. doi:10.1371/journal.pone.0092518.g002
Contrasting Effects of1O
2and H2O2on BCC
Figure 3. Activity of heterotrophic microorganisms after1O
2and H2O2exposure.Microbial activity was measured as leucine incorporation during 1 h dark incubation at the end of each experiment. Error bars indicate standard deviations of triplicate incubations. Different letters at the top of the bars depict statistically significant differences (with p#0.001) between values as determined by one-way ANOVA followed by pair-wise multiple comparison analysis with the Tukey’s test performed in Sigma Stat v. 2.0 (Systat Software). The same letters indicate that depicted values are not significantly different to each other. Tests were done separately for each year. Abbreviations are given in Fig. 1.
doi:10.1371/journal.pone.0092518.g003
Figure 4. Relative abundance of major bacterial groups.16S rRNA gene clone libraries generated with universal bacterial primers obtained from free-living (0.22–8mm in 2006 and 0.22–5mm in 2008) and particle-attached (.8 or.5mm, respectively) bacterial fractions after1O2and H2O2
exposure. Clone libraries were generated for control (C-L),1O
2(RB-L) and H2O2(HP-L) light treatments ofin situexperiments 2006 and 2008. The
relative abundance represents fractions (%) of all investigated clones of each clone library. For abbreviations see Fig. 1. Colours indicate the phylogenetic affiliation:Actinobacteria(purple),Gammaproteobacteria(brown),Alphaproteobacteria(red), andBetaproteobacteria(blue).
doi:10.1371/journal.pone.0092518.g004
Contrasting Effects of1O
2and H2O2on BCC
Table 2.Relative abundance and phylogenetic affiliation of sequenced phylotypes.
2006 2008
0.22–8mm .8mm 0.22–5mm .5mm
OTUs C-L RB0.05-L RB0.2-L HP10-L C-L RB0.05-L RB0.2-L HP10-L C-L RB0.02-L HP10-L C-L RB0.02-L HP10-L
Freshwater cluster
RDP Naive Bayesian rRNA
Classifier BLAST results
b-Proteobacteria 1 31 17 4 9 2 2 4 13 30 8 4 2 bet II, PnecC Burkholderiaceae 100% 99% P. necessarius
QLW-P1-DMWA-1T
CP000655
2 4 2 6 bet II, PnecA Burkholderiaceae 100% 97% P. acidophobus
MWH-PoolGreenA3
FM208180
3 2 2 13 2 13 20 4 2 2 bet I, Lhab-A4 Comamonadaceae 98% 99% Lake Grosse
Fuchskuhle clone FNE11-10
DQ501302
4 19 2 2 2 2 2 bet IV, RDP18A09 Methylophilaceae 100% 98% Parker river clone PRD18A09
AY947994
5 4 bet III, betIII-A1 Alcaligenaceae 100% 99% Grosse Lacke isolate QLW-p2DMWB-4
AJ938031
6 2 4 2 4 bet I, Lhab-A4 Comamonadaceae 100% 97% Lake IJssel clone Stal-17 AJ416187
7 4 6 4 6 bet VII Oxalobacteraceae 100% 97% Lake Grosse Fuchskuhle clone NE45
AJ575695
a-Proteobacteria 8 9 36 2 4 7 4 2 16 6 13 alf IV-A, Novo-A1 Sphingomonadaceae 100% 99% N. acidiphilum
FSW06-204dT
EU336977
9 19 11 2 Bradyrhizobiaceae 15% 96% Lake Pohlsee
clone Hv_38
EF667926
10 7 Hyphomicrobiaceae 36% 90% Mesorhizobiumsp.
CCBAU 33182
GU433452
11 2 4 9 2 alf II Caulobacteraceae 100% 97% Adriondack lake clone ADK-BTe02-51
EF520395
12 4 Hyphomicrobiaceae 46% 98% Rhodomicrobium vannielii
E.Y. 33T
M34127
13 7 2 alf I, alf I-B1 Beijerinckiaceae 69% 98% Lake Grosse Fuchskuhle isolate FSW06-301
FJ798303
14 2 9 alf VIII Acetobacteraceae 100% 95% Asaia lannaensisBCC 15733T AB286050
c-Proteobacteria 15 2 58 2 13 close to gam III Methylococcaceae 100% 95% Hypertrophic freshwater lake
clone ML-9-70.2
DQ520192
16 7 7 15 Legionellaceae 100% 96% Legionella longbeachae
ATCC 33484
AY444741
17 4 4 6 Legionellaceae 99% 92% Legionella impletisoli
OA1-1T
AB233209
18 4 Ectothiorhodospiraceae 70% 96% Activated sludge clone
AS1o9
AJ514448
19 2 6 19 4 gam I Methylococcaceae 100% 96% Methylomonas rubra
NCIMB 11913
AF304194
Contrasting
Effects
of
1
O
2
and
H
2O
2
on
BCC
PLOS
ONE
|
www.ploson
e.org
6
March
2014
|
Volume
9
|
Issue
3
|
Table 2.Cont.
2006 2008
0.22–8mm .8mm 0.22–5mm .5mm
OTUs C-L RB0.05-L RB0.2-L HP10-L C-L RB0.05-L RB0.2-L HP10-L C-L RB0.02-L HP10-L C-L RB0.02-L HP10-L
Freshwater cluster
RDP Naive Bayesian rRNA
Classifier BLAST results
Actinobacteria 20 15 33 4 2 23 16 2 acI-B, scB-3 Microbacteriaceae 45% 99% Lake Grosse Fuchskuhle
clone FSW11-16
DQ316348
Firmicutes 21 2 4 2 17 27 8 Paenibacillaceae 95% 93% Paenibacillus polymyxaSC2 CP002213
Chlorobii 22 4 2 2 9 17 17 Chlorobiaceae 100% 98% Pelodictyon
phaeoclathratiforme
BU-1T
CP001110
Bacteroidetes 23 2 11 4 4 13 4 Chitinophagaceae 100% 98% Lake Grosse Fuchskuhle
clone FukuS59
AJ290042
24 4 Sphingobacteriaceae 100% 96% Tatachia forest soil clone
TSC56
EU359966
Verucomicrobia 25 4 2 Subdivision5 78% 97% Lake Kinneret sediment
clone d0-26
AM409824
Acidobacteria 26 4 2 8 6 4 2 Holophagaceae 100% 96% Geotrix fermentans
ATCC 700665
U41563
Chloroplasts 27 13 2 7 55 2 13 Bacillariophyta 87% 97% Parker river clone PRD18F11
AY948053
28 4 2 8 Chlorarachniophyceae 40% 93% Parker river clone
PRD18D01
AY948021
29 2 20 4 15 12 2 6 Chlorarachniophyceae 68% 93% Adriondack lake clone
ADK-HDe02-54
EF520517
30 9 8 17 29 Cryptomonadaceae 100% 94% Adirondack lake clone
ADK-SGh02-76
EF520521
31 4 8 13 2 17 Cryptomonadaceae 100% 98% Parker river clone
PRD18E12
AY948043
32 8 Chlorophyta 100% 91% Polytoma oviforme
cloroplast
AF374188
Rare OTUs (%)* 6 2 2 7 7 2 8 4 4 4 2
Single OTUs (%)# 11 6 13 7 13 6 23 23 17 4 27 23 13 10
Total No. of clones
54 47 45 45 46 53 52 53 48 50 49 47 53 48
Coverage (%) 83 91 84 87 80 92 69 77 79 92 69 74 87 90
*Rare OTUs: OTUs that occur only once in one clone library;
#
Single OTUs: OTUs that occur only once in at least two clone libraries. doi:10.1371/journal.pone.0092518.t002
Contrasting
Effects
of
1
O
2
and
H
2O
2
on
BCC
PLOS
ONE
|
www.ploson
e.org
7
March
2014
|
Volume
9
|
Issue
3
|
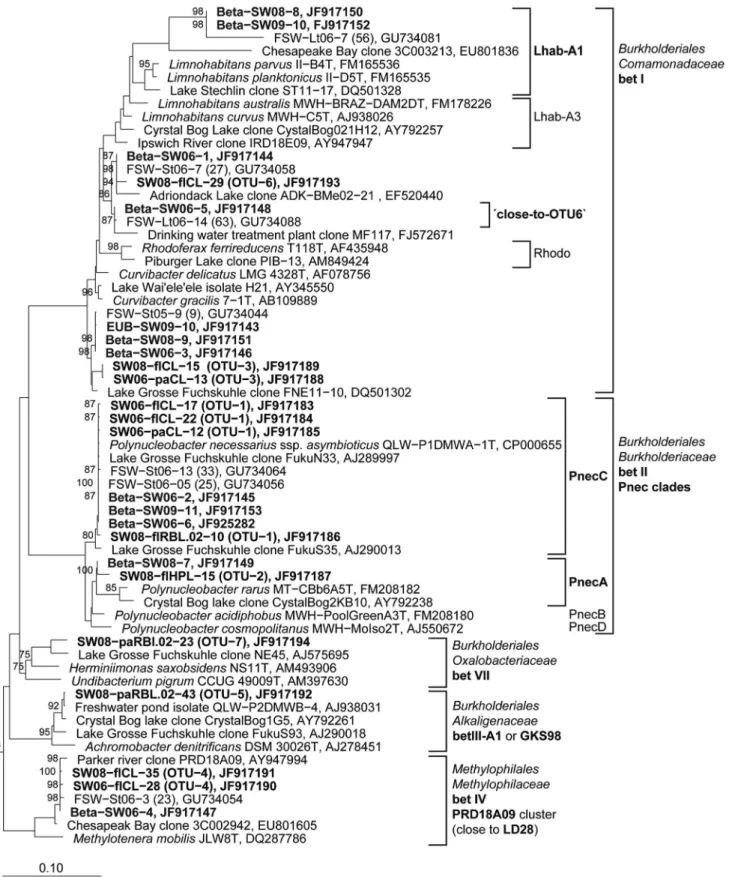
Figure 5. Phylogenetic affiliation of 16S rRNA gene sequences representing OTUs and DGGE bands to the Betaproteobacteria.
Maximum likelihood trees showing the phylogenetic affiliation of OTU and DGGE band sequences to theBetaproteobacteria.Sequences obtained from DGGE bands are depicted in bold letters. Numbers at roots represent bootstrap values ($70%) of 100 re-samplings. Scale bars: 0.1 nucleotide substitutions per site. Sequences representing OTUs are assigned as follows: SW: South West basin, 06, 08: year ofin situexperiment in 2006 or 2008, fl: free-living bacteria, pa: particle-attached bacteria. Sequences signed with EUB, Beta, or Actino are from Bacteria, Betaproteobacteria, or
Actinobacteria-specific RT-PCR DGGE bands, respectively. doi:10.1371/journal.pone.0092518.g005
Contrasting Effects of1O
2and H2O2on BCC
Changes in the Overall Bacterial Diversity by Clone Library Analysis
The coverage of the individual clone libraries ranged between 69 and 92%, with a mean coverage value of 82.4% (Table 1). Rarefaction analysis showed that rarefaction curves generated for each clone library did not reach complete saturation by a number of approx. 50 clones for each investigated clone library (Fig. S3). The lack of saturation was mainly due to single and rare OTUs, which ranged between 8 to 31%. The focus of our study, however,
was on investigating ROS-induced changes in relative abundance of the most prominent freshwater bacterial groups or species. Therefore, such single and rare OTUs were not investigated by sequence analysis and our clone library analyses did not aim to cover the overall diversity within each treatment. The number of investigated OTUs was sufficient to depict distinct differences in phylotype abundance after increased 1O2 and H2O2 exposure. Especially for free-living bacteria, rarefaction curves were closer to saturation after exposure with 0.05mM RB in the light (1O2 Figure 6. Phylogenetic affiliation of 16S rRNA gene sequences representing OTUs and DGGE bands to theAlphaproteobacteria.
Maximum likelihood trees showing the phylogenetic affiliation of OTU and DGGE band sequences to the Alphaproteobacteria. Details and abbreviations are indicated in the legend to Figure 5.
doi:10.1371/journal.pone.0092518.g006
Contrasting Effects of1O
2and H2O2on BCC
treatments) in 2006 and 2008, respectively (Fig. S3). This finding indicates that bacterial diversity after 1O2 treatments are lower than in C–L and H2O2light treatments for experiments in 2006 and 2008.
Effects of1O
2and H2O2Exposure on Predominant
Bacterial Phylotypes
Sequencing of clones representing the most abundant opera-tional taxonomic units (OTUs) revealed those bacterial phylotypes causing major changes in BCC upon ROS exposure (Fig. 5–9, Table 2). In 2008, Polynucleobacter necessarius (PnecC sub-cluster) represented the most abundantBetaproteobacteriaphylotype (OTU-1). Increased abundance ofBetaproteobacteriaafter1O2exposure was mainly due toP. necessariusand aLimnohabitans-related phylotype (OTU-3). Both phylotypes decreased after exposure to H2O2. A secondPolynucleobacterphylotype (OTU-2) representing the PnecA sub-cluster only occurred in the free-living fractions after H2O2 addition.
Increased abundance of Alphaproteobacteria after 1O2 exposure was mainly due to OTU-8 representingNovosphingobium acidiphilum (Table 2). In addition, increase of an uncultured phylotype (OTU-9) resulted in a highly increasedAlphaproteobacteriaabundance after 1
O2 exposure in 2006. After H2O2 exposure, in the attached fraction, a Caulobacteraceae-related phylotype (OTU-11) increased in relative abundance in 2008 and two other Alphaproteobacteria phylotypes (OTU-13/14) in 2006 (Table 2).
Five different phylotypes were responsible for the increased abundance ofGammaproteobacteriaafter high1O2exposure in 2006 (OTU-15 to 19, Table 2). In contrast, only one freshwater-cluster AcI-B phylotype (OTU-20) was responsible for the high abundance ofActinobacteriain controls and after H2O2exposure.
Changes in the Composition of Metabolically Active Bacteria
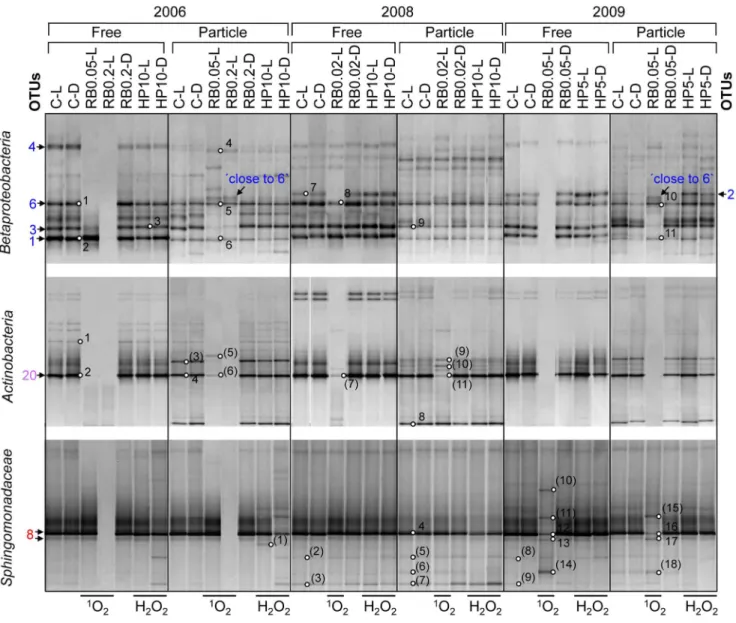
Analysis of metabolically active bacteria by unweighted pair-group method using arithmetic average (UPGMA) cluster analysis of Bacteria RT-PCR Denaturing Gradient Gel Electrophoresis (DGGE) patterns confirmed BCC changes after1O2and H2O2 exposure as observed by clone library analysis (Fig. 10 and S4). All in situ experiments performed in 2006, 2008 and 2009 were repeated within a few days (Fig. S5 A–C).
In UPGMA combining all experiments stable clusters were formed by patterns affiliated with experiments performed in the respective year (data not shown). Therefore, cluster analysis was performed separately for all three years, in which DGGE patterns of particle-attached and free-living bacteria formed separate clusters (Fig. 10) Within these clusters, control experiments (C-L/D, RB-Ds) and H2O2 treatments (HP-L/D) clustered with each other. In contrast,1O2exposure caused more pronounced changes in DGGE banding patterns. Particle-attached and free-living fractions in 2006 and 2009 were found in the same cluster after 2.8 and 1.9-fold (RB0.05-L, 2006 and 2009) and after 8-fold (RB0.2-L, 2006)1O2 Figure 7. Phylogenetic affiliation of 16S rRNA gene sequences representing OTUs and DGGE bands to theGammaproteobacteria.
Maximum likelihood trees showing the phylogenetic affiliation of OTU and DGGE band sequences to the Gammaproteobacteria. Details and abbreviations are indicated in the legend to Figure 5.
doi:10.1371/journal.pone.0092518.g007
Contrasting Effects of1O
2and H2O2on BCC
increase. After moderate 1O2 exposure (RB0.05-Ls), changes in DGGE bands representing the uncultured Alphaproteobacterium OTU-9 and theFirmicutesOTU-21 in both particle-attached and free-living fractions greatly affected cluster formation. At higher1O2 exposure (RB0.2-L), however, DGGE banding patterns of the free-living fraction were similar to the respective controls (Fig. 10) represented by P. necessarius OTU-1, N. acidiphilum OTU-8, and MethylococcaceaeOTU-15. In 2008, slightly increased1O2exposure (RB0.02-L) had a minor effect on BCC and the respective DGGE clusters were similar to the controls. In all three experiments, disappearance of the DGGE band representing AcI-BActinobacteria OTU-20 comprised the most obvious change in community composition of free-living bacteria after1O2exposure (Table 2).
BCC changes after H2O2exposure were generally caused by i) decreased intensity of DGGE bands representing P. necessarius OTU-1 andN. acidiphilumOTU-8 and ii) the absence of DGGE bands representingLimnohabitans-related OTU-3/6. These chang-es occurred in different extent in free-living fractions of all three experiments and also partially in the respective particle-attached fractions.
Phylotype-specific Changes within Major Bacterial Groups
Betaproteobacteria,Actinobacteria, andSphingomonadaceae-specific RT-PCR DGGE analysis increased the phylogenetic resolution of our study and revealed separate clusters for free-living and particle-attached bacteria by UPGMA analysis (Fig. S6). After 1O2 exposure (RB-Ls), DGGE banding patterns obtained for all three bacterial groups were separated from controls, whereas after H2O2 exposure, the DGGE bands always clustered together with controls.
Major DGGE bands of bothBetaproteobacteria fractions repre-sented P. necessarius OTU-1 and Limnohabitans-related OTU-3/6 (Fig. 11). In 2008 and 2009, the DGGE band representing PnecA
OTU-2 was observed with higher intensities in the free-living fractions. Singlet oxygen exposure resulted in different effects on phylotype composition of free-living vs. particle-attached Betapro-teobacteria. The 2.8-fold increased1O2exposure decreased diversity of free-livingBetaproteobacteria to solely 2 DGGE bands in 2006 represented by P. necessarius OTU-1 and Limnohabitans-related OTU-3. The 8-fold increased1O2exposure diminished all free-livingBetaproteobacteria, whereas DGGE bands of particle-attached BetaproteobacteriarepresentingP. necessarius OTU-1 and Limnohabi-tans-related OTU-6 were not affected by 1O2 exposure. In the same treatment, an additional DGGE band representing a phylotype closely related to OTU-6 occurred (DGGE band 5, Fig. 11). In 2008, the much lower 1O2 exposure led to the disappearance of a DGGE band in the free-living fraction representing PnecA OTU-2. The same DGGE band became more intense after H2O2exposure in both, particle-attached and free-living fractions of 2008 and 2009. In general, the effects of 1
O2exposure onBetaproteobacteriain 2006 were confirmed in 2009 whereby the 1.9-fold increased1O2exposure in 2009 had similar effects compared to the 8-fold increased1O2exposure in 2006.
The AcI-B OTU-20 represented the most abundant Actinobac-teria DGGE band of free-living and particle-attached fractions. However, the relative abundance of Actinobacteria was low on particles as revealed by clone-library (Fig. 4) andBacteriaRT-PCR DGGE analysis (Fig. 10). After1O2exposure,ActinobacteriaDGGE bands were lacking, except in 2008 when a DGGE band representing a Mycobacteria-related phylotype occurred (band 8, Fig. 8 and 11). Other DGGE bands present after 1O2exposure belonged to theVerrucomicrobia(Fig. 9 and 11).
Sphingomonadaceae-specific RT-PCR DGGE analysis indicated thatN. acidiphilum(OTU-8) was the pre-dominant Sphingomonada-ceaein the SW basin. Only high1O2exposure affected the intensity of its respective DGGE band (Fig. 11).
Figure 8. Phylogenetic affiliation of 16S rRNA gene sequences representing OTUs and DGGE bands to the Actinobacteria.Maximum likelihood trees showing the phylogenetic affiliation of OTU and DGGE band sequences to the Actinobacteria. Details and abbreviations are indicated in the legend to Figure 5.
doi:10.1371/journal.pone.0092518.g008
Contrasting Effects of1O
2and H2O2on BCC
Contrasting Effects of1O
2and H2O2on BCC
Discussion
Comparison of1O2and H2O2Toxicity
Moderately increased1O2and highly increased H2O2 concen-trations caused similar inhibition of 14C-leucine incorporation suggesting different toxic potentials of1O2and H2O2. This finding also indicates that small changes of 1O2 generation (frequent during diurnal changes in sunlight intensity) may hamper microbial activity in surface waters of humic lakes. In contrast, only large changes in H2O2concentrations may affect the activity of dominant bacterial species. However, the H2O2concentrations applied in our experiments were not exaggerated and the natural potential of H2O2formation in 0.22mm filtered lake water of the SW basin was high (Fig. S7). In H2O2 depleted water samples, H2O2concentrations in themM range can be reached rapidly after irradiation with sunlight or UV-A/B which has been frequently observed for boreal lakes [25,26]. Microorganisms strongly contribute to the decay of H2O2[27]. This is indicated by 2.4-fold higher H2O2 decay rates in our unfiltered water samples compared to those filtered through 0.22mm (Materials S1). Obviously, the bacterial community or at least some phylotypes can detoxify H2O2 and therefore balances H2O2 levels in their environment. This notion is in line with earlier findings that bacteria are involved in H2O2 degradation in marine surface waters [27] and that H2O2 degradation by some bacterial populations is important for growth of other bacteria in aquatic environments [28]. Hence, bacteria thriving in surface waters of humic lakes are well adapted to H2O2exposure and may prevent accumulation of toxic H2O2concentrations.
Contrasting Effects of1O2and H2O2on Actinobacteria
andBetaproteobacteria
AcI-BActinobacteriaand betII lineageBetaproteobacteriamainly of the PnecC sub-cluster are the most abundant bacterial groups in the SW basin [29,30,31].Actinobacteriaof the AcI-B cluster are low in abundance on particles [32]. Their high sensitivity to1O2and the finding that humic matter rich particles generate high amounts of 1O2 [23] could explain the obvious absence of AcI-B Actinobacteria from particles. Contrary, AcI-B Actinobacteriaof the SW basin were more resistant to H2O2exposure. Thus, it is likely that AcI-B Actinobacteria produce peroxidases to degrade recalci-trant organic matter and contribute to the high overall extracel-lular peroxidase activity in Lake Grosse Fuchskuhle [33]. This life-style requires increased resistance to peroxides and thus may explain the high relative abundance of AcI-B Actinobacteria at increased H2O2 concentrations. A recently analysed single cell genome of the AcI-B lineage supports this notion, because several genes encoding glutathione depended peroxiredoxins were iden-tified that potentially account for the proposed resistance against peroxides [34].
In Lake Grosse Fuchskuhle and in other freshwater ecosystems the abundances ofActinobacteriaandBetaproteobacteriaare negatively correlated [14,30], andActinobacterianumbers are usually lower in summer months. The addition of photo-chemically modified DOM to water samples increasedActinobacteriaabundance [14]. By irradiating DOM high amounts of H2O2accumulate [11], and the subsequent incubation in the dark excludes formation of 1O2. Therefore, only effects of H2O2 on bacterial dynamics can be monitored by such assays. Actinobacteria had a high resistance
against H2O2 in our study. In contrast, several Betaproteobacteria phylotypes detected in our study were H2O2sensitive, but resistant to1O2exposure. Consequently, the negative correlation between ActinobacteriaandBetaproteobacteriain the SW basin is at least partly the result of their contrasting resistance and sensitivity to1O2and H2O2.
High solar radiation causes high 1O2 exposure during the summer months and may result in reduced AcI-B Actinobacteria abundance. In contrast,P. necessariuswas favoured by increasing 1
O2concentrations and generally shows highest abundance and activities in summer [35] and it also grows well on photodegra-dation products of humic matter, such as acetate [36,37,38]. AcI-B Actinobacteria are more abundant in autumn and early spring [30,32] when input of unbleached NOM from the adjacent fen into the SW basin is high. This unbleached NOM generates much more H2O2than1O2(Materials S1) and may be a key regulator of the observed opposing dynamics of AcI-B Actinobacteria vs. Betaproteobacteria.
Alpha-andGammaproteobacteriaResist High1O2Doses Alpha- and Gammaproteobacteria are two major lineages of freshwater bacteria, which have gained relatively little attention in the past [39]. Our data and previously published clone libraries [29,30,31] indicate the persistence ofN. acidiphilum in the humic matter rich SW basin. Its relative abundance strongly increased during1O2exposure suggesting a high1O2resistance which can be explained by a high cellular carotenoid content [40]. In addition, Sphingomonadaceae are known to degrade aromatic compounds and N. acidiphilum was favoured by the addition of phenol that represents an important fraction of leached DOM [41]. Thus, cellular quenching of1O2by carotenoids and the use of aromatic compounds are features ofN. acidiphilum, which may well explain its persistence in humic matter rich systems.
The increase in relative abundance of several Alpha- and Gammaproteobacteriaafter1O2exposure may be related to specific defence-systems protecting, for example, anoxygenic phototrophic Alphaproteobacteriaagainst1O2damages [42,43]. This is supported by the recent finding that anoxygenic phototrophic bacteria of the SW-basin mainly consist of Alphaproteobacteria [44]. The key regulators controlling such cellular responses include specific RNA polymerase sigma factors and have been found in the genomes of several Alpha- and Gammaproteobacteria lineages [45] including non-phototrophic Caulobacter crescentus [46]. Thus, induction of 1O2-specific defence-systems may explain the increased relative abundance of theCaulobacteraceae-related phylo-type (OTU-11) in the present study.
Particle-attached Phylotypes are More Resistant to1O2
Exposure
Particles represent hotspots of bacterial activity in aquatic environments [47]. Humic matter rich particles have been shown to generate higher1O2concentrations compared to the surround-ing water by the application of hydrophobic 1O2 traps [23]. Recent studies could not verify a high1O2 generation in humic particles [48] or suggest that1O2is quenched by certain reactive groups [49]. Our study revealed the existence of particle-associated phylotypes that were obviously more resistant to1O2 exposure than their free-living counterparts. Particle-attached Figure 9. Phylogenetic affiliation of 16S rRNA gene sequences representing OTUs and DGGE bands to the less abundant bacterial groups and chloroplast sequences.Maximum likelihood trees showing the phylogenetic affiliation of OTU and DGGE band sequences to less abundant bacterial groups and chloroplast sequences. Details and abbreviations are indicated in the legend to Figure 5.
doi:10.1371/journal.pone.0092518.g009
Contrasting Effects of1O
2and H2O2on BCC
Contrasting Effects of1O
2and H2O2on BCC
bacteria represented byP. necessariusOTU-1 and the Limnohabitans-related OTU-6 were indeed more resistant to1O
2exposure than their free-living counterparts. Particle-associated bacteria exhibit different lifestyles and thus often represent different ecotypes [50], which requires also adaptation to different levels of oxidative stress. Alternatively, phylotypes in particle-attached and free-living fractions may represent the same ecotypes, whereby inducible response mechanisms against increased oxidative stress should
allow for colonization of particles in the upper, well-illuminated water layers. Furthermore, it cannot be fully excluded that P. necessarius 16S rRNA gene sequences in the particle-attached fraction (.5mm) originate from ciliate endosymbionts, namely Stentor amesthystinus (Dziallas and Grossart, unpubl. data). In contrast, highly1O2sensitive AcI-BActinobacteriawere absent from humic particles representing nutrient, but1O2rich microhabitats (see above).
Figure 10. Cluster analysis ofBacteriaRT-PCR DGGE patterns.Cluster analysis and RT-PCR DGGE patterns of metabolically active free-living (0.22–8mm in 2006 and 0.22–5mm in 2008 and 2009) and particle-attached (.8 or.5mm, respectively)Bacteriaofin situexperiments 2006, 2008 and
2009. UniversalBacteria16S rRNA gene targeting primers were used for analysis. Cluster analyses were performed in GelCompare II version 4.5 (Applied Maths) using unweighted pair-group method using arithmetic average (UPGMA) clustering based on the Pearson correlation which considers the intensity of DGGE bands. Distance matrices are shown in Fig. S4. DGGE bands marked with circles were sequenced. OTU numbers depicted next to the DGGE patterns point at DNA bands identical in DNA sequence (see Table 2). Colours of OTU numbers indicate the phylogenetic affiliation:Actinobacteria
(purple),Gammaproteobacteria(brown),Alphaproteobacteria(red), andBetaproteobacteria(blue), cyanobacteria/chloroplasts (green), and otherBacteria
(grey). Phylogenetic affiliations to sequenced DGGE bands are given in Fig. 5–9 and Table S6. Abbreviations are given in Fig. 1. doi:10.1371/journal.pone.0092518.g010
Figure 11. Group specific RT-PCR DGGE analysis.RT-PCR DGGE analysis of metabolically active free-living (0.22–8mm in 2006 and 0.22–5mm in
2008 and 2009) and particle-attached (.8 or.5mm, respectively)Betaproteobacteria,Actinobacteria, andSphingomonadaceaeafter1O2and H2O2
exposure. Group-specific 16S rRNA gene targeting primer-systems were used for analysis. All treatments ofin situexperiments 2006, 2008 and 2009 were investigated. DGGE bands marked with circles were sequenced. DGGE band numbers in brackets were not affiliated to the investigated groups. Numbers with arrows show the assignment to respective OTUs (see Table 2). Abbreviations are given in Fig. 1.
doi:10.1371/journal.pone.0092518.g011
Contrasting Effects of1O
2and H2O2on BCC
Defence Mechanisms Against Environmental ROS Exposure
Details on the presence of molecular response mechanisms against environmental ROS exposure in typical freshwater bacteria are elusive. Recently, molecular defence systems against 1
O2 exposure were found in bacteria [42,43] and defence strategies against H2O2 generated in aerobic metabolism are known in detail for several bacterial model systems [21].
Carotenoids are inevitable in photosynthetic bacteria and in the chloroplasts of plants to prevent photosystem based generation of 1
O2[42,43]. Non-photosynthetic bacteria also exhibit carotenoids, which likely serve as quenchers of 1O2 generated by cellular photosensitizers such as flavins [42] or by various extracellular sources. Cellular scavengers, which include amino acids such as L-histidine and trypotphan, reduced thiols (glutathione, thioredoxin), mycosoprine lysine and polyamines also minimize cellular damages by 1O2. Such scavengers need to be regenerated after their reaction with 1O2, and therefore enzymes involved in adjusting the cellular redox homeostasis need to be activated (reviewed in [43]).
In photosynthetic Alphaproteobacteria, response mechanisms to 1
O2exposure are controlled by the alternative sigmafactor RpoE, which is bound to the anti-sigmafactor ChrR under non-stress conditions. The release of RpoE from ChrR after1O2exposure triggers the induction of genes encoding stress response mecha-nisms and further regulatory factors, including RpoHIIand several small regulatory RNAs [42]. Homologs of these sigmafactors are conserved in photosynthetic Alphaproteobacteria and have been found in several Beta- and Gammaproteobacteria lineages [45]. Genomes of species representing abundant freshwater bacterial clades did not harbour homologous genes. Hence, defence systems and their control in abundant freshwater bacteria may substan-tially differ from established bacterial model systems.
Very likely, individual bacterial lineages use different strategies to overcome natural1O2exposure, which could explain very well the species specific sensitivity to1O2exposure in our study.
Hydrogen peroxide is detoxified by cellular enzymes such as catalases and peroxidases (glutathione peroxidases and peroxir-edoxin) [21]. Increased H2O2 concentrations lead to rapid cell death by the oxidation and disassembly of iron-sulphur clusters, which are common in electron transport chain components. Hydrogen peroxide together with free iron(II) leads to the formation of highly toxic hydroxyl radials by the Fenton reaction, which rapidly react with most cellular components and facilitate cell mortality. Therefore, cellular levels of H2O2 are tightly balanced and the cellular response is well regulated by, for example, OxyR or PerR which coordinate genes for H2O2 degradation, glutathione turnover, production of redox buffers as glutaredoxin and thioredoxin as well as genes involved in controlling iron metabolism. All bacteria with an aerobic metabolism, therefore, require defence systems against H2O2 exposure. This may explain, why H2O2had a much smaller effect on BCC compared to1O2in the environment.
Niche Separation of Closely Related Species Caused by Exposure to Different ROS
Our experiments in 2008 indicate niche separation of closely related Polynucleobacter phylotypes by moderately increased 1O
2 exposure. ThePolynucleobacterphylotype of the PnecC sub-cluster (OTU-1) was highly resistant against exposure to 1O2, but negatively affected by H2O2. In contrast, the Polynucleobacter phylotype of the PnecA sub-cluster (OTU-2) was only detected after H2O2 exposure in clone libraries of free-living bacteria.
Additionally, a corresponding DGGE band was observed in all free-living fractions byBetaproteobacteria-specific RT-PCR DGGE analysis, except after intense 1O2 exposure. Hence, ecological niches of those related phylotypes might be separated by variations in their sensitivity to 1O2 and H2O2. In line with our finding, occurrence of the Polynucleobacter sub-cluster PnecA and PnecC depends on lake colour [51], most likely because H2O2formation largely depends on concentration and quality of NOM [25]. Moreover, the presence of variousPolynucleobactersub-clusters may also reflect the availability of different substrates since Polynucleo-bacterspecies assimilate low-molecular-weight substances [38] that can be also generated by photochemical NOM degradation.
We further observed ROS dependent niche separation for Limnohabitans-related phylotypes.Betaproteobacteria-specific RT-PCR DGGE patterns revealed the occurrence of aLimnohabitans-related phylotype closely related to OTU-69on particles after increasing 1
O2exposure in 2006 and 2009. This phylotype was also enriched after long-term exposure with moderately increased1O2, whereas the OTU-6 phylotype only occurred in the respective controls [16] indicating a lower 1O2 resistance. Fortunately, we were able to isolate a respective strain from the SW basin and found an efficient adaptation to inhibitory1O2exposure by pre-incubation with non-inhibitory 1O2 concentrations (data not shown). This notion suggests that highly effective response mechanisms to increased 1
O2 may be present in this specific Limnohabitans strain. Niche separation of coexisting closely related Limnohabitans strains has been shown recently [52], but in this case it was caused by differences in predation and virus infections. Niche separation of closely related phylotypes of Limnohabitans by 1O2 exposure underlines our hypothesis that different ROS affect BCC in a highly phylotype-specific manner, particularly in humic matter rich lakes.
Conclusions
From our data we conclude that differences in sensitivity to1O2 and H2O2may explain the negative correlation in abundance of Actinobacteria and Betaproteobacteria in the surface waters of Lake Grosse Fuchskuhle and elsewhere. The exclusion of specific bacterial lineages from humic matter rich particles and the presence of species-like taxa due to ROS specific separation of ecological niches should be regarded as an ecological factor shaping natural microbial communities. Hence, temporal and spatial differences in ROS generation, particularly in humic matter rich aquatic ecosystems, have the potential to affect major microbial processes and their rates. For example, niche separation by ROS has strong implications for bacterial adaptation and evolution in natural ecosystems. We propose that changes in1O2 exposure have a larger impact on BCC than H2O2, because1O2is i) more toxic compared to H2O2 and ii) defence mechanisms against H2O2 are present in all aerobic organisms, whereas putative defences against singlet oxygen exposure may only occur in bacteria specifically adapted to cellular or environmental1O
2 formation. Further, insights into the molecular mechanisms of cellular defences against environmental ROS in general and singlet oxygen in particular are necessary to understand in detail the role of1O2and H2O2for controlling activity and composition of aquatic microbial communities.
Materials and Methods
Study Site
All field studies were conducted in the humic acid rich south-west basin of the artificially divided dystrophic Lake Grosse
Contrasting Effects of1O
2and H2O2on BCC
Fuchskuhle [52]. Physico-chemical parameters of the lake were described previously [16,29,30] and are compiled for all exper-imental periods in Table S3.
The IGB is authorized by the Landkreis Oberhavel to obtain samples from Lake Grosse Fuchskuhle and to conduct mesocosm experiments as performed in our study. Our studies did not endanger protected wildlife in or around the lake.
Sampling and Experimental Conditions
Subsurface water samples were collected in autoclaved Pyrex-glass bottles on the same day prior to the start ofin situexposure experiments. All set ups were prepared in a dark shelter at the lake shore and water samples were subsequently incubated 10 cm below the water surface in the humic SW basin of Lake Grosse Fuchskuhle.
Generation of1O2was artificially increased by adding 0.02 to 0.2mM of the photosensitizer Rose Bengal under sunlight exposure (RB-L). Concentrations of H2O2 were experimentally increased by adding 5–10mM H2O2to enhance peroxide stress in light and dark incubations (HP-L and HP-D). Controls included light and dark incubations of natural lake water (C-L and C–D) without addition of any chemicals and a RB dark control (RB-D). For the first experiment on 12thJuly 2006 [16], 1 L water samples were incubated in polypropylene bags (Carl Roth, Karlsruhe, Germany) between 13:30 and 18:00. The light treatments were repeated in 2006 on 14thJuly (C-L), 15thJuly (RB0.2-L), 18thJuly (RB0.05-L) and 20thJuly (HP-L). In each experiment we compared the exposure to the untreated control obtained at the start of the experiment. The second experiment was performed on 5th September 2008 by incubating 400 mL water samples in polyeth-ylene Whirl-Pak Bags (Nasco, Fort Atkinson, WI, USA) between 12:15 and 16:15. Prior to incubations, water samples were diluted with an equal volume of 0.22mm pre-filtered surface water. A replicate of this experiment was performed on 4thSeptember. In the third experiment on 14thAugust 2009, we incubated 500 mL water samples in Whirl-Pak Bags between 9:00 and 13:00. All Whirl-Pak bags were covered with UV-A/B absorbing polyester sheets 90 NR (Modulor, Berlin) to exclude effects of UV-A/B radiation. The experiment was repeated in triplicates on 17thAugust. Transmission spectra are given in Fig. S8 for plastic bags and sheets, respectively. Solar radiation and rainfall affects the NOM reactivity in the lake. In order to monitor pre-experiment weather conditions, weather data for 30 day prior to the each experiments were obtained from the weather station in Menz (53u109N, 13u059E). Menz is closely located to Lake Grosse Fuchskuhle. The data were purchased from the Deutscher Wetterdienst (www.dwd.de) and depicted in the Figure S9.
Measurement of1O2and H2O2
ROS concentrations were determined in 0.22mm filtered water samples. Singlet oxygen steady state concentrations ([1O
2]SS) were measured using furfuryl alcohol [24] as described previously [16]. Concentrations of H2O2were measured by using the Amplex Red method [53] with slight modifications (Materials S1). Analysis were performed in triplicates. Differences between treatments were analysed by one-way ANOVA followed by pair-wise multiple comparison analysis with the Tukey test (Sigma Stat version 2.0, Systat Software, Richmond, California, USA).
Bacterial Numbers and Microbial Activity
Bacteria cell numbers were determined by Sybr Green I staining and epifluorescence microscopy [16]. Microbial activity was measured by [14C]-leucine incorporation [54]. Sample-triplicates (5 mL) and formalin-fixed controls were incubated
immediately after experiments with [14C]-leucine (1.1561010Bq
mmol21; Amersham) for 1 h atin situ temperature in the dark. Incubations were stopped by formalin addition.
Simultaneous DNA and RNA Extraction from Water Samples
Allin situexperiments performed in 2006, 2008 and 2009 were repeated within a few days. Water samples were immediately put on ice prior to filtration. Particle-attached bacteria were collected on 8mm cellulose-nitrate membranes (Satorius, Go¨ttingen, Germany) in 2006 or on 5mm sterile Minisart syringe filters (Sartorius) in 2008 and 2009. Free-living bacteria from the 5mm filtrates were collected on 0.22mm SterivexTM-GP filter units (Millipore, Schwalbach, Germany) and filters were immediately stored at 280uC. Triplicates from the second experiment performed in 2009 were pooled prior to the extraction of nucleic acids. DNA and RNA were extracted simultaneously as described by [55]. Reaction volumes were decreased for the use of 2-ml tubes. Precipitated nucleic acids were resuspended in 100ml RNase/DNase-free water (Carl Roth). RNA extracts were treated with 1 U RQ1 DNase (Promega, Madison, WI, USA) and purified with phenol/chloroform (2006) or were incubated with 1 U DNase I (Fermentas, St. Leon-Rot, Germany), which was subsequently heat-inactivated (2008 and 2009).
16S rRNA Gene Clone Libraries and RT-PCR DGGE
Bacterial 16S rRNA gene clone libraries were generated with primers 8F and 1492R [56] and operational taxonomic units (OTUs) were defined by Amplified Ribosomal DNA Restriction Analysis (ARDRA) [57]. Community changes of metabolically activeBacteria, Actinobacteria, Betaproteobacteria, andSphingomonadaceae were investigated by 16S rRNA targeting RT-PCR DGGE. Details are given in Materials S1 and Tables S4 and S5.
Phylogenetic Analysis of 16S rRNA Gene Sequences
Sequences were aligned with the SINA Web aligner (http:// www.arb-silva.de/aligner/) and analysed in ARB [58] using the SILVA SSURef NR 104 database [59]. Maximum likelihood trees were constructed with using RAxML v7.04 [60] with GTR-GAMMA and rapid bootstrap analysis. Trees were generated with nearly full-length sequences (.1300 nt) spanningE. colipositions 56 to 1444 [61]. Tree topologies were confirmed by the generation of trees using Proteobacteria, Actinobacteria, and Bacteria 50% base frequency filters. Partial sequences were added with ARB parsimony without changing the overall tree topology. Sequences are deposited in GenBank with accession numbers JF917134– JF917235, JF925281, and JF925282.
Supporting Information
Figure S1 Activity of heterotrophic bacteria after 1O2
and H2O2exposure.
(PDF)
Figure S2 Cell numbers in controls and in1O2and H2O2
treatments.
(PDF)
Figure S3 Rarefaction analysis of nearly full-length 16S rRNA gene clone libraries.
(PDF)
Figure S4 Distance matrices of Pearson correlation based UPGMA cluster analysis.
(PDF)
Contrasting Effects of1O
2and H2O2on BCC
Figure S5 Robustness of changes in BCC observed by RT-PCR-DGGE analysis shown by repeats of the 2006 (A), 2008 (B) and 2009 (C)in situexperiments.
(PDF)
Figure S6 Cluster analysis ofBetaproteobacteria, Acti-nobacteria, andSphingomonadaceae-specific 16S rRNA gene based RT-PCR DGGE analysis.
(PDF)
Figure S7 Delayed formation of hydrogen peroxide (H2O2) in 0.22mm filtered water samples exposed to
natural sunlight.
(PDF)
Figure S8 Transmission scans of poly-propylene (PP) bags, poly-ethylene (PE) Whirl-Pak bags, and the UVA/B block sheet.
(PDF)
Figure S9 Weather data for 30 day prior to the experiments carried out in 2006, 2008, and 2009.
(PDF)
Table S1 NOM concentrations and reactivity of surface water samples from the SW basin of Lake Grosse Fuchskuhle.
(PDF)
Table S2 Cell numbers of in situ incubation experi-ments in 2006 and 2008.
(PDF)
Table S3 Physico-chemical parameters of Lake Grosse Fuchskuhle SW compartment.
(PDF)
Table S4 Sequences of 16S rRNA gene targeting oligo-nucleotide primer used for RT-PCR DGGE analysis.
(PDF)
Table S5 PCR and RT-PCR programs for the amplifi-cation of 16S rRNA and 16S rRNA gene fragments of
Bacteria and bacterial subgroups used for DGGE fingerprint analysis.
(PDF)
Table S6 Phylogenetic affiliation of 16S rRNA gene sequences representing DGGE bands.
(PDF)
Materials S1 Characterization of water sample photo-reactivity, including NOM characteristics of south-west compartment samples, comparison of water sample photo-reactivity, in situ H2O2formation and decay, and
the potential photochemical effects of unbleached ma-terial from the acidic fen area. Investigation of bacterial community composition by 16S rRNA (gene) based methods by the generation and screening of 16S rRNA gene clone libraries, 16S rRNA targeting reverse transcriptase (RT)-PCR DGGE analysis and group-specific 16S rRNA targeting RT-PCR DGGE analysis.
(PDF)
Acknowledgments
We thank Elke Mach for leucine incorporation measurements. Ivette Salka helped in 2008 experiments, and Franziska Leunert and Kai Sto¨rkel in 2009 experiments. Ryan Newton kindly provided the ARB database generated for phylogenetic classification of freshwater bacteria [39]. Beate Lindenstruth is acknowledged for determining DOC concentrations. Meteorological information was kindly provided by the Neuglobsow measurement station of the German Environmental Agency (UBA).
Author Contributions
Conceived and designed the experiments: JG SG HPG. Performed the experiments: JG SG HPG BB. Analyzed the data: JG SG BB VS. Contributed reagents/materials/analysis tools: JG HPG. Wrote the paper: JG SG HPG.
References
1. Pomeroy LR (1974) The ocean’s food web: A changing paradigm Bioscience 24: 499–504.
2. Goldstone JV, Pullin MJ, Bertilsson S, Voelker BM (2002) Reactions of hydroxyl radical with humic substances: Bleaching, mineralization, and production of bioavailable carbon substrates. Environ Sci Technol 36: 364–372.
3. Moran MA, Zepp RG (1997) Role of photoreactions in the formation of biologically labile compounds from dissolved organic matter. Limnol Oceanogr 42: 1307–1316.
4. Keil RG, Kirchman DL (1994) Abiotic transformation of labile protein to refractory protein in sea-water. Mar Chem 45: 187–196.
5. Bertilsson S, Tranvik LJ (2000) Photochemical transformation of dissolved organic matter in lakes. Limnol Oceanogr 45: 753–762.
6. Baxter RM, Carey JH (1983) Evidence for photochemical generation of superoxide ion in humic waters. Nature 306: 575–576.
7. Cooper WJ (1989) Sunlight induced photochemistry of humic substances in natural waters: major reactive species. Adv Chem Ser 219: 332–362. 8. Zepp RG, Wolfe NL, Baughman GL, Hollis RC (1977) Singlet oxygen in
natural waters. Nature 267: 421–423.
9. Dalrymple RM, Carfagno AK, Sharpless CM (2010) Correlations between dissolved organic matter optical properties and quantum yields of singlet oxygen and hydrogen peroxide. Environ Sci Technol 44: 5824–5829.
10. Cory RM, McNeill K, Cotner JP, Amado A, Purcell JM, et al. (2010) Singlet oxygen in the coupled photochemical and biochemical oxidation of dissolved organic matter. Environ Sci Technol 44: 3683–3689.
11. Anesio AM, Grane´li W, Aiken GR, Kieber DJ, Mopper K (2005) Effect of humic substance photodegradation on bacterial growth and respiration in lake water. Appl Environ Microbiol 71: 6267–6275.
12. Joux F, Jeffrey WH, Abboudi M, Neveux J, Pujo-Pay M, et al. (2009) Ultraviolet radiation in the rhone river lenses of low salinity and in marine waters of the northwestern mediterranean sea: attenuation and effects on bacterial activities and net community production. Photochem Photobiol 85: 783–793. 13. Judd KE, Crump BC, Kling GW (2007) Bacterial responses in activity and
community composition to photo-oxidation of dissolved organic matter from soil and surface waters. Aquat Sci 69: 96–107.
14. Pe´rez MT, Sommaruga R (2007) Interactive effects of solar radiation and dissolved organic matter on bacterial activity and community structure. Environ Microbiol 9: 2200–2210.
15. Piccini C, Conde D, Pernthaler J, Sommaruga R (2009) Alteration of chromophoric dissolved organic matter by solar UV radiation causes rapid changes in bacterial community composition. Photochem Photobiol Sci 8: 1321– 1328.
16. Glaeser SP, Grossart H-P, Glaeser J (2010) Singlet oxygen, a neglected but important environmental factor: short-term and long-term effects on bacterio-plankton composition in a humic lake. Environ Microbiol 12: 3123–3136. 17. Ogilby PR (2010) Singlet oxygen: there is indeed something new under the sun.
Chem Soc Rev 39: 3181–3209.
18. Davies MJ (2004) Reactive species formed on proteins exposed to singlet oxygen. Photochem Photobiol Sci 3: 17–25.
19. Ryter SW, Tyrrell RM (1998) Singlet molecular oxygen (O-1(2)): A possible effector of eukaryotic gene expression. Free Rad Biol Med 24: 1520–1534. 20. Cooper WJ, Lean DRS (1989) Hydrogen-peroxide concentration in a northern
lake - photochemical formation and diel variability. Environ Sci Technol 23: 1425–1428.
21. Imlay JA (2008) Cellular defenses against superoxide and hydrogen peroxide. Annu Rev Biochem 77: 755–776.
22. Grandbois M, Latch DE, McNeill K (2008) Microheterogeneous concentrations of singlet oxygen in natural organic matter isolate solutions. Environ Sci Technol 42: 9184–9190.
23. Latch DE, McNeill K (2006) Microheterogeneity of singlet oxygen distributions in irradiated humic acid solutions. Science 311: 1743–1747.
24. Haag WR, Hoigne J (1986) Singlet oxygen in surface waters. 3. Photochemical formation and steady-state concentrations in various types of waters. Environ Sci Technol 20: 341–348.
25. Ha¨kkinen PJ, Anesio AM, Grane´li W (2004) Hydrogen peroxide distribution, production, and decay in boreal lakes. Can J Fish Aqua Sci 61: 1520–1527. 26. Scully NM, McQueen DJ, Lean DRS, Cooper WJ (1996) Hydrogen peroxide
formation: The interaction of ultraviolet radiation and dissolved organic carbon in lake waters along a 43–75 degrees N gradient. Limnol Oceanogr 41: 540–548.
Contrasting Effects of1O
2and H2O2on BCC
27. Petasne RG, Zika RG (1997) Hydrogen peroxide lifetimes in south Florida coastal and offshore waters. Mar Chem 56: 215–225.
28. Morris JJ, Johnson ZI, Szul MJ, Keller M, Zinser ER (2011) Dependence of the cyanobacteriumProchlorococcuson hydrogen peroxide scavenging microbes for growth at the ocean’s surface. PLOS ONE 6. doi: 10.1371/journal.-pone.0016805.
29. Allgaier M, Grossart H-P (2006) Diversity and seasonal dynamics of Actinobacteria populations in four lakes in northeastern Germany. Appl Environ Microbiol 72: 3489–3497.
30. Burkert U, Warnecke F, Babenzien D, Zwirnmann E, Pernthaler J (2003) Members of a readily enriched betaproteobacterial clade are common in surface waters of a humic lake. Appl Environ Microbiol 69: 6550–6559.
31. Glo¨ckner FO, Zaichikov E, Belkova N, Denissova L, Pernthaler J, et al. (2000) Comparative 16S rRNA analysis of lake bacterioplankton reveals globally distributed phylogenetic clusters including an abundant group ofActinobacteria. Appl Environ Microbiol 66: 5053–5065.
32. Allgaier M, Grossart H-P (2006) Seasonal dynamics and phylogenetic diversity of free-living and particle-associated bacterial communities in four lakes in northeastern Germany. Aquat Microb Ecol 45: 115–128.
33. Buck U, Babenzien HD, Zwirnmann E (2008) Extracellular peroxidase activity in an experimentally divided lake (Grosse Fuchskuhle, northern Germany). Aquat Microb Ecol 51: 97–103.
34. Garcia SL, McMahon KD, Martinez-Garcia M, Srivastava A, Sczyrba A, et al. (2013) Metabolic potential of a single cell belonging to one of the most abundant lineages in freshwater bacterioplankton. ISME J 7: 137–147.
35. Grossart HP, Jezbera J, Hornak K, Hutalle KML, Buck U, et al. (2008) Top-down and bottom-up induced shifts in bacterial abundance, production and community composition in an experimentally divided humic lake. Environ Microbiol 10: 635–652.
36. Buck U, Grossart HP, Amann R, Pernthaler J (2009) Substrate incorporation patterns of bacterioplankton populations in stratified and mixed waters of a humic lake. Environ Microbiol 11: 1854–1865.
37. Hahn MW, Lang E, Brandt U, Wu QL, Scheuerl T (2009) Emended description of the genusPolynucleobacterand the speciesPolynucleobacter necessariusand proposal of two subspecies,P.necessariussubsp.necessariussubsp nov andP.necessariussubsp
asymbioticussubsp nov. Int J Syst Evol Micr 59: 2002–2009.
38. Watanabe K, Komatsu N, Ishii Y, Negishi M (2009) Effective isolation of bacterioplankton genusPolynucleobacterfrom freshwater environments grown on photochemically degraded dissolved organic matter. FEMS Microbiol Ecol 67: 57–68.
39. Newton RJ, Jones SE, Eiler A, McMahon KD, Bertilsson S (2011) A Guide to the natural history of freshwater lake bacteria. Microbiol Mol Biol Rev 75: 14– 49.
40. Glaeser SP, Kampfer P, Busse H-J, Langer S, Glaeser J (2009)Novosphingobium acidiphilumsp. nov., an acidophilic salt-sensitive bacterium isolated from the humic acid-rich Lake Grosse Fuchskuhle. Int J Syst Evol Micr 59: 323–330. 41. Hutalle-Schmelzer KML, Zwirnmann E, Kruger A, Grossart HP (2010)
Enrichment and cultivation of pelagic bacteria from a humic lake using phenol and humic matter additions. FEMS Microbiol Ecol 72: 58–73.
42. Glaeser J, Nuss AM, Berghoff BA, Klug G (2011) Singlet oxygen stress in microorganisms. In: Poole RK, editor. Advances in Microbial Physiology, Vol 58. 141–173.
43. Ziegelhoffer EC, Donohue TJ (2009) Bacterial responses to photo-oxidative stress. Nat Rev Microbiol 7: 856–863.
44. Salka I, Cuperova Z, Masin M, Koblizek M, Grossart HP (2011)Rhodoferax -related pufM gene cluster dominates the aerobic anoxygenic phototrophic communities in German freshwater lakes. Environ Microbiol 13: 2865–2875.
45. Dufour YS, Landick R, Donohue TJ (2008) Organization and evolution of the biological response to singlet oxygen stress. J Mol Biol 383: 713–730. 46. Lourenc¸o RF, Gomes SL (2009) The transcriptional response to cadmium,
organic hydroperoxide, singlet oxygen and UV-A mediated by the sigma(E)-ChrR system inCaulobacter crescentus. Mol Microbiol 72: 1159–1170. 47. Grossart HP, Simon M, Logan BE (1997) Formation of macroscopic organic
aggregates (lake snow) in a large lake: The significance of transparent exopolymer particles, phytoplankton, and zooplankton. Limnol Oceanogr 42: 1651–1659.
48. Minella M, Romeo F, Vione D, Maurino V, Minero C (2011) Low to negligible photoactivity of lake-water matter in the size range from 0.1 to 5 mu m. Chemosphere 83: 1480–1485.
49. Carlos L, Pedersen BW, Ogilby PR, Martire DO (2011) The role of humic acid aggregation on the kinetics of photosensitized singlet oxygen production and decay. Photochem Photobiol Sci 10: 1080–1086.
50. Grossart H-P (2010) Ecological consequences of bacterioplankton lifestyles: changes in concepts are needed. Environ Microbiol Rep 2: 706–714. 51. Jones SE, Newton RJ, McMahon KD (2009) Evidence for structuring of
bacterial community composition by organic carbon source in temperate lakes. Environ Microbiol 11: 2463–2472.
52. Simek K, Kasalicky V, Hornak K, Hahn MW, Weinbauer MG (2010) Assessing niche separation among coexistingLimnohabitansstrains through interactions with a competitor, viruses, and a bacterivore (vol 76, pg 1406, 2010). Appl Environ Microbiol 76: 3762–3762.
53. Tranvik L, Kokalj S (1998) Decreased biodegradability of algal DOC due to interactive effects of UV radiation and humic matter. Aquat Microb Ecol 14: 301–307.
54. Simon M, Azam F (1989) Protein content and protein synthesis rates of planktonic marine bacteria. Mar Ecol Prog Ser 51: 201–213.
55. Eichler S, Weinbauer MG, Dominik D, Ho¨fle MG (2004) Extraction of total RNA and DNA from bacterioplankton. In: Kowalchuk GA, Bruijn FJD, Head IM, Akkermans ADL, van Elsas JD, editors. Molecular microbial ecology manual, 2nd ed. Dordrecht, The Netherlands: Kluwer Academic Publishers. 103–120.
56. Lane DJ (1991) 16S/23S rRNA sequencing. In: Stackebrandt E, Goodfellow M, editors. Nucleic acid techniques in bacterial systematics. Chichester: John Wiley. 115–174.
57. Liu WT, Marsh TL, Cheng H, Forney LJ (1997) Characterization of microbial diversity by determining terminal restriction fragment length polymorphisms of genes encoding 16S rRNA. Appl Environ Microbiolol 63: 4516–4522. 58. Ludwig W, Strunk O, Westram R, Richter L, Meier H, et al. (2004) ARB: a
software environment for sequence data. Nucleic Acids Res 32: 1363–1371. 59. Pruesse E, Quast C, Knittel K, Fuchs BM, Ludwig WG, et al. (2007) SILVA: a
comprehensive online resource for quality checked and aligned ribosomal RNA sequence data compatible with ARB. Nucleic Acids Res 35: 7188–7196. 60. Stamatakis A (2006) RAxML-VI-HPC: Maximum likelihood-based phylogenetic
analyses with thousands of taxa and mixed models. Bioinformatics 22: 2688– 2690.
61. Brosius J, Palmer ML, Kennedy PJ, Noller HF (1978) Complete nucleotide-sequence of a 16S ribosomal-RNA gene fromEscherichia coli. Proc Nat Acad Sci USA 75: 4801–4805.
62. Wang Q, Garrity GM, Tiedje JM, Cole JR (2007) Naive Bayesian classifier for rapid assignment of rRNA sequences into the new bacterial taxonomy. Appl Environ Microbiol 73: 5261–5267.
63. Altschul SF, Gish W, Miller W, Myers EW, Lipman DJ (1990) Basic local alignment search tool. J Mol Biol 215: 403–410.
Contrasting Effects of1O
2and H2O2on BCC
![Figure 1. Formation of 1 O 2 and H 2 O 2 during experiments in 2006, 2008 and 2009. Kinetics of [ 1 O 2 ] SS in the surface water layer (A–C) were calculated from the rate of furfuryl alcohol decay and the light intensity according to Haag and Hoigne (1986](https://thumb-eu.123doks.com/thumbv2/123dok_br/18276652.345136/3.918.87.751.89.885/figure-formation-experiments-kinetics-calculated-furfuryl-intensity-according.webp)